
Chapter 11: Defense in Depth
Defense in depth is an approach in cybersecurity that applies multiple layers of security controls to protect valuable assets. In a traditional or monolithic IT environment, we can list quite a few: authentication, encryption, authorization, logging, intrusion detection, antivirus, a virtual private network (VPN), firewalls, and so on. You may find that these security controls also exist in the Kubernetes cluster (and they should).
We've discussed topics such as authentication, authorization, admission controllers, securing Kubernetes components, securing a configuration, hardening images, and Kubernetes workloads in the previous chapters. All these build up different security control layers to protect your Kubernetes cluster. In this chapter, we're going to discuss topics that build up additional security control layers, and these are most related to runtime defense in a Kubernetes cluster. These are the questions we're going to address in this chapter: Does your cluster expose any sensitive data? If an attack happens in the Kubernetes cluster, can you detect the attack? Can your Kubernetes cluster sustain the attack? How do you respond to the attack?
In this chapter, we will talk about Kubernetes auditing, then we will introduce the concept of high availability and talk about how we can apply high availability in the Kubernetes cluster. Next, we will introduce Vault, a handy secrets management product for the Kubernetes cluster. Then, we will talk about how to use Falco to detect anomalous activities in the Kubernetes cluster. Last but not least, we will introduce Sysdig Inspect and Checkpoint and Resource In Userspace (also known as CRIU) for forensics.
The following topics will be covered in this chapter:
- Introducing Kubernetes auditing
- Enabling high availability in a Kubernetes cluster
- Managing secrets with Vault
- Detecting anomalies with Falco
- Conducting forensics with Sysdig Inspect and CRIU
Introducing Kubernetes auditing
Kubernetes auditing was introduced in the 1.11 version. Kubernetes auditing records events such as creating a deployment, patching pods, deleting namespaces, and more in a chronological order. With auditing, a Kubernetes cluster administrator is able to answer questions such as the following:
- What happened? (A pod is created and what kind of pod it is)
- Who did it? (From user/admin)
- When did it happen? (The timestamp of the event)
- Where did it happen? (In which namespace is the pod created?)
From a security standpoint, auditing enables DevOps and the security team to do better anomaly detection and prevention by tracking events happening inside the Kubernetes cluster.
In a Kubernetes cluster, it is kube-apiserver that does the auditing. When a request (for example, create a namespace) is sent to kube-apiserver, the request may go through multiple stages. There will be an event generated per stage. The following are the known stages:
- RequestReceived: The event is generated as soon as the request is received by the audit handler without processing it.
- RequestStarted: The event is generated between the time that the response header is sent and the response body is sent, and only applies for long-running requests such as watch.
- RequestComplete: The event is generated when the response body is sent.
- Panic: The event is generated when panic occurs.
In this section, we will first introduce the Kubernetes audit policy, and then show you how to enable a Kubernetes audit and a couple of ways to persist audit records.
Kubernetes audit policy
As it is not realistic to record everything happening inside the Kubernetes cluster, an audit policy allows users to define rules about what kind of event should be recorded and how much detail of the event should be recorded. When an event is processed by kube-apiserver, it compares the list of rules in the audit policy in order. The first matching rules also dictate the audit level of the event. Let's take a look at what an audit policy looks like. Here is an example:
apiVersion: audit.k8s.io/v1 # This is required.
kind: Policy
# Skip generating audit events for all requests in RequestReceived stage. This can be either set at the policy level or rule level.
omitStages:
- "RequestReceived"
rules:
# Log pod changes at RequestResponse level
- level: RequestResponse
verbs: ["create", "update"]
namespace: ["ns1", "ns2", "ns3"]
resources:
- group: ""
# Only check access to resource "pods", not the sub-resource of pods which is consistent with the RBAC policy.
resources: ["pods"]
# Log "pods/log", "pods/status" at Metadata level
- level: Metadata
resources:
- group: ""
resources: ["pods/log", "pods/status"]
# Don't log authenticated requests to certain non-resource URL paths.
- level: None
userGroups: ["system:authenticated"]
nonResourceURLs: ["/api*", "/version"]
# Log configmap and secret changes in all other namespaces at the Metadata level.
- level: Metadata
resources:
- group: "" # core API group
resources: ["secrets", "configmaps"]
You can configure multiple audit rules in the audit policy. Each audit rule will be configured by the following fields:
- level: The audit level that defines the verbosity of the audit event.
- resources: The Kubernetes objects under audit. Resources can be specified by an Application Programming Interface (API) group and an object type.
- nonResourcesURL: A non-resource Uniform Resource Locator (URL) path that is not associated with any resources under audit.
- namespace: Decides which Kubernetes objects from which namespaces will be under audit. An empty string will be used to select non-namespaced objects, and an empty list implies every namespace.
- verb: Decides the specific operation of Kubernetes objects that will be under audit—for example, create, update, or delete.
- users: Decides the authenticated user the audit rule applies to
- userGroups: Decides the authenticated user group the audit rule applies to.
- omitStages: Skips generating events on the given stages. This can also be set at the policy level.
The audit policy allows you to configure a policy at a fine-grained level by specifying verb, namespace, resources, and more. It is the audit level of the rule that defines how much detail of the event should be recorded. There are four audit levels, detailed as follows:
- None: Do not log events that match the audit rule.
- Metadata: When an event matches the audit rule, log the metadata (such as user, timestamp, resource, verb, and more) of the request to kube-apiserver.
- Request: When an event matches the audit rule, log the metadata as well as the request body. This does not apply for the non-resource URL.
- RequestResponse: When an event matches the audit rule, log the metadata, request-and-response body. This does not apply for the non-resource request.
The request-level event is more verbose than the metadata level events, while the RequestResponse level event is more verbose than the request-level event. The high verbosity requires more input/output (I/O) throughputs and storage. It is quite necessary to understand the differences between the audit levels so that you can define audit rules properly, both for resource consumption and security. With an audit policy successfully configured, let's take a look at what audit events look like. The following is a metadata-level audit event:
{
"kind": "Event",
"apiVersion": "audit.k8s.io/v1",
"level": "Metadata",
"auditID": "05698e93-6ad7-4f4e-8ae9-046694bee469",
"stage": "ResponseComplete",
"requestURI": "/api/v1/namespaces/ns1/pods",
"verb": "create",
"user": {
"username": "admin",
"uid": "admin",
"groups": [
"system:masters",
"system:authenticated"
]
},
"sourceIPs": [
"98.207.36.92"
],
"userAgent": "kubectl/v1.17.4 (darwin/amd64) kubernetes/8d8aa39",
"objectRef": {
"resource": "pods",
"namespace": "ns1",
"name": "pod-1",
"apiVersion": "v1"
},
"responseStatus": {
"metadata": {},
"code": 201
},
"requestReceivedTimestamp": "2020-04-09T07:10:52.471720Z",
"stageTimestamp": "2020-04-09T07:10:52.485551Z",
"annotations": {
"authorization.k8s.io/decision": "allow",
"authorization.k8s.io/reason": ""
}
}
The preceding audit event shows the user, timestamp, the object being accessed, the authorization decision, and so on. A request-level audit event provides extra information within the requestObject field in the audit event. You will find out the specification of the workload in the requestObject field, as follows:
"requestObject": {
"kind": "Pod",
"apiVersion": "v1",
"metadata": {
"name": "pod-2",
"namespace": "ns2",
"creationTimestamp": null,
...
},
"spec": {
"containers": [
{
"name": "echo",
"image": "busybox",
"command": [
"sh",
"-c",
"echo 'this is echo' && sleep 1h"
],
...
"imagePullPolicy": "Always"
}
],
...
"securityContext": {},
},
The RequestResponse-level audit event is the most verbose. The responseObject instance in the event is almost the same as requestObject, with extra information such as resource version and creation timestamp, as shown in the following code block:
{
"responseObject": {
...
"selfLink": "/api/v1/namespaces/ns3/pods/pod-3",
"uid": "3fd18de1-7a31-11ea-9e8d-0a39f00d8287",
"resourceVersion": "217243",
"creationTimestamp": "2020-04-09T07:10:53Z",
"tolerations": [
{
"key": "node.kubernetes.io/not-ready",
"operator": "Exists",
"effect": "NoExecute",
"tolerationSeconds": 300
},
{
"key": "node.kubernetes.io/unreachable",
"operator": "Exists",
"effect": "NoExecute",
"tolerationSeconds": 300
}
],
...
},
}
Please do choose the audit level properly. More verbose logs provide deeper insight into the activities being carried out. However, it does cost more in storage and time to process the audit events. One thing worth mentioning is that if you set a request or a RequestResponse audit level on Kubernetes secret objects, the secret content will be recorded in the audit events. If you set the audit level to be more verbose than metadata for Kubernetes objects containing sensitive data, you should use a sensitive data redaction mechanism to avoid secrets being logged in the audit events.
The Kubernetes auditing functionality offers a lot of flexibility to audit Kubernetes objects by object kind, namespace, operations, user, and so on. As Kubernetes auditing is not enabled by default, next, let's look at how to enable Kubernetes auditing and store audit records.
Configuring the audit backend
In order to enable Kubernetes auditing, you need to pass the --audit-policy-file flag with your audit policy file when starting kube-apiserver. There are two types of audit backends that can be configured to use process audit events: a log backend and a webhook backend. Let's have a look at them.
Log backend
The log backend writes audit events to a file on the master node. The following flags are used to configure the log backend within kube-apiserver:
- --log-audit-path: Specify the log path on the master node. This is the flag to turn ON or OFF the log backend.
- --audit-log-maxage: Specify the maximum number of days to keep the audit records.
- --audit-log-maxbackup: Specify the maximum number of audit files to keep on the master node.
- --audit-log-maxsize: Specify the maximum size in megabytes of an audit log file before it gets rotated.
Let's take a look at the webhook backend.
Webhook backend
The webhook backend writes audit events to the remote webhook registered to kube-apiserver. To enable the webhook backend, you need to set the --audit-webhook-config-file flag with the webhook configuration file. This flag is also specified when starting kube-apiserver. The following is an example of a webhook configuration to register a webhook backend for the Falco service, which will be introduced later in more detail:
apiVersion: v1
kind: Config
clusters:
- name: falco
cluster:
server: http://$FALCO_SERVICE_CLUSTERIP:8765/k8s_audit
contexts:
- context:
cluster: falco
user: ""
name: default-context
current-context: default-context
preferences: {}
users: []
The URL specified in the server field (http://$FALCO_SERVICE_CLUSTERIP:8765/k8s_audit) is the remote endpoint that the audit events will be sent to. Since version 1.13 of Kubernetes, the webhook backend can be configured dynamically via the AuditSink object, which is still in the alpha stage.
In this section, we talked about Kubernetes auditing by introducing the audit policy and audit backends. In the next section, we will talk about high availability in the Kubernetes cluster.
Enabling high availability in a Kubernetes cluster
Availability refers to the ability of the user to access the service or system. The high availability of a system ensures an agreed level of uptime of the system. For example, if there is only one instance to serve the service and the instance is down, users can no longer access the service. A service with high availability is served by multiple instances. When one instance is down, the standby instance or backup instance can still provide the service. The following diagram describes services with and without high availability:

Figure 11.1 – Services with and without high availability
In a Kubernetes cluster, there will usually be more than one worker node. The high availability of the cluster is guaranteed as even if one worker node is down, there are some other worker nodes to host the workload. However, high availability is more than running multiple nodes in the cluster. In this section, we will look at high availability in Kubernetes clusters from three levels: workloads, Kubernetes components, and cloud infrastructure.
Enabling high availability of Kubernetes workloads
For Kubernetes workloads such as a deployment and a StatefulSet, you can specify the replicas field in the specification for how many replicated pods are running for the microservice, and controllers will ensure there will be x number of pods running on different worker nodes in the cluster, as specified in the replicas field. A DaemonSet is a special workload; the controller will ensure there will be one pod running on every node in the cluster, assuming your Kubernetes cluster has more than one node. So, specifying more than one replica in the deployment or the StatefulSet, or using a DaemonSet, will ensure the high availability of your workload. In order to ensure the high availability of the workload, the high availability of Kubernetes components needs to be ensured as well.
Enabling high availability of Kubernetes components
High availability also applies to the Kubernetes components. Let's review a few critical Kubernetes components, as follows:
- kube-apiserver: The Kubernetes API server (kube-apiserver) is a control plane component that validates and configures data for objects such as pods, services, and controllers. It interacts with the objects using REepresentational State Transfer (REST) requests.
- etcd: etcd is a high-availability key-value store used to store data such as configuration, state, and metadata. Its watch functionality provides Kubernetes with the ability to listen for updates to a configuration and make changes accordingly.
- kube-scheduler: kube-scheduler is a default scheduler for Kubernetes. It watches for newly created pods and assigns the pods to the nodes.
- kube-controller-manager: The Kubernetes controller manager is a combination of the core controllers that watch for state updates and make changes to the cluster accordingly.
If the kube-apiserver is down, then basically your cluster is down, as users or other Kubernetes components rely on communicating to the kube-apiserver to perform their tasks. If etcd is down, no states of the cluster and objects are available to be consumed. kube-scheduler and kube-controller-manager are also important to make sure the workloads are running properly in the cluster. All these components are running on the master node, to ensure the high availability of the components. One straightforward way is to bring up multiple master nodes for your Kubernetes cluster, either via kops or kubeadm. You will find something like this:
$ kubectl get pods -n kube-system
...
etcd-manager-events-ip-172-20-109-109.ec2.internal 1/1 Running 0 4h15m
etcd-manager-events-ip-172-20-43-65.ec2.internal 1/1 Running 0 4h16m
etcd-manager-events-ip-172-20-67-151.ec2.internal 1/1 Running 0 4h16m
etcd-manager-main-ip-172-20-109-109.ec2.internal 1/1 Running 0 4h15m
etcd-manager-main-ip-172-20-43-65.ec2.internal 1/1 Running 0 4h15m
etcd-manager-main-ip-172-20-67-151.ec2.internal 1/1 Running 0 4h16m
kube-apiserver-ip-172-20-109-109.ec2.internal 1/1 Running 3 4h15m
kube-apiserver-ip-172-20-43-65.ec2.internal 1/1 Running 4 4h16m
kube-apiserver-ip-172-20-67-151.ec2.internal 1/1 Running 4 4h15m
kube-controller-manager-ip-172-20-109-109.ec2.internal 1/1 Running 0 4h15m
kube-controller-manager-ip-172-20-43-65.ec2.internal 1/1 Running 0 4h16m
kube-controller-manager-ip-172-20-67-151.ec2.internal 1/1 Running 0 4h15m
kube-scheduler-ip-172-20-109-109.ec2.internal 1/1 Running 0 4h15m
kube-scheduler-ip-172-20-43-65.ec2.internal 1/1 Running 0 4h15m
kube-scheduler-ip-172-20-67-151.ec2.internal 1/1 Running 0 4h16m
Now you have multiple kube-apiserver pods, etcd pods, kube-controller-manager pods, and kube-scheduler pods running in the kube-system namespace, and they're running on different master nodes. There are some other components such as kubelet and kube-proxy that are running on every node, so, their availability is guaranteed by the availability of the nodes, and kube-dns are spun up with more than one pod by default, so their high availability is ensured. No matter if your Kubernetes cluster is running on the public cloud or in a private data center—the infrastructure is the pillar to support the availability of the Kubernetes cluster. Next, we will talk about the high availability of a cloud infrastructure and use cloud providers as an example.
Enabling high availability of a cloud infrastructure
Cloud providers offers cloud services all over the world through multiple data centers located in different areas. Cloud users can choose in which region and zone (the actual data center) to host their service. Regions and zones provide isolation from most types of physical infrastructure and infrastructure software service failures. Note that the availability of a cloud infrastructure also impacts the services running on your Kubernetes cluster if the cluster is hosted in the cloud. You should leverage the high availability of the cloud and ultimately ensure the high availability of the service running on the Kubernetes cluster. The following code block provides an example of specifying zones using kops to leverage the high availability of a cloud infrastructure:
export NODE_SIZE=${NODE_SIZE:-t2.large}
export MASTER_SIZE=${MASTER_SIZE:-t2.medium}
export ZONES=${ZONES:-"us-east-1a,us-east-1b,us-east-1c"}
export KOPS_STATE_STORE="s3://my-k8s-state-store2/"
kops create cluster k8s-clusters.k8s-demo-zone.com
--cloud aws
--node-count 3
--zones $ZONES
--node-size $NODE_SIZE
--master-size $MASTER_SIZE
--master-zones $ZONES
--networking calico
--kubernetes-version 1.14.3
--yes
The nodes of the Kubernetes clusters look like this:
$ kops validate cluster
...
INSTANCE GROUPS
NAME ROLE MACHINETYPE MIN MAX SUBNETS
master-us-east-1a Master t2.medium 1 1 us-east-1a
master-us-east-1b Master t2.medium 1 1 us-east-1b
master-us-east-1c Master t2.medium 1 1 us-east-1c
nodes Node t2.large 3 3 us-east-1a,us-east-1b,us-east-1c
The preceding code block shows three master nodes running on the us-east-1a, us-east-1b, and us-east-1c availability zones respectively. So, as worker nodes, even if one of the data centers is down or under maintenance, both master nodes and worker nodes can still function in other data centers.
In this section, we've talked about the high availability of Kubernetes workloads, Kubernetes components, and a cloud infrastructure. Let's use the following diagram to recap on the high availability of a Kubernetes cluster:

Figure 11.2 – High availability of Kubernetes cluster in the cloud
Now, let's move to the next topic about managing secrets in the Kubernetes cluster.
Managing secrets with Vault
Secrets management is a big topic, and many open source and proprietary solutions have been developed to help solve the secrets management problem on different platforms. So, in Kubernetes, its built-in Secret object is used to store secret data, and the actual data is stored in etcd along with other Kubernetes objects. By default, the secret data is stored in plaintext (encoded format) in etcd. etcd can be configured to encrypt secrets at rest. Similarly, if etcd is not configured to encrypt communication using Transport Layer Security (TLS), secret data is transferred in plaintext too. Unless the security requirement is very low, it is recommended to use a third-party solution to manage secrets in a Kubernetes cluster.
In this section, we're going to introduce Vault, a Cloud Native Computing Foundation (CNCF) secrets management project. Vault supports secure storage of secrets, dynamic secrets' generation, data encryption, key revocation, and so on. In this section, we will focus on the use case of how to store and provision secrets for applications in the Kubernetes cluster using Vault. Now, let's see how to set up Vault for the Kubernetes cluster.
Setting up Vault
You can deploy Vault in the Kubernetes cluster using helm, as follows:
helm install vault --set='server.dev.enabled=true' https://github.com/hashicorp/vault-helm/archive/v0.4.0.tar.gz
Note that server.dev.enabled=true is set. This is good for a development environment but is not recommended to be set in a production environment. You should see two pods are running, as follows:
$ kubectl get pods
NAME READY STATUS RESTARTS AGE
vault-0 1/1 Running 0 80s
vault-agent-injector-7fd6b9588b-fgsnj 1/1 Running 0 80s
The vault-0 pod is the one to manage and store secrets, while the vault-agent-injector-7fd6b9588b-fgsnj pod is responsible for injecting secrets into pods with special vault annotation, which we will show in more detail in the Provisioning and rotating secrets section. Next, let's create an example secret for a postgres database connection, like this:
vault kv put secret/postgres username=alice password=pass
Note that the preceding command needs to be executed inside the vault-0 pod. Since you want to restrict only the relevant application in the Kubernetes cluster to access the secret, you may want to define a policy to achieve that, as follows:
cat <<EOF > /home/vault/app-policy.hcl
path "secret*" {
capabilities = ["read"]
}
EOF
vault policy write app /home/vault/app-policy.hcl
Now, you have a policy defining a privilege to read the secret under the secret path, such as secret/postgres. Next, you want to associate the policy with allowed entities, such as a service account in Kubernetes. This can be done by executing the following commands:
vault auth enable kubernetes
vault write auth/kubernetes/config
token_reviewer_jwt="$(cat /var/run/secrets/kubernetes.io/serviceaccount/token)"
kubernetes_host=https://${KUBERNETES_PORT_443_TCP_ADDR}:443
kubernetes_ca_cert=@/var/run/secrets/kubernetes.io/serviceaccount/ca.crt
vault write auth/kubernetes/role/myapp
bound_service_account_names=app
bound_service_account_namespaces=demo
policies=app
ttl=24h
Vault can leverage naive authentication from Kubernetes and then bind the secret access policy to the service account. Now, the service account app in the namespace demo can access the postgres secret. Now, let's deploy a demo application in the vault-app.yaml file, as follows:
apiVersion: apps/v1
kind: Deployment
metadata:
name: app
labels:
app: vault-agent-demo
spec:
selector:
matchLabels:
app: vault-agent-demo
replicas: 1
template:
metadata:
annotations:
labels:
app: vault-agent-demo
spec:
serviceAccountName: app
containers:
- name: app
image: jweissig/app:0.0.1
---
apiVersion: v1
kind: ServiceAccount
metadata:
name: app
labels:
app: vault-agent-demo
Note that in the preceding .yaml file, there is no annotation added yet, so the secret is not injected, nor is the sidecar container added when the application is created. The code can be seen in the following snippet:
$ kubectl get pods
NAME READY STATUS RESTARTS AGE
app-668b8bcdb9-js9mm 1/1 Running 0 3m23s
Next, we will show how secret injection works.
Provisioning and rotating secrets
The reason we don't show secret injection when the application is deployed is that we want to show you the detailed difference before and after injection to the demo application pod. Now, let's patch the deployment with the following Vault annotations:
$ cat patch-template-annotation.yaml
spec:
template:
metadata:
annotations:
vault.hashicorp.com/agent-inject: "true"
vault.hashicorp.com/agent-inject-status: "update"
vault.hashicorp.com/agent-inject-secret-postgres: "secret/postgres"
vault.hashicorp.com/agent-inject-template-postgres: |
{{- with secret "secret/postgres" -}}
postgresql://{{ .Data.data.username }}:{{ .Data.data.password }}@postgres:5432/wizard
{{- end }}
vault.hashicorp.com/role: "myapp"
The preceding annotation dictates which secret will be injected, and in what format and using which role. Once we update the demo application deployment, we will find the secret has been injected, as follows:
$ kubectl get pods
NAME READY STATUS RESTARTS AGE
app-68d47bb844-2hlrb 2/2 Running 0 13s
$ kubectl -n demo exec -it app-68d47bb844-2hlrb -c app -- cat /vault/secrets/postgres
postgresql://alice:pass@postgres:5432/wizard
And let's look at the specification of the pod (not the patched deployment)—you will find the following (marked in bold) were added, compared to the specification of the patched deployment:
containers:
- image: jweissig/app:0.0.1
...
volumeMounts:
- mountPath: /vault/secrets
name: vault-secrets
- args:
- echo ${VAULT_CONFIG?} | base64 -d > /tmp/config.json && vault agent -config=/tmp/config.json
command:
- /bin/sh
- -ec
image: vault:1.3.2
name: vault-agent
volumeMounts:
- mountPath: /vault/secrets
name: vault-secrets
initContainers:
- args:
- echo ${VAULT_CONFIG?} | base64 -d > /tmp/config.json && vault agent -config=/tmp/config.json
command:
- /bin/sh
- -ec
image: vault:1.3.2
name: vault-agent-init
volumeMounts:
- mountPath: /vault/secrets
name: vault-secrets
volumes:
- emptyDir:
medium: Memory
name: vault-secrets
A few things worth mentioning from the preceding changes listed: one init container named vault-agent-init and one sidecar container named vault-agent have been injected, as well as an emptyDir type volume named vault-secrets. That's why you saw two containers are running in the demo application pod after the patch. Also, the vault-secrets volume is mounted in the init container, the sidecar container, and the app container with the /vault/secrets/ directory. The secret is stored in the vault-secrets volume. The pod specification modification is done by the vault-agent-injector pod through a predefined mutating webhook configuration (installed via helm), as follows:
apiVersion: admissionregistration.k8s.io/v1beta1
kind: MutatingWebhookConfiguration
metadata:
...
name: vault-agent-injector-cfg
webhooks:
- admissionReviewVersions:
- v1beta1
clientConfig:
caBundle: <CA_BUNDLE>
service:
name: vault-agent-injector-svc
namespace: demo
path: /mutate
failurePolicy: Ignore
name: vault.hashicorp.com
namespaceSelector: {}
rules:
- apiGroups:
- ""
apiVersions:
- v1
operations:
- CREATE
- UPDATE
resources:
- pods
scope: '*'
The mutating webhook configuration registered with kube-apiserver basically tells kube-apiserver to redirect any pods, create or update the request to the vault-agent-injector-svc service in the demo namespace. Behind the service is the vault-agent-injector pod. Then, the vault-agent-injector pod will look up the relevant annotations and inject the init container and the sidecar container, as well as the volume that stores the secret, to the specification of the pod on request. Why do we need one init container and one sidecar container? The init container is to prepopulate our secret, and the sidecar container is to keep that secret data in sync throughout our application's life cycle.
Now, let's update the secret by running the following code and see what happens:
vault kv put secret/postgres username=alice password=changeme
Now, the password has been updated to changeme from pass in the vault pod. And, on the demo application side, we can see from the following code block that it is updated as well, after waiting a few seconds:
$ kubectl -n demo exec -it app-68d47bb844-2hlrb -c app -- cat /vault/secrets/postgres
postgresql://alice:changeme@postgres:5432/wizard
Vault is a powerful secrets management solution and a lot of its features cannot be covered in a single section. I would encourage you to read the documentation and try it out to understand Vault better. Next, let's talk about runtime threat detection in Kubernetes with Falco.
Detecting anomalies with Falco
Falco is a CNCF open source project that detects anomalous behavior or runtime threats in cloud-native environments, such as a Kubernetes cluster. It is a rule-based runtime detection engine with about 100 out-of-the-box detection rules. In this section, we will first take an overview of Falco, and then we will show you how to write Falco rules so that you can build your own Falco rules to protect your Kubernetes cluster.
An overview of Falco
Falco is widely used to detect anomalous behavior in cloud-native environments, especially in the Kubernetes cluster. So, what is anomaly detection? Basically, it uses behavioral signals to detect security abnormalities, such as leaked credentials or unusual activity, and the behavioral signals can be derived from your knowledge of the entities in terms of what the normal behavior is.
Challenges faced
To identify what normal behaviors are in the Kubernetes cluster is not easy. From a running application's perspective, we may group them into three categories, as follows:
- Kubernetes components: kube-apiserver, kube-proxy, kubelet, the Container Runtime Interface (CRI) plugin, the Container Networking Interface (CNI) plugin, and so on
- Self-hosted applications: Java, Node.js, Golang, Python, and so on
- Vendor services: Cassandra, Redis, MySQL, NGINX, Tomcat, and so on
Or, from a system's perspective, we have the following types of activities:
- File activities such as open, read, and write
- Process activities such as execve and clone system calls
- Network activities such as accept, connect, and send
Or, from a Kubernetes object's perspective: pod, secret, deployment, namespace, serviceaccount, configmap, and so on
In order to cover all these activities or behaviors happening in the Kubernetes cluster, we will need rich sources of information. Next, let's talk about the event sources that Falco relies on to do anomalous detection, and how the sources cover the preceding activities and behaviors.
Event sources for anomaly detection
Falco relies on two event sources to do anomalous detection. One is system calls and the other is the Kubernetes audit events. For system call events, Falco uses a kernel module to tap into the stream of system calls on a machine, and then passes those system calls to a user space (ebpf is recently supported as well). Within the user space, Falco also enriches the raw system call events with more context such as the process name, container ID, container name, image name, and so on. For Kubernetes audit events, users need to enable the Kubernetes audit policy and register the Kubernetes audit webhook backend with the Falco service endpoint. Then, the Falco engine checks any of the system call events or Kubernetes audit events matching any Falco rules loaded in the engine.
It's also important to talk about the rationale for using system calls and Kubernetes audit events as event sources to do anomalous detection. System calls are a programmatic way for applications to interact with the operating system in order to access resources such as files, devices, the network, and so on. Considering containers are a bunch of processes with their own dedicated namespaces and that they share the same operating system on the node, a system call is the one unified event source that can be used to monitor activities from containers. It doesn't matter what programming language the application is written in; ultimately, all the functions will be translated into system calls to interact with the operating system. Take a look at the following diagram:
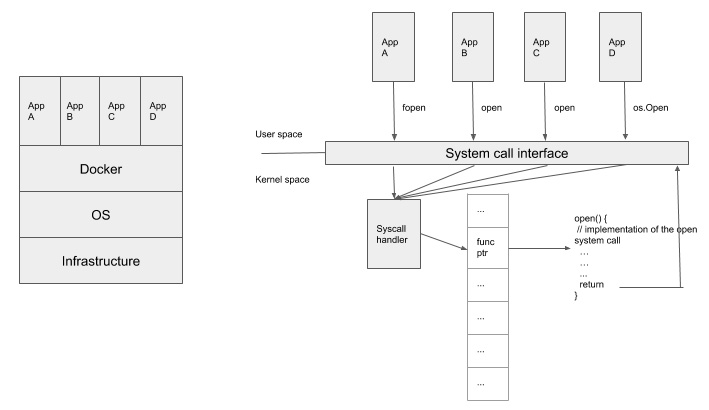
Figure 11.3 – Containers and system calls
In the preceding diagram, there are four containers running different applications. These applications may be written in different programming languages, and all of them call a function to open a file with a different function name (for example, fopen, open, and os.Open). However, from the operating system's perspective, all these applications call the same system call, open, but maybe with different parameters. Falco is able to retrieve events from system calls so that it doesn't matter what kind of applications they are or what kind of programming language is in use.
On the other hand, with the help of Kubernetes audit events, Falco has full visibility into a Kubernetes object's life cycle. This is also important for anomalous detection. For example, it may be abnormal that there is a pod with a busybox image launched as a privileged pod in a production environment.
Overall, the two event sources—system calls and Kubernetes audit events—are sufficient to cover all the meaningful activities happening in the Kubernetes cluster. Now, with an understanding of Falco event sources, let's wrap up our overview on Falco with a high-level architecture diagram.
High-level architecture
Falco is mainly composed of a few components, as follows:
- Falco rules: Rules that are defined to detect whether an event is an anomaly.
- Falco engine: Evaluate an incoming event with Falco rules and throw an output if an event matches any of the rules.
- Kernel module/Sysdig libraries: Tag system call events and enrich them before sending to the Falco engine for evaluation.
- Web server: Listen on Kubernetes audit events and pass on to the Falco engine for evaluation.
The following diagram shows Falco's internal architecture:
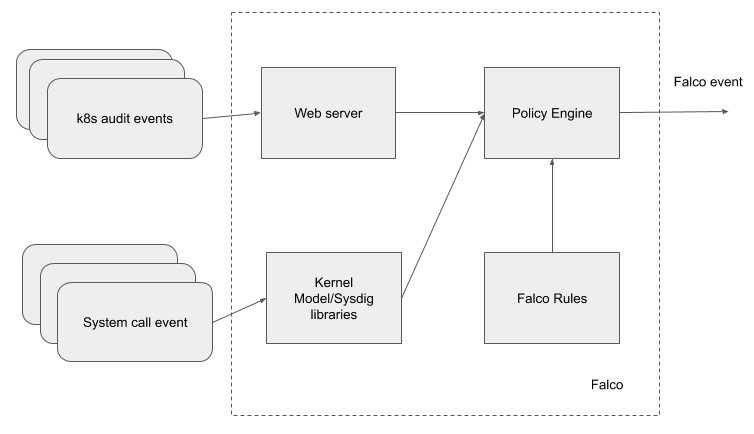
Figure 11.4 – Falco's internal architecture
Now, we have wrapped up our overview of Falco. Next, let's try to create some Falco rules and detect any anomalous behavior.
Creating Falco rules to detect anomalies
Before we dive into Falco rules, make sure you have Falco installed by running the following command:
helm install --name falco stable/falco
The Falco DaemonSet should be running in your Kubernetes cluster, as illustrated in the following code block:
$ kubectl get pods
NAME READY STATUS RESTARTS AGE
falco-9h8tg 1/1 Running 10 62m
falco-cnt47 1/1 Running 5 3m45s
falco-mz6jg 1/1 Running 0 6s
falco-t4cpw 1/1 Running 0 10s
To enable the Kubernetes audit and register Falco as the webhook backend, please follow the instructions in the Falco repository (https://github.com/falcosecurity/evolution/tree/master/examples/k8s_audit_config).
There are three types of elements in the Falco rules, as follows:
- Rule: A condition under which an alert will be triggered. A rule has the following attributes: rule name, description, condition, priority, source, tags, and output. When an event matches any rule's condition, an alert is generated based on the output definition of the rule.
- Macro: A rule condition snippet that can be reused by other rules or macros.
- List: A collection of items that can be used by macros and rules.
To facilitate Falco users in building their own rules, Falco provides a handful of default lists and macros.
Creating the system call rule
Falco system call rules evaluate system call events—more precisely, the enriched system calls. System call event fields are provided by the kernel module and are identical to the Sysdig (an open source tool built by the Sysdig company) filter fields. The policy engine uses Sysdig's filter to extract information such as the process name, container image, and file path from system call events and evaluate them with Falco rules.
The following are the most common Sysdig filter fields that can be used to build Falco rules:
- proc.name: Process name
- fd.name: File name that is written to or read from
- container.id: Container ID
- container.image.repository: Container image name without tag
- fd.sip and fd.sport: Server Internet Protocol (IP) address and server port
- fd.cip and fd.cport: Client IP and client port
- evt.type: System call event (open, connect, accept, execve, and so on)
Let's try to build a simple Falco rule. Assume that you have a nginx pod that serves static files from the /usr/share/nginx/html/ directory only. So, you can create a Falco rule to detect any anomalous file read activities as follows:
- rule: Anomalous read in nginx pod
desc: Detect any anomalous file read activities in Nginx pod.
condition: (open_read and container and container.image.repository="kaizheh/insecure-nginx" and fd.directory != "/usr/share/nginx/html")
output: Anomalous file read activity in Nginx pod (user=%user.name process=%proc.name file=%fd.name container_id=%container.id image=%container.image.repository)
priority: WARNING
The preceding rule used two default macros: open_read and container. The open_read macro checks if the system call event is open in read mode only, while the container macro checks if the system call event happened inside a container. Then, the rule applies to containers running the kaizheh/insecure-nginx image only, and the fd.directory filter retrieves the file directory information from the system call event. In this rule, it checks if there is any file read outside of the /usr/share/nginx/html/ directory. So, what if there is misconfiguration of nginx that leads to file path traversal (reading files under arbitrary directories)? An example of this is shown in the following code block:
# curl insecure-nginx.insecure-nginx.svc.cluster.local/files../etc/passwd
root:x:0:0:root:/root:/bin/bash
daemon:x:1:1:daemon:/usr/sbin:/usr/sbin/nologin
bin:x:2:2:bin:/bin:/usr/sbin/nologin
sys:x:3:3:sys:/dev:/usr/sbin/nologin
sync:x:4:65534:sync:/bin:/bin/sync
games:x:5:60:games:/usr/games:/usr/sbin/nologin
man:x:6:12:man:/var/cache/man:/usr/sbin/nologin
lp:x:7:7:lp:/var/spool/lpd:/usr/sbin/nologin
mail:x:8:8:mail:/var/mail:/usr/sbin/nologin
news:x:9:9:news:/var/spool/news:/usr/sbin/nologin
uucp:x:10:10:uucp:/var/spool/uucp:/usr/sbin/nologin
proxy:x:13:13:proxy:/bin:/usr/sbin/nologin
www-data:x:33:33:www-data:/var/www:/usr/sbin/nologin
backup:x:34:34:backup:/var/backups:/usr/sbin/nologin
list:x:38:38:Mailing List Manager:/var/list:/usr/sbin/nologin
irc:x:39:39:ircd:/var/run/ircd:/usr/sbin/nologin
gnats:x:41:41:Gnats Bug-Reporting System (admin):/var/lib/gnats:/usr/sbin/nologin
nobody:x:65534:65534:nobody:/nonexistent:/usr/sbin/nologin
_apt:x:100:65534::/nonexistent:/bin/false
At the same time, Falco detects file access beyond the designated directory, with the following output:
08:22:19.484698397: Warning Anomalous file read activity in Nginx pod (user=<NA> process=nginx file=/etc/passwd container_id=439e2e739868 image=kaizheh/insecure-nginx) k8s.ns=insecure-nginx k8s.pod=insecure-nginx-7c99fdf44b-gffp4 container=439e2e739868 k8s.ns=insecure-nginx k8s.pod=insecure-nginx-7c99fdf44b-gffp4 container=439e2e739868
Next, let's look at how to use K8s audit rules.
Creating K8s audit rules
K8s audit rules evaluate Kubernetes audit events. We've already shown what a Kubernetes audit event record looks like, earlier in this chapter. Similar to Sysdig filters, there are two ways to retrieve the information out of a Kubernetes audit event. One is to use the JavaScript Object Notation (JSON) pointer; the other is to use Falco built-in filters. The following are a few commonly used Falco built-in filters to retrieve the information of Kubernetes audit events:
- ka.verb: The verb field of the Kubernetes audit event. jevt.value[/verb] is its corresponding JSON pointer.
- ka.target.resource: The resource field of the Kubernetes audit event. jevt.value[/objectRef/resource] is its corresponding JSON pointer.
- ka.user.name: The username field of the Kubernetes audit event. jevt.value[/user/username] is its corresponding JSON pointer.
- ka.uri: The requestURI field of the Kubernetes audit event. jet.value[/requestURI] is its corresponding JSON pointer.
Let's try to build a simple K8s audit rule. Assume that you don't want to deploy images in the kube-system namespaces except a few trusted images for services such as kube-apiserver, etcd-manager, and more. So, you can create a Falco rule, as follows:
- list: trusted_images
items: [calico/node, kopeio/etcd-manager, k8s.gcr.io/kube-apiserver, k8s.gcr.io/kube-controller-manager, k8s.gcr.io/kube-proxy, k8s.gcr.io/kube-scheduler]
- rule: Untrusted Image Deployed in kube-system Namespace
desc: >
Detect an untrusted image deployed in kube-system namespace
condition: >
kevt and pod
and kcreate
and ka.target.namespace=kube-system
and not ka.req.pod.containers.image.repository in (trusted_images)
output: Untrusted image deployed in kube-system namespace (user=%ka.user.name image=%ka.req.pod.containers.image.repository resource=%ka.target.name)
priority: WARNING
source: k8s_audit
tags: [k8s]
First, we define a list of trusted images that will be allowed to be deployed in the kube-system namespace. In the rule, we use two default macros: pod and kcreate. The pod macro checks if the target resource is a pod, while kcreate checks if the verb is create. We also check if the target namespace is kube-system and that the deploying image is not in the trusted_images list. The k8s_audit value from the source field of the rule indicates this rule evaluates the Kubernetes audit events. Then, if we try to deploy a busybox image pod in the kube-system namespace, we will see the following alert from Falco:
21:47:15.063915008: Warning Untrusted image deployed in kube-system namespace (user=admin image=busybox resource=pod-1)
Note that in order for this rule to work, the audit level for a pod's creation needs to be at least at the Request level, with which the audit events include the pod's specification information, such as the image.
In this section, we introduced Falco and showed you how to create Falco rules from both event sources: system calls and Kubernetes audit events. Both rules are used to detect anomalous activities based on the known benign activities of the workload or cluster. Next, let's talk about how to do forensics in the Kubernetes cluster.
Conducting forensics with Sysdig Inspect and CRIU
Forensics in cybersecurity means collecting, processing, and analyzing information in support of vulnerability mitigation and/or fraud, counterintelligence, or law enforcement investigations. The more data you can preserve and the faster the analysis you can conduct on the collected data, the quicker you will trace down an attack and respond to the incident better. In this section, we will show you how to use the CRIU and Sysdig open source tools to collect data, and then introduce Sysdig Inspect, an open source tool for analyzing data collected by Sysdig.
Using CRIU to collect data
CRIU is the abbreviation of Checkpoint and Restore In Userspace. It is a tool that can freeze a running container and capture the container's state on disk. Later on, the container's and application's data saved on the disk can be restored to the state it was at the time of the freeze. It is useful for container snapshots, migration, and remote debugging. From a security standpoint, it is especially useful to capture malicious activities in action in the container (so that you may kill the container right after the checkpoint) and then restore the state in a sandboxed environment for further analysis.
CRIU works as a Docker plugin and is still in experimental mode, and there is a known issue that CRIU is not working properly in the most recent few versions (https://github.com/moby/moby/issues/37344). For demo purposes, I have used an older Docker version (Docker CE 17.03) and will show how to use CRIU to checkpoint a running container and restore the state back as a new container.
To enable CRIU, you will need to enable the experimental mode in the Docker daemon, as follows:
echo "{"experimental":true}" >> /etc/docker/daemon.json
And then, after restarting the Docker daemon, you should be able to execute the docker checkpoint command successfully, like this:
# docker checkpoint
Usage: docker checkpoint COMMAND
Manage checkpoints
Options:
--help Print usage
Commands:
create Create a checkpoint from a running container
ls List checkpoints for a container
rm Remove a checkpoint
Then, follow the instructions to install CRIU (https://criu.org/Installation). Next, let's see a simple example to show how powerful CRIU is. I have a simple busybox container running to increase the counter by 1 every second, as illustrated in the following code snippet:
# docker run -d --name looper --security-opt seccomp:unconfined busybox /bin/sh -c 'i=0; while true; do echo $i; i=$(expr $i + 1); sleep 1; done'
91d68fafec8fcf11e7699539dec0b037220b1fcc856fb7050c58ab90ae8cbd13
After sleeping for a few seconds, I then see the output of the counter increasing, as follows:
# sleep 5
# docker logs looper
0
1
2
3
4
5
Next, I would like to checkpoint the container and store the state to the local filesystem, like this:
# docker checkpoint create --checkpoint-dir=/tmp looper checkpoint
checkpoint
Now, the checkpoint state has been saved under the /tmp directory. Note that the container looper will be killed after the checkpoint unless you specify a --leave-running flag when creating the checkpoint.
Then, create a mirror container without running it, like this:
# docker create --name looper-clone --security-opt seccomp:unconfined busybox /bin/sh -c 'i=0; while true; do echo $i; i=$(expr $i + 1); sleep 1; done'
49b9ade200e7da6bbb07057da02570347ad6fefbfc1499652ed286b874b59f2b
Now, we can start the new looper-clone container with the stored state. Let's wait another few seconds and see what happens. The result can be seen in the following code snippet:
# docker start --checkpoint-dir=/tmp --checkpoint=checkpoint looper-clone
# sleep 5
# docker logs looper-clone
6
7
8
9
10
The new looper-clone container starts counting at 6, which means the state (the counter was 5) was successfully restored and used.
CRIU is very useful for container forensics, especially when there are some suspicious activities happening in a container. You can checkpoint the container (assuming you have multiple replicas running within the cluster), let CRIU kill the suspicious container, and then restore the suspicious state of the container in a sandboxed environment for further analysis. Next, let's talk about another way to capture data for forensics.
Using Sysdig and Sysdig Inspect
Sysdig is an open source tool for Linux system exploration and troubleshooting with support for containers. Sysdig can also be used to create trace files for system activity through instrumenting into the Linux kernel and capturing system calls and other operating system events. The capture capability makes it an awesome forensics tool for a containerized environment. To support capture system calls in the Kubernetes cluster, Sysdig offers a kubectl plugin, kubectl-capture, which enables you to capture system calls of the target pods as simply as with some other kubectl commands. After the capture is finished, Sysdig Inspect, a powerful open source tool, can be used to do troubleshooting and security investigation.
Let's continue to use insecure-nginx as an example, since we've got a Falco alert, as illustrated in the following code snippet:
08:22:19.484698397: Warning Anomalous file read activity in Nginx pod (user=<NA> process=nginx file=/etc/passwd container_id=439e2e739868 image=kaizheh/insecure-nginx) k8s.ns=insecure-nginx k8s.pod=insecure-nginx-7c99fdf44b-gffp4 container=439e2e739868 k8s.ns=insecure-nginx k8s.pod=insecure-nginx-7c99fdf44b-gffp4 container=439e2e739868
By the time the alert was triggered, it is still possible the nginx pod was undergoing an attack. There are a few things you can do to respond. Starting a capture and then analyzing more context out of the Falco alert is one of them.
To trigger a capture, download kubectl-capture from https://github.com/sysdiglabs/kubectl-capture and place it with the other kubectl plugins, like this:
$ kubectl plugin list
The following compatible plugins are available:
/Users/kaizhehuang/.krew/bin/kubectl-advise_psp
/Users/kaizhehuang/.krew/bin/kubectl-capture
/Users/kaizhehuang/.krew/bin/kubectl-ctx
/Users/kaizhehuang/.krew/bin/kubectl-krew
/Users/kaizhehuang/.krew/bin/kubectl-ns
/Users/kaizhehuang/.krew/bin/kubectl-sniff
Then, start a capture on the nginx pod, like this:
$ kubectl capture insecure-nginx-7c99fdf44b-4fl5s -ns insecure-nginx
Sysdig is starting to capture system calls:
Node: ip-172-20-42-49.ec2.internal
Pod: insecure-nginx-7c99fdf44b-4fl5s
Duration: 120 seconds
Parameters for Sysdig: -S -M 120 -pk -z -w /capture-insecure-nginx-7c99fdf44b-4fl5s-1587337260.scap.gz
The capture has been downloaded to your hard disk at:
/Users/kaizhehuang/demo/chapter11/sysdig/capture-insecure-nginx-7c99fdf44b-4fl5s-1587337260.scap.gz
Under the hood, kubectl-capture starts a new pod to do the capture on the host where the suspected victim pod is running, with a 120-second capture duration, so that we can see everything that is happening right now and in the next 120 seconds in that host. Once the capture is done, the zipped capture file will be created in the current working directory. You can bring in Sysdig Inspect as a Docker container to start a security investigation, like this:
$ docker run -d -v /Users/kaizhehuang/demo/chapter11/sysdig:/captures -p3000:3000 sysdig/sysdig-inspect:latest
17533f98a947668814ac6189908ff003475b10f340d8f3239cd3627fa9747769
Now, log in to http://localhost:3000, and you should see the login user interface (UI). Remember to unzip the scap file so that you should be able to see the overview page of the capture file, as follows:
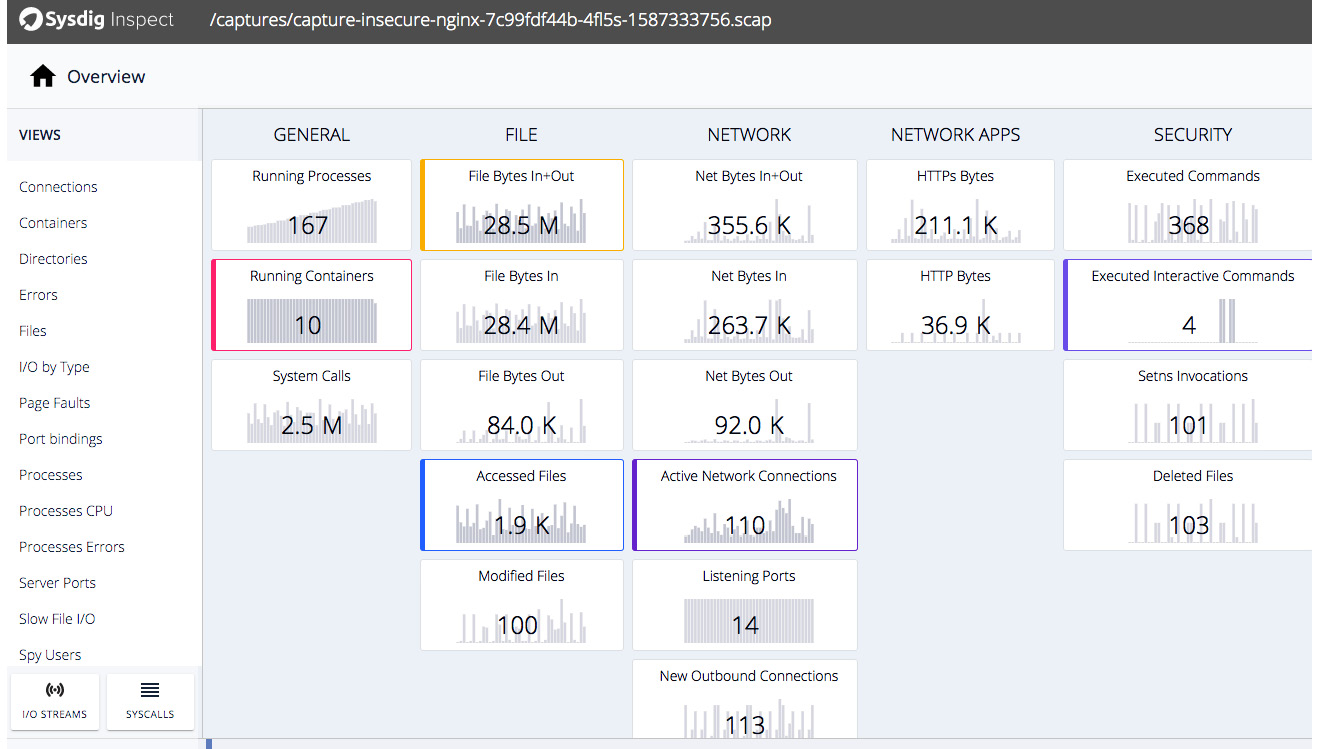
Figure 11.5 – Sysdig Inspect overview
Sysdig Inspect provides a full-blown insight into the activities happening inside the containers from the following angles:
- Executed commands
- File access
- Network connections
- System calls
Let's do a little more digging than just the Falco alert. From the alert, we may suspect this is a file path traversal issue as it is the nginx process accessing the /etc/passwd file, and we know that this pod serves static files only so that the nginx process should never access any files outside of the /usr/share/nginx/html/ directory. Now, let's take a look at the following screenshot to see what the network requests sent to nginx pod were:
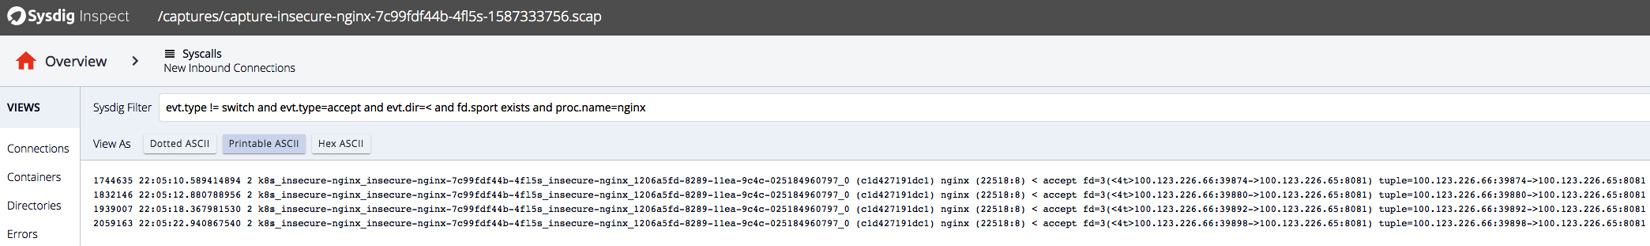
Figure 11.6 – Sysdig Inspect investigating network connections to nginx
After looking into the connections, we see that the requests came from a single IP, 100.123.226.66, which looks like a pod IP. Could it be from the same cluster? Click the Containers view on the left panel and specify fd.cip=100.123.226.66 in the filter. Then, you will find out it is from the anchore-cli container, as shown in the following screenshot:
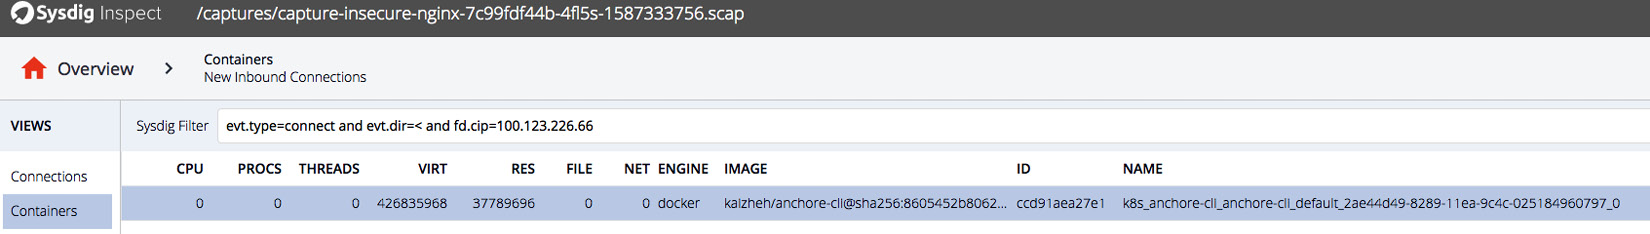
Figure 11.7 – Sysdig Inspect investigating a container sending a request to nginx
The anchore-cli pod actually happens to run on the same node as the nginx pod, as shown in the following code block:
$ kubectl get pods -o wide
NAME READY STATUS RESTARTS AGE IP NODE NOMINATED NODE READINESS GATES
anchore-cli 1/1 Running 1 77m 100.123.226.66 ip-172-20-42-49.ec2.internal <none> <none>
$ kubectl get pods -n insecure-nginx -o wide
NAME READY STATUS RESTARTS AGE IP NODE NOMINATED NODE READINESS GATES
insecure-nginx-7c99fdf44b-4fl5s 1/1 Running 0 78m 100.123.226.65 ip-172-20-42-49.ec2.internal <none> <none>
Now we know that there might be some file path traversal attack launched from the anchore-cli pod, let's look at what this is (just double-click on the entry in the preceding Sysdig Inspect page), as follows:

Figure 11.8 – Sysdig Inspect investigating path traversal attack commands
We found that there is list of file path traversal commands executed in the anchore-cli pod, detailed as follows:
- curl 100.71.138.95/files../etc/
- curl 100.71.138.95/files../
- curl 100.71.138.95/files../etc/passwd
- curl 100.71.138.95/files../etc/shadow
We're now able to get a step closer to the attacker, and the next step is to try to investigate more into how the attacker landed in the anchore-cli pod.
Both CRIU and Sysdig are powerful tools to conduct forensics in a containerized environment. Hopefully, the CRIU issue can be fixed soon. And note that CRIU also requires the Docker daemon to be run in experimental mode, while Sysdig and Sysdig Inspect work more at the Kubernetes level. Sysdig Inspect provides a nice UI to help navigate through different activities that happened in the pods and containers.
Summary
In this long chapter, we covered Kubernetes auditing, high availability for a Kubernetes cluster, managing secrets with Vault, detecting anomalous activities with Falco, and conducting forensics with CRIU and Sysdig. Though you may find it will take quite some time to get familiar with all the practices and tools, defense in depth is a huge topic and it is worth digging deeper into security so that you may build up a stronger fence for your Kubernetes cluster.
Most of the tools we talked about are easy to install and deploy. I would encourage you to try them out: add your own Kubernetes audit rules, use Vault to manage secrets in Kubernetes clusters, build your own Falco rules to detect anomalous behavior because you know your cluster better than anyone else, and use Sysdig to collect all the forensics data. Once you get familiar with all of these tools, you should feel confident that your Kubernetes cluster is a bit more under control.
In the next chapter, we're going to talk about some known attacks, such as the crypto mining hack against Kubernetes clusters, and see how we can use the techniques we learned in this book to mitigate these attacks.
Questions
- Why should we not set the audit level to Request or RequestResponse for secret objects?
- What flag is used to set up multiple master nodes in kops?
- What does the sidecar container do when a secret is updated in Vault?
- What are the event sources that Falco uses?
- Which filter does Falco use to retrieve the process name from the system call event?
- What can CRIU do to a running container?
- What can you do with Sysdig Inspect?
Further references
- Kubernetes auditing: https://kubernetes.io/docs/tasks/debug-application-cluster/audit/
- High availability with kubeadm: https://kubernetes.io/docs/setup/production-environment/tools/kubeadm/high-availability/
- Vault: https://www.vaultproject.io/docs/internals/architecture
- Falco: https://falco.org/docs/
- Sysdig filtering: https://github.com/draios/sysdig/wiki/Sysdig-User-Guide#user-content-filtering
- CRIU: https://criu.org/Docker
- Sysdig kubectl-capture: https://sysdig.com/blog/tracing-in-kubernetes-kubectl-capture-plugin/
- Sysdig Inspect: https://github.com/draios/sysdig-inspect
- Sysdig: https://github.com/draios/sysdig