
3. Measuring Marketing at Retail in Convenience Stores
Overview
After the success of the POPAI supermarket study, the organization decided to undertake the next channel study of research in convenience stores. Learnings from the supermarket study were taken into consideration to further improve upon the research and to expand it in certain areas.
The convenience store study was completed in three phases in 2002:
• Retailer process interviews were conducted to understand the role retail marketing played within the channel and the methods used to manage and optimize implementation.
• Shopper intercepts focused on quantifying awareness and capturing recall measures.
• Store-level sales and retail marketing measurement were taken at the UPC level.
The retail audits included both outdoor and indoor advertising. As with the supermarket study, historical data was used to develop baseline sales corrected for historical events that would affect sales. The price algorithm refined in the previous studies was used to isolate the impact of retail marketing campaigns for price promotion. The R2 and ANOVA statistical tests that were used to validate the results showed stability and consistency for modeling results. The reported sales lifts do not represent the value of the exclusive use of single techniques, locations, or messages; they quantify the values of the retail marketing packages combining all three elements, with lift reported as a weighted sales average for each category.
The study was sponsored by six leading brand manufacturers: the Adams division of Pfizer, Anheuser-Busch, Dr. Pepper/7UP, Frito-Lay, Pepsi-Cola, and Quaker Oats, under the auspices of POPAI and the National Association of Convenience Stores (NACS). As with the supermarket study, Prime Consulting Group was the study consultant managing the project, performing analyses, and completing reports. Field work was completed over ten weeks in 120 stores in ten markets involving 57 products tracked in six retail chains: 7-Eleven (Albany, Dallas, Orlando), Auto Stop (Albany, Minneapolis), Chevron (Atlanta, Dallas, Los Angeles, Minneapolis), Nice ‘N Easy (Albany, Dallas, Los Angeles, Orlando, Philadelphia), Sheetz (Philadelphia, Pittsburgh) Shell (Chicago, Dallas, Orlando, Phoenix).
Overall, the researchers found that retail marketing material was present 45.4% of the time, meaning that for the items studied, 45.4% of the time they were supported with retail marketing material somewhere in the store during the store study period. Figure 3.1 summarizes the number of weeks in which the brand had coverage with any marketing at retail support. The box below the bar chart details the percentage of placements in which the brand had interior and exterior support at the same time. The studied categories break into two camps: those heavily supported at retail and those with low levels of marketing at store. Alcoholic beverages and carbonated soft drinks had the highest level of marketing support—both registering levels above 50%—followed closely by salty snacks, energy/isotonic beverages, and water (35% to 40% support). On the other side of the equation, juice, health and beauty care (HBC), gum/mints, and tea collectively registered less than one-third the support of the store average. In fact, support at retail was found every day of the week for both alcoholic beverages and carbonated soft drinks, offering powerful evidence of the important role that retail marketing support plays for these categories and the category importance to this channel.
Similarly, these categories monopolized dual placements in which the category was simultaneously supported with marketing material outside and inside the store. Carbonated soft drinks dominated this execution with dual placement 81% of the time, whereas the categories of salty snacks, water, energy/isotonic drinks, and alcoholic beverages achieved execution rates between 19% and 39% (see Figure 3.1).1
Figure 3.1 Average Coverage by Brand Category
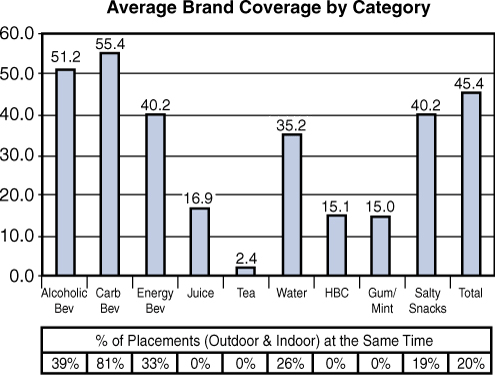
Source: POPAI (2002) Convenience Channel Study
During a typical week, the average convenience store had 25.5 pieces of retail marketing material split between 22 pieces inside the store and 3.5 pieces outside the store. In general, convenience stores had two executions in the gas area, and the others divided between the sidewalk outside the store and the parking lot perimeter. Indoor items included the store windows and core areas and outpost activity (see Figure 3.2).2
Figure 3.2 Retail Marketing Placement
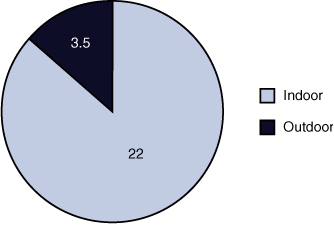
Source: POPAI (2002) Convenience Channel Study
One-third of all marketing occurred in the cooler section with 25% in either outpost displays or endcaps. All other locations made up the remaining 42% with food service, checkout areas, and the front window dominating the techniques used (see Figures 3.3, 3.4, and 3.5).3
Figure 3.3 Key Retail Marketing Locations
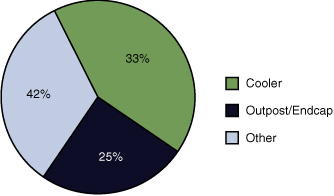
Source: POPAI (2002) Convenience Channel Study
Figure 3.4 Percentage of Retail Marketing by Location
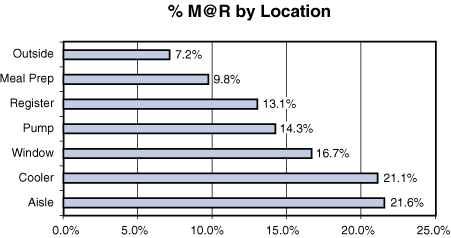
Source: POPAI (2002) Convenience Channel Study
Retail marketing generated an average sales lift of 9.2%. Lift was compared to base level everyday sales with the appropriate adjustments made for price promotion impact. Figure 3.6 compares the average percentage lift by category, with the results ranging from 2.6% for carbonated beverages to 45.5% for juice. Overall, roughly 45 percent of measured items generated a sales increase with retail marketing support, whereas 50 percent recorded no increase. For the campaigns that worked, the average increase was 20.8%. Further, observed in the supermarket study, the sales base for brands varies widely and can have a major impact on percentage measurements. The box below the bar chart details the percentage share of total store unit lift from retail marketing activity; that is, the total store unit increase is 1,000 units with 290 from alcoholic beverages, 300 from carbonated soft drinks, and so on. When measured against this standard, carbonated soft drinks and alcoholic beverages deliver 59% of the total store unit increase. In the case of carbonated beverages, the result comes from a relatively small percentage lift against a dominating base within the store. Alcoholic beverages generate their share of the total unit increase by doubling the average lift percentage in a large category. Similarly, the share of increase for teas and water is roughly even (7 percent and 6 percent, respectively), even though the percentage increase for tea is more than double the water’s lift metric (see Figure 3.6).4
Figure 3.5 Percentage of Category Retail Marketing by Location
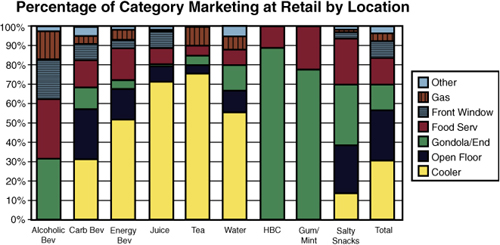
Source: POPAI (2002) Convenience Channel Study
Learning One: Retail Marketing Execution Techniques Concentrated
To a much greater degree than supermarkets, the types of retail marketing are highly concentrated. The top five executions account for 84% of all material in the store, with a low of 48.4% for gum/mints and a high of 94.1% for energy/isotonic drink (see Figure 3.7).5
Figure 3.6 Average Brand Lift by Category
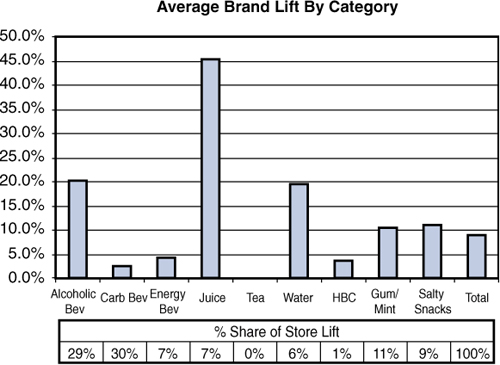
Source: POPAI (2002) Convenience Channel Study
Figure 3.7 Retail Marketing Usage by Category
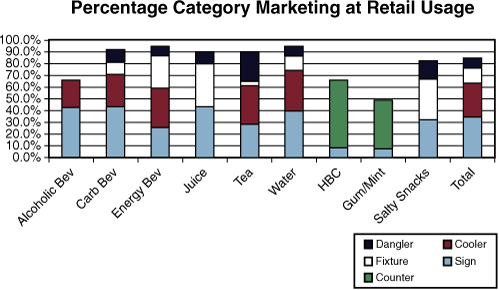
Source: POPAI (2002) Convenience Channel Study
Learning Two: Marketing Messages Concentrated
Messages were even more highly concentrated than the type of retail marketing material used. The top five messages in relative order were brand logo, retail price, product photo, theme, and brand message. Together these accounted for 89% of all messages presented at stores, with the variance in the shopper communication ranging from 84.8% for salty snacks and 96.6% for HBC. Product logos and price messages were used consistently by all brands but the utilization of photos, themes, and brand messages varied widely between the categories. Time in the convenience store is severely compressed, with shopping trips routinely averaging less than five minutes. Retail marketing must operate within the shopper’s time and attention span constraints to be effective. Quick, efficient interactions drive results with location playing a major role (see Figure 3.8).6
Figure 3.8 Top Five Messages by Category
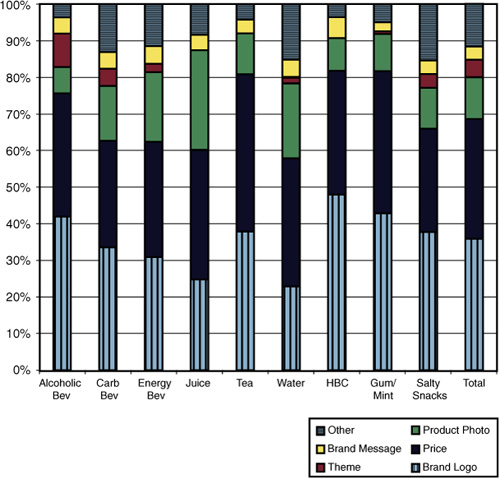
Source: POPAI (2002) Convenience Channel Study
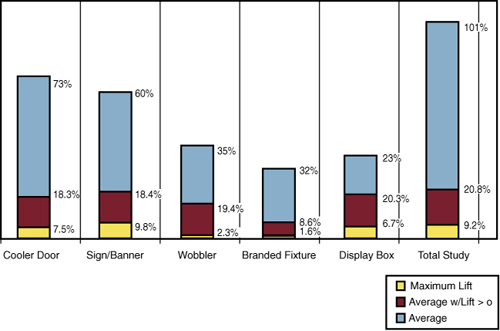
Learning Three: Huge Premium for Excellence
The premium derived from superb execution is huge. Isolating frequently used executions by category and total store results, Figure 3.9 compares three figures for each technique:
• Average sales increase for all activity
• Average lift for successful programs (removing the data for programs that had no recorded sales increase)
• Maximum lift—highest recorded increase
In total, a program that worked doubled the impact of the average program and the most successful executions often tripled or quadrupled typical results. Signs/banners, and cooler door signs were the most commonly used implementations of retail marketing (~60% of all expressions). Even with their frequent use, the positive lift was 18 percent, with the greatest increases ranging from 60 to 70 percent. Likewise, a seemingly straightforward technique, like a dangler, can generate widely divergent outcomes: 2.3% on average, but 19.1% when it works, and a peak of 35 percent (refer to Figure 3.9).7
Figure 3.9 Range of Sales Lift
Source: POPAI (2002) Convenience Channel Study
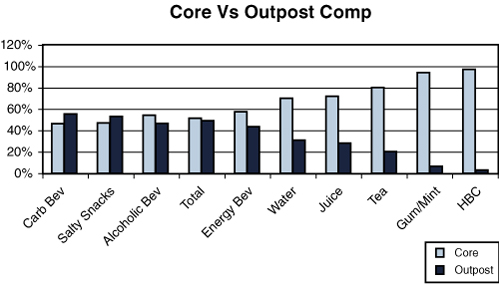
Learning Four: Brand Size Drives Outpost Display Activity
As you might anticipate, large brands dominated secondary locations; that is, displays in locations outside of the core placement area. Alcoholic beverages, carbonated soft drinks, and salty snacks have a commanding presence in the open floor areas (freestanding displays and endcaps), whereas HBC and gum/mints received no exposure (see Figure 3.10).8
Figure 3.10 Core Area Versus Outdoor Placement
Source: POPAI (2002) Convenience Channel Study
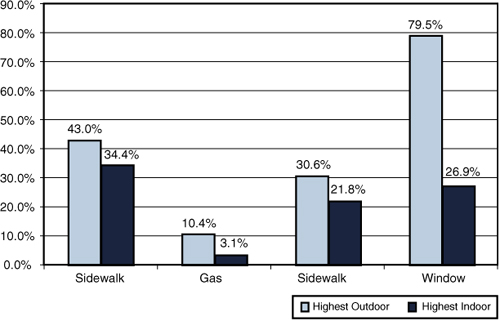
Learning Five: Category Response Varies Widely by Message Location
The convenience store heightened the focus on the role of location in driving sales results by expanding the study’s focus to the area outside the store and further dissecting the location’s role within the store. Some of the learning gained from this analysis includes a basic understanding of the effectiveness of outdoor locations by product type. In general, successful outdoor executions yielded strong results, with the best programs uniformly exceeding the in-store performance for the same brand. The chart in Figure 3.11 compares the lift from outdoor material against the same brand’s indoor execution.9
Specific insights from parsing the sales results include the following:
• Gas area delivers strong results for immediate consumption products but weak returns for take-home packages.
• Sidewalk displays are effective locations for take home products.
• Small signs placed at the entrance to the store generated negligible response.
Figure 3.11 Outdoor Versus Indoor Lift
Source: POPAI (2002) Convenience Channel Study
• Advertising without product was not beneficial at the food service area. For example, salty snack advertising with product display was very successful; gum/mint advertising without product was not.
• Checkout consistently delivered strong results for impulse items with results typically in the 30% range.
• On-shelf advertising results varied with some categories generating no response and others, such as salty snacks, developing effective campaigns.
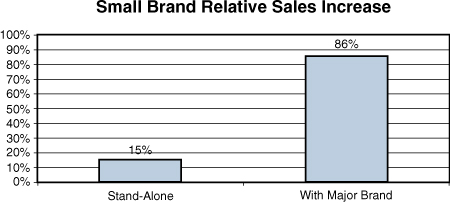
Learning Six: Borrowed Interest Has a Disproportionate Impact on Smaller Brands
With larger brands dominating secondary locations, medium and smaller bands generated results with creative expressions in their core areas and by borrowing interest. Whenever a smaller brand was linked with a dominant brand, the sales impact was significant with sales increase averaging 86%—more than five times the lift from stand-alone efforts (see Figure 3.12).10
Figure 3.12 Small Brand Relative Sales Increase
Source: POPAI (2002) Convenience Channel Study
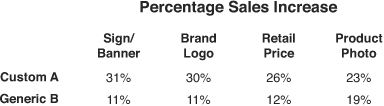
Learning Seven: Strong Brand Expression Significantly Outperforms Generic Treatment
Retail marketing programs that relied on generic retailer programs or focused on linking with, or identifying, a specific retailer were not effective as compared with the lift generated by custom material that had strong brand identification. Brand programs usually relied on strong imagery with high-quality production values. The study compared a large brand’s custom execution within the alcoholic beverage category with the generic program executed by its smaller competitor. Across all retail marketing executions, with the exception of product photos, the custom approach outperformed the generic execution, doubling or tripling sales. Because the large brand operated from a significantly higher base, dollar volume increases were four to seven times greater (see Figure 3.13).11
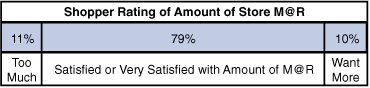
Learning Eight: Store Is Not Overloaded with Retail Marketing Material
The research team assessed shoppers’ views on the amount of retail marketing material presented through intercept interviews. The vast majority of shoppers are satisfied with the amount of retail marketing present within convenience stores. Seventy-nine percent were satisfied or very satisfied, whereas those wanting more roughly equaled those wanting less. The response clustering across chains in the study was consistent. For example, whereas 11 percent of the overall shoppers surveyed thought too much material was present, the variation between chains was only 6 to 15 percent.
Figure 3.13 Custom Versus Generic Sales Increase
Further supporting their expressed satisfaction with the level of retail marketing present, when shoppers were interviewed post-purchase, 59% said that marketing at retail was somewhat or very helpful in making their purchase decision. Additionally, unaided recall for retail marketing presentations was 40 percent, indicating a strong registration of the messages observed in store (see Figure 3.14).12
Figure 3.14 Shopper Rating of Amount of Retail Marketing
Source: POPAI (2002) Convenience Channel Study
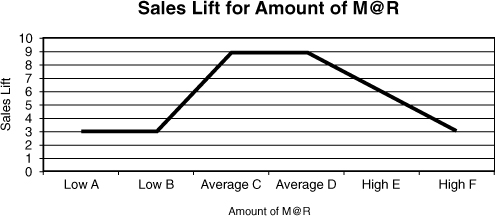
The study also measured sales results across retailers compared to the amount of retail material they presented to the shoppers. Despite shoppers’ expressed satisfaction with the amount of material across the retailer population, sales results varied somewhat with the amount of retail marketing material present. Although the study sample is not large enough to firmly establish a causal relationship, the data suggests a sweet spot for the density of retail marketing with too few campaigns depressing results and diminishing returns for excessive levels (see Figure 3.15).13
Figure 3.15 Sales Lift for Amount of Retail Marketing
Source: POPAI (2002) Convenience Channel Study
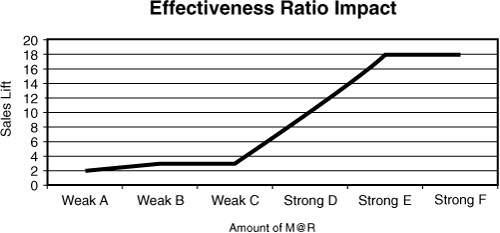
Learning Nine: Effectiveness Ratio Predicts Sales Success
To evaluate the overall message impact, Prime Consulting Group clustered marketing at retail programs into effective and ineffective campaigns based on the identification of consistently recorded performance for the combination of technique, location, and message (see Figure 3.16).14 Routinely effective communication included product photos, retail price, brand logo/message, and savings. Conversely, generic fixtures and programs produced poor results. Effective programs included impulse products at the gas pump, take-home product at the sidewalk, beer outposts, and small-brand cooler signage. Consistently ineffective efforts included advertising without products at food service locations, signage at the front door, on-shelf advertising for gum/mints, and HBC. Stores with high-quality programs consistently generated stronger results than those with weak total programs. The correlation with strong programming is greater than with the amount of retail marketing material offered and was an accurate predictor of sales success.
A comparison of the sales results against both the amount of advertising and the level of use of effective campaigns highlights the combined effect on sales performance with the effectiveness ratio more strongly predicting success (see Figure 3.17).15
Figure 3.16 Effectiveness Ratio Impact
Source: POPAI (2002) Convenience Channel Study
Figure 3.17 Chain Results Analysis
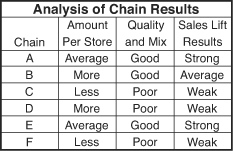
Source: POPAI (2002) Convenience Channel Study
Learning Ten: Retailer Analysis Yields Success Implementation Model
The convenience store study expanded investigation of the marketing at retail environment to include a consideration of retailer perception of the role of retail marketing in the stores and the impact of effective management of retail marketing execution on results. The research included retailer process interviews and analyses of successful execution elements. The interviews revealed a great level of concentration on a variety of planning initiatives, such as category management and promotion planning, with less focus on executing those plans. Most organizations surveyed were now recalibrating their attention on programs that they could reasonably execute.
The evaluation of program optimization focused on the role of planning in driving successful execution and considered the perspective of brand marketers, retailers, and agencies/producers.
Effective planning includes three key areas: proof of placement, sales effectiveness, and cost efficiency. Proof of placement means simply ensuring that the intended advertising is in place where it was planned for the intended period. It is the responsibility of all participants to evaluate and improve the level of execution in store, whereas brand marketers and retailers share the burden of measuring compliance (the level of execution against preset targets) and working together to improve the accuracy and timeliness of proof of placement information (see Figure 3.18).
Figure 3.18 Proof of Placement16
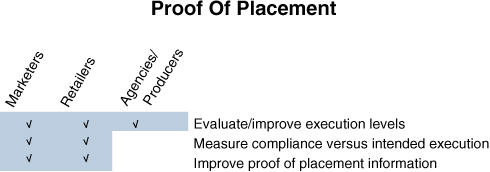
Source: POPAI (2001) POP Measures Up: Learnings from the Supermarket Class of Trade
Sales effectiveness focuses on the direct return on investment generated by the retail marketing programs chosen. A few of the key questions include the following: did the program work, what can we learn from this experience, and what return did the program generate? All participants share the responsibility for understanding what works and analyzing programs to develop return on investment metrics. For brand programs, brand marketers and agencies/producers would lead efforts to generate insights from previous experience, include value-added elements in the program for both retailers and shoppers, and to optimize the budget (see Figure 3.19).
Cost-efficiency measures target the maximization of the return on every dollar invested in retail marketing. The process starts with a comparison of all media options for the contemplated campaign and the integration of retail marketing into the planning mix to both ensure that it is considered as a media alternative and that we generate the maximum return on our marketing investment by coordinating our message across all the media chosen. Brand marketers lead the consideration of available media options and integration. In this category all participants share the responsibility for planning, measuring, executing, and analyzing programs (see Figure 3.20).
Figure 3.19 Sales Effectiveness17
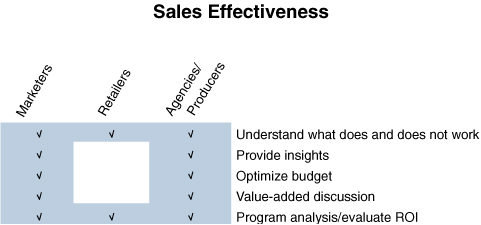
Source: POPAI (2001) POP Measures Up: Learnings from the Supermarket Class of Trade
Figure 3.20 Cost Effective Audience Measures18
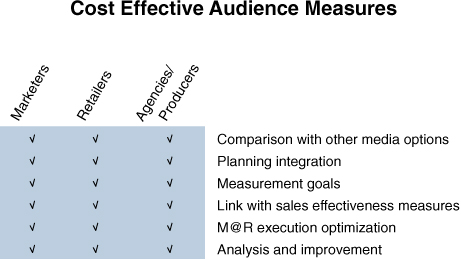
Source: POPAI (2001) POP Measures Up: Learnings from the Supermarket Class of Trade
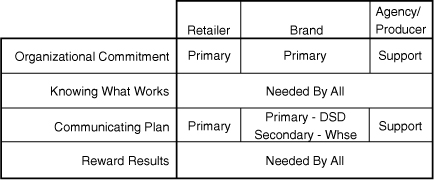
Any program’s results are constrained by the level of implementation achieved at the store. The convenience store study focused significant attention on measuring the relative success level of the retail participants in implementing the programs they planned and then dissecting and analyzing the critical success elements for the most effective retailers. The analysis identified four key elements that drove consistent success: knowing what works, communicating the plan, commitment to executing the plan, and rewarding implementation. Although everyone shares the responsibility for implementing successful programs (just as they share the rewards), the level of involvement in each of these areas varies. Although the process appears straightforward, implementation varied widely across retailers. The chart in Figure 3.21 summarizes the importance of each success element to each segment of the retail marketing community.19
Figure 3.21 Success Element Importance by Segment
Source: POPAI (2002) Convenience Channel Study
The study data increases the knowledge base of what works in convenience stores. One retailer in the study exemplified the four elements associated with successful implementation. This retailer utilized a formal planning tool to share the expected execution with everyone from the president to each store manager. The communication tool specified what was to be implemented in each store location with an overall plan and detailed visuals by individual area. Executives carried the document with them on every store visit and reviewed compliance and sales results with store managers. Store manager compensation included a consideration of the implementation of retail marketing programs. Not surprisingly, this retailer generated consistently superior results by setting up a feedback cycle for campaign effectiveness and then routinely implementing refined plans:
Knowledge→Communication→Commitment→Reward
The convenience store study built on the previous research efforts to provide additional consideration of the role of message in concert with, and separate from, location, while also expanding the research to include a measurement of shopper attitudes and the role key participants play in implementing successful retail marketing campaigns. Unlike supermarkets, convenience stores represent a fairly homogeneous retail environment with general similarities in the products presented, overall footprint, the shopper need-state, and the amount of time spent in store. The similarities across stores within a chain and retail chains within the channel facilitated the isolation of key success variables. Shopper surveys combined with analysis of retail results identified a general satisfaction with the amount of marketing material presented at retail and an indication of a sweet spot for the density of merchandising. Retailer surveys led to the identification of the critical path for executing successful retail marketing programs for store operators and the responsibilities each segment of the marketing community bears in achieving mutual success.
Endnotes
1. Doug Adams, “POPAI Convenience Channel Study,” Washington, D.C., POPAI (2002), page 6.
2. Ibid., 6.
3. Ibid., 6.
4. Ibid., 11.
5. Ibid., 7.
6. Ibid., 8.
7. Ibid., 12.
8. Ibid., 7.
9. Ibid., 18.
10. Ibid., 21.
11. Ibid., 13.
12. Ibid., 14.
13. Ibid., 14.
14. Ibid., 14.
15. Ibid., 14.
16. Doug Adams, “POP Measures Up: Learning from the Supermarket Class of Trade,” Washington, D.C., POPAI (2001), page 11.
17. Ibid.
18. Ibid.
19. Doug Adams, “POPAI Convenience Channel Study,” Washington, D.C., POPAI (2002), page 17.