
When we have users who complain of poor performance, the first step is profiling our application. Nowadays, every programming language can be profiled to look for the cause of poor performance. It's an important step because it lets us focus only on the correct cause of the performance decay that the users are experiencing. The risk, in fact, is to go on a wild goose chase, trying to optimize functions and queries that don't affect the whole performance of the application in a relevant way. Above all, we do not have an objective measure of the improvements that we get.
Therefore, suppose that we use a profiler, that is specific to our programming language (either Java, PHP, Ruby, or anything else), and we found that the code executing the following query is very slow:
MATCH(n:User {email:'[email protected]'})
RETURN n
We need a way to profile this query to understand the operation made by the Cypher engine and its performance cost so that we can act to reduce the whole cost.
If we were working with Neo4j Embedded, we would have a code that looks like the following:
import org.neo4j.cypher.javacompat.ExecutionEngine;
import org.neo4j.cypher.javacompat.ExecutionResult;
// ... more code
String query = "MATCH(n:User {email: {emailQuery}}) RETURN n";
Map<String,Object> params = new HashMap<>();
params.put("emailQuery", "[email protected]");
ExecutionResult result = engine.execute(query, params);
Neo4j provides a way to evaluate the performance of a query. The ExecutionEngine class has the profile method, which returns an ExecutionResult object with profiling statistics. Invoke it in the same way you call the execute object. This is described in the following code snippet:
ExecutionResult result = engine.profile(query, params);
The only difference is that we can now invoke the executionPlanDescription method of the ExecutionResult object. This method is always present in the ExecutionResult class but can be invoked only once the query is profiled, not when the query is merely executed; calling this method after an execute call will cause an exception to be thrown. Now, consider the following query:
result.dumpToString();
PlanDescription planDescription =
                  result.executionPlanDescription();
We called the dumpToString function before accessing the execution plan because it is available only after the result is enumerated. From Chapter 1, Querying Neo4j Effectively with Pattern Matching, you will remember that the ExecutionResult instance can be enumerated in three ways: via either the dumpToString or columnAs functions or an iterator function. Whichever you use is fine, you just need to enumerate the result before requesting the execution plan.
The execution plan informs us about the operations made by the execution engine to perform our query. We can dump the string representation of the plan. This is described in the following code snippet:
System.out.println(res.executionPlanDescription().toString());
For the MATCH(n:User {email: {emailQuery}}) RETURN n query, we get the following result:
Filter(pred="Property(n,email(0)) == {emailQuery}", _rows=1, _db_hits=1000)
NodeByLabel(identifier="n", _db_hits=0, _rows=1000, label="User", identifiers=["n"], producer="NodeByLabel")
What can we gather from this result? We have the following two steps:
NodeByLabel: This step means that the Cypher engine selected all nodes using a label; the label of course isUserand the identifier to match isn. This operation processed 1000 rows (all the users we have in our database). A very important information is the number of database hits. This represents the number of the potential disk accesses to perform this step; the greater the number, the worse is the performance of the query.Filter: This step represents the filtering operation on the set that was returned by the previous operation. This has 1000 database hits.
So, the problem in this query resides in the way we are filtering our dataset.
Neo4j Shell is a great tool to monitor and interact with a running Neo4j Server. It can be used for profiling by performing the following steps:
- In Windows, to start the shell, you have to launch the
Neo4jShell.batfile in thebinfolder of theInstallationfolder, while in Linux, you have to launch theneo4-shellbash script.Note
Neo4j Shell is not provided with the Windows installer of the Neo4j Community. To get it, you have to download the
.zipbinary from http://www.neo4j.org/download/other_versions. - Once it is started and ready, Neo4j Shell shows a command prompt. It supports many commands. You can get a list of them by typing
help. - Using the
profilecommand, you can instruct Neo4j Shell to perform a Cypher query, dump the result to the screen, and show the execution plan of the query. The syntax is simple:profile <query>;. For example, typing in the following command will give the result shown in the following screenshot. Note that you have to put the semicolon after the Cypher query to mark the end of the command:profile MATCH(n{email:"[email protected]"}) RETURN n;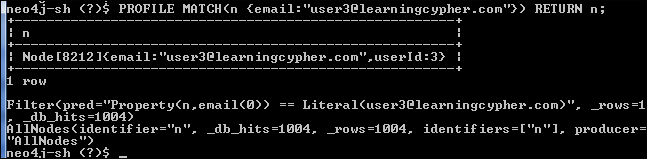
To obtain the execution plan and statistics, the POST request that is made to the server must be changed. We need to enable the profile option by setting it to true in the request. Our new POST request is /db/data/cypher?profile=true.
You can try it in any REST client or in Neo4j Browser. In the prompt, type in the following code:
:POST /db/data/cypher?profile=true {
  "query": "MATCH(n:User {email: {emailQuery}}) RETURN n.userId",
  "params": {
      "emailQuery": "[email protected]"
   }
}
The only difference between the preceding query and the query in the Profiling using the Java API section is that in the preceding query, only the userId property is returned. The intention is to reduce the length of the output and reduce the bandwidth occupied by the response. The following JSON code is the result:
{
  "columns": ["n.userId"],
  "data": [[300]],
  "plan": {
    "name": "ColumnFilter",
    "args": {
      "symKeys": ["n", "n.userId"],
      "returnItemNames": ["n.userId"],
      "_rows": 1,
      "_db_hits": 0
    },
    "rows": 1,
    "dbHits": 0,
    "children": [{
      "name": "Extract",
      "args": {
        "symKeys": ["n"],
        "exprKeys": ["n.userId"],
        "_rows": 1,
        "_db_hits": 1
      },
      "rows": 1,
      "dbHits": 1,
      "children": [{
        "name": "Filter",
        "args": {
          "pred": "Property(n,email(0)) == {emailQuery}",
          "_rows": 1,
          "_db_hits": 1000
        },
        "rows": 1,
        "dbHits": 1000,
        "children": [{
          "name": "NodeByLabel",
          "args": {
            "identifier": "n",
            "_db_hits": 0,
            "_rows": 1000,
            "label": "User",
            "identifiers": ["n"],
            "producer": "NodeByLabel"
          },
          "rows": 1000,
          "dbHits": 0,
          "children": []
        }]
      }]
    }]
  }
}
The first property (columns) contains the column names of the data returned as result. The second property (data) contains the result of the query, while the third property (plan) stores the execution plan.
You may have noticed that here we have the same steps as in the Java API and two more steps: Extract and ColumnFilter. They are related to the fact that we are returning only one property, not the whole node. Anyway, they are not important now because they generate a minimal number of database hits. The following screenshot shows how we can invoke the REST API:

Invoking the REST API with Advanced REST client, a Chrome plugin