
It is a good practice to include messages that indicate what the program is doing. But we must do it without compromising on the efficiency of our software and the clarity of its output. In ROS, we have an API that covers both features, built on top of log4cxx (a port of the well-known log4j logger library). In brief, we have several levels of messages, which might have a name (named messages) and depend on a condition or even throttle. All of them have a null footprint on performance if they are masked by the current verbosity level (even at compile time). They also have full integration with other ROS tools to visualize and filter the messages from all the nodes running.
ROS comes with a great number of functions/macros to output logging messages. It supports different levels, conditions, STL streams, throttling, and other features that we will see in this section. To start with something simple, an information message is printed with this code in C++:
$ ROS_INFO("My INFO message.");
In order to have access to these logging functions/macros, this header is enough:
#include <ros/ros.h>
This includes the following header (where the logging API is defined):
#include <ros/console.h>
As a result of running a program with the preceding message, we will get the following output:
[ INFO] [1356440230.837067170]: My INFO message.
All messages are printed with their level and the current timestamp (your output might differ for this reason), before the actual message, with both between square brackets. The timestamp is the epoch time, that is, the seconds and nanoseconds since January 1, 1970. Then, we have our message—always with a newline:
This function allows parameters in the same way as the C printf function does. For example, we can print the value of a floating point number in the variable val with this code:
float val = 1.23;
ROS_INFO("My INFO message with argument: %f", val);
Also, C++ STL streams are supported with *_STREAM functions. Therefore, the previous instruction is equivalent to the following using streams:
ROS_INFO_STREAM("My INFO message with argument: " << val);Note that we did not specify any stream since the API takes care of that by redirecting to cout/cerr, a file, or both.
ROS supports the following logging levels (in the increasing order of relevance):
DEBUGINFOWARNERRORFATAL
These names are part of the function used to output messages following this syntax:
ROS_<LEVEL>[_<OTHER>]
Each message is printed with a particular color. The colors are as follows:
DEBUG in green
INFO in white
WARN in yellow
ERROR in red
FATAL in purple
Each message level is meant to be used for a different purpose. Here, we suggest uses for the following levels:
DEBUG: These messages are useful only when debuggingINFO: These messages indicate significant steps or what the node is doingWARN: These messages warn you that something might be wrong, missed, or abnormalERROR: These messages indicate errors although the node can still runFATAL: These error messages usually prevent the node from continuing to run
By default, only messages of INFO or higher levels are shown. ROS uses the levels to filter the messages printed by a particular node. There are many ways to do so. Some of them are set at the time of compilation and some messages aren't even compiled below a given verbosity level; others can be changed before execution using a configuration file, and it is also possible to change that level dynamically using the rqt_console and rqt_logger_level tools.
It is possible to set the logging level at compile time in our source code, but this is very uncommon and not recommended because it requires us to modify the source code to change the logging level; please refer to Learning ROS for Robotics Programming, Packt Publishing, if you want to see how to do it.
Nevertheless, in some cases, we need to remove the overhead of all the logging functions below a given level. In that case, we want to be able to see those messages later because they get removed from the code and not just disabled. To do so, we must set ROSCONSOLE_MIN_SEVERITY to the minimum severity level desired or even none in order to avoid any message (even FATAL). The macros are as follows:
ROSCONSOLE_SEVERITY_DEBUG
ROSCONSOLE_SEVERITY_INFO
ROSCONSOLE_SEVERITY_WARN
ROSCONSOLE_SEVERITY_ERROR
ROSCONSOLE_SEVERITY_FATAL
ROSCONSOLE_SEVERITY_NONE
The ROSCONSOLE_MIN_SEVERITY macro is defined in <ros/console.h> to the DEBUG level if not given. Therefore, we can pass it as a built argument (with -D) or put it before all the headers. For example, to show only ERROR (or higher) messages, we will put this in our source code:
#define ROSCONSOLE_MIN_SEVERITY ROSCONSOLE_SEVERITY_ERROR
Alternatively, we can set this to all the nodes in a package setting this macro in CMakeLists.txt by adding this line:
add_definitions(-DROSCONSOLE_MIN_SEVERITY=ROSCONSOLE_SEVERITY_ERROR)
On the other hand, we have the more flexible solution of setting the minimum logging level in a configuration file. We create a config folder with a file, such as chapter3_tutorials.config, and this content (edit the file given since it is set to DEBUG):
log4j.logger.ros.chapter3_tutorials=ERROR
Then, we must set the ROSCONSOLE_CONFIG_FILE environment variable to point to our file. We can do this on a launch file that also runs the node. Therefore, we will extend the launch file shown earlier to do so with the env (environment variable) element as shown here:
<launch>
  <!-- Logger config -->
  <env name="ROSCONSOLE_CONFIG_FILE"
       value="$(find chapter3_tutorials)/config/chapter3_tutorials.config"/>

  <!-- Example 1 -->
  <node pkg="chapter3_tutorials" type="example1" name="example1"
        output="screen"/>
</launch>
The environment variable takes the configuration file shown previously, which contains the logging level specification for each named logger; in this case, it is for the package name.
By default, ROS assigns several names to the node loggers. The messages discussed until now will be named after the node's name. In complex nodes, we can give a name to those messages of a given module or functionality. This is done with ROS_<LEVEL>[_STREAM]_NAMED functions (see the example2 node):
ROS_INFO_STREAM_NAMED(
  "named_msg",
  "My named INFO stream message; val = " << val
);
With named messages, we can set different initial logging levels for each named message using the configuration file and modify them individually later. We must use the name of the messages as children of the package in the specification; for example, for named_msg messages, we will use the following code:
log4j.logger.ros.chapter3_tutorials.named_msg=ERROR
Conditional messages are printed only when a given condition is satisfied. To use them, we have the ROS_<LEVEL>[_STREAM]_COND[_NAMED] functions; note that they can be named messages as well (see the example2 node for more examples and combinations):
ROS_INFO_STREAM_COND(
  val < 0.,
  "My conditional INFO stream message; val (" << val << ") < 0"
);
Filtered messages are similar to conditional message in essence, but they allow us to specify a user-defined filter that extends ros::console::FilterBase; we must pass a pointer to such a filter in the first argument of a macro with the format ROS_<LEVEL>[_STREAM]_FILTER[_NAMED]. The following example is taken from the example2 node:
struct MyLowerFilter : public ros::console::FilterBase {
  MyLowerFilter( const double& val ) : value( val ) {}
  inline virtual bool isEnabled() { return value < 0.; }
  double value;
};

MyLowerFilter filter_lower( val );

ROS_INFO_STREAM_FILTER(&filter_lower,
  "My filter INFO stream message; val (" << val << ") < 0"
);It is also possible to control how many times a given message is shown. We can print it only once with ROS_<LEVEL>[_STREAM]_ONCE[_NAMED]:
for( int i = 0; i < 10; ++i ) {
  ROS_INFO_STREAM_ONCE("My once INFO stream message; i = " << i);
}
This code from the example2 node will show the message only once.
However, it is usually better to show the message with a certain frequency. For that, we have throttle messages. They have the same format as the once message, but here ONCE is replaced with THROTTLE, and they have a first argument, which is period, that is, it is printed only every period seconds:
for( int i = 0; i < 10; ++i ) {
  ROS_INFO_STREAM_THROTTLE(2,
    "My throttle INFO stream message; i = " << i);
  ros::Duration( 1 ).sleep();
}
Finally, note that named, conditional, and once/throttle messages can be used together with all the available levels.
Nodelets also have some support in terms of logging messages. Since they have their own namespace, they have a specific name to differentiate the message of one nodelet from another. Simply put, all the macros shown until now are valid, but instead of ROS_*, we have NODELET_*. These macros will only compile inside nodelets. Also, they operate by setting up a named logger with the name of the nodelet running so that you can differentiate between the outputs of two nodelets of the same type running in the same nodelet manager. They also have the advantage that you can turn one specific nodelet into the debug level instead of all the nodelets of a specific type.
ROS provides a series of tools to manage logging messages. In ROS hydro, we have two separate GUIs: rqt_logger_level to set the logging level of the nodes or named loggers and rqt_console to visualize, filter, and analyze the logging messages.
In order to test this, we are going to use example3. Run roscore and rqt_console to see the logging messages:
$ rosrun rqt_console rqt_console
The following window will open:
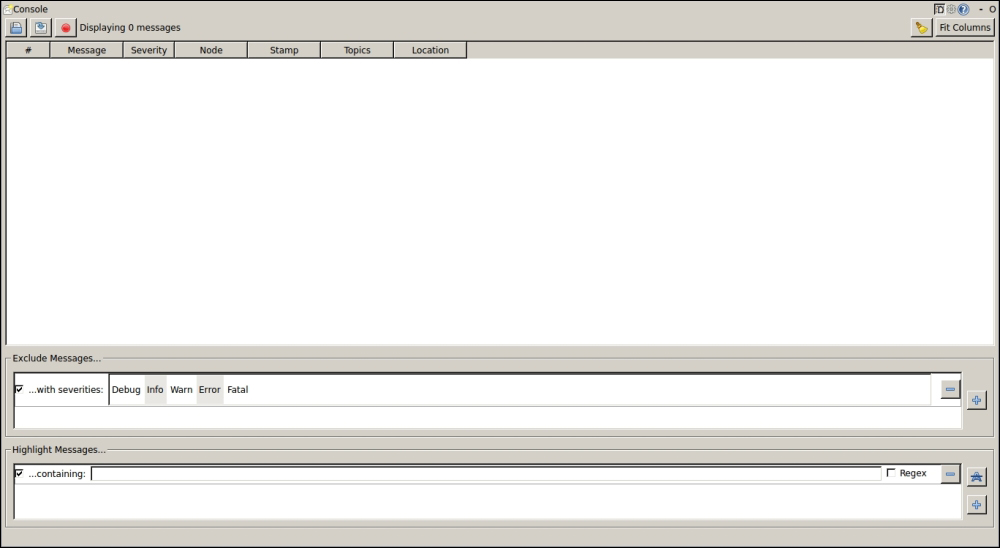
Now run the node:
$ rosrun chapter3_tutorials example3
You will start seeing the logging messages, as the next screenshot shows. Note that roscore must be running and that you must press the recording button on rqt_console.
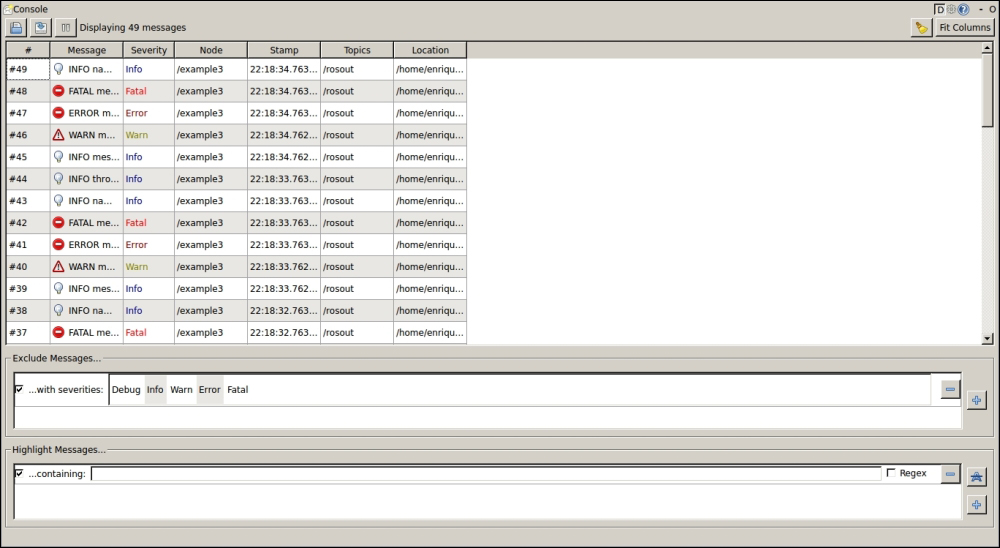
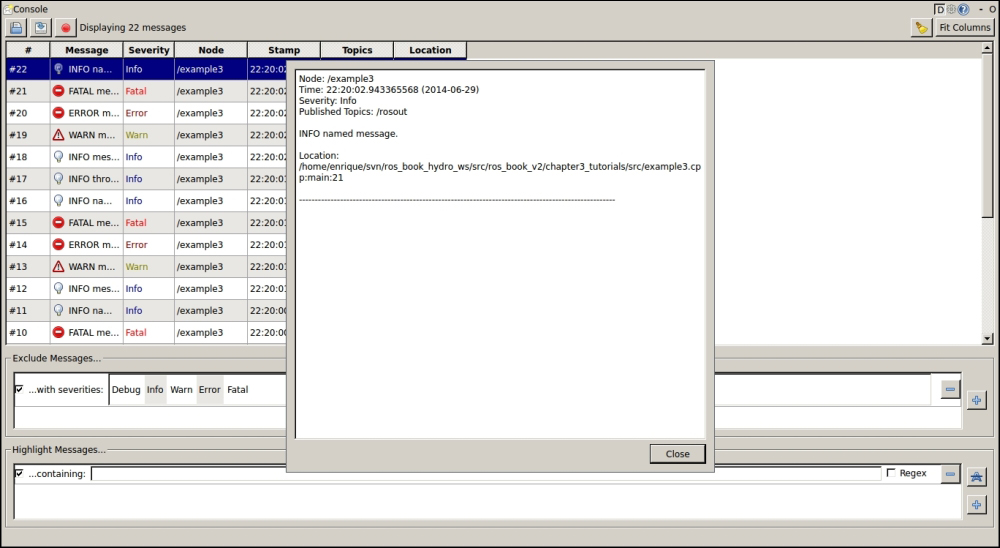
In rqt_console, the messages are collected and shown in a table where different columns separate the timestamp, the message itself, the severity level, and the node that produced that message, besides other information. You can fit the columns automatically by pressing the Resize columns button. If you double-click on a message, you can see all the information, including the line of code that generated it, as shown in the screenshot:
This interface allows pausing, saving, and loading previous/saved logging messages. We can clear the list of messages and filter them. In ROS hydro, excluding filtered ones, the messages have specific interfaces depending on the filter criteria. For instance, nodes can be filtered with a single rule, where we select the nodes we want to exclude. Additionally, in the same way, we can set highlighting filters. This is shown in the following screenshot:
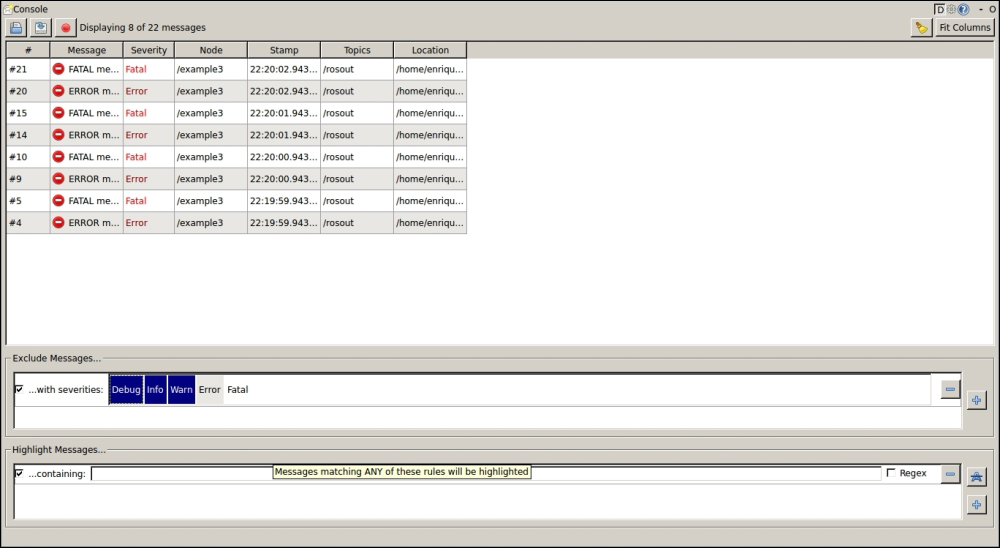
As an example, the messages from the previous image are filtered by excluding those with a severity different than ERROR and FATAL.
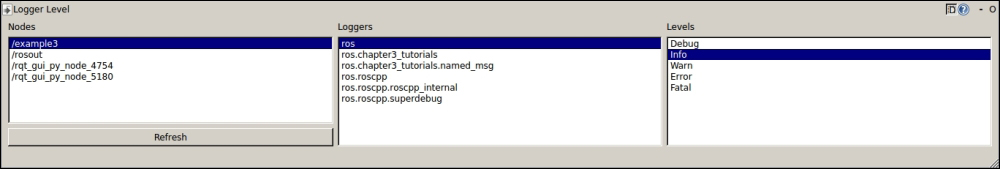
In order to set the severity of the loggers, we must run the following command:
$ rosrun rqt_logger_level rqt_logger_level
Here, we can select the node, then the named logger, and finally its severity. Once we modify it, the new messages received with a severity below the desired one will not appear in rqt_console:
Shown in the next screenshot is an example where we set the severity level to the minimum (DEBUG) for the named logger, ros.chapter3_tutorials.named_msg, of the example3 node; remember that the named loggers are created by the *_NAMED logging functions:
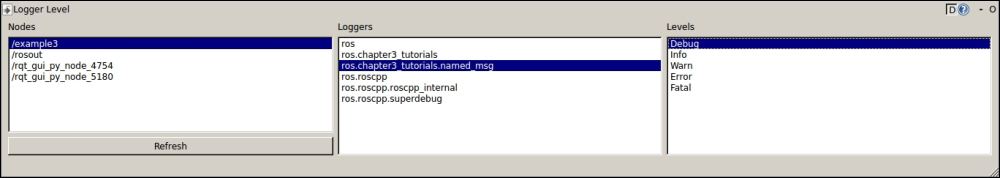
As you can see, every node has several internal loggers by default, which are related to the ROS communication API, among others; in general, you should not reduce their severity.