6
Colour Temperature/ND Filters
6.1 Colour Temperature – Defining White
Defining what we mean by ‘white’ is a major concern in colour television. The process of calibrating the colour camera ‘white’ point is known as white balance, in which the camera is exposed to a line-up chart or white card suitably lit with ‘white’ light. The camera’s autowhite balance facility equalises the RGB signals (R and B matched to G) so that the line-up chart or white card looks neutral or white.
Our perception process accepts many sources of light as white, e.g. daylight, tungsten light, fluorescent light, metal halide discharge lights, xenon lights etc. So how can we define what is meant by white? One convenient way is to use the concept of colour temperature by comparing the colour of light from a light source with the colour of light from a full radiator (black body radiator, furnace or poker) which radiates light of differing colours according to its temperature. Taking a poker (an iron rod) as an everyday example, when it is cold it will look black (reflecting very little light). As the poker is heated, it will begin to emit light, first glowing red, then orange followed by yellow, white and ultimately blue as its temperature rises. The temperature at which the colour of the light source and the colour of the poker match is known as its colour temperature.
Colour temperature is measured in Kelvin after Lord Kelvin the physicist. The Kelvin scale of temperature is based on the absolute temperature scale which has 0 Kelvin at –273°C (this avoids complications of minus values).
Tungsten and Daylight
The most common colour temperatures in television work relate to tungsten lit scenes and daylight lit scenes, i.e.
| Tungsten halogen | 3200 K | (tungsten film) |
| Average summer sunlight | 5500 K | (daylight film) |
These are the ‘white points’ for colour film, and the film is ‘balanced’ to operate with these particular colour temperatures. The colour camera has the advantage that it has a moveable ‘white point’ and may be white balanced to a wide range of colour temperatures. Cameras also have a pre-set white balance to 3200 K or 5600 K which is factory set (see later section on the camera filter wheel), newer cameras have a pre-set white balance of 3200 K, 4300 K and 6300 K.
Tolerances
When using more than one light source it is important that the sources match each other in their colour rendition properties. Tungsten light sources will only have a colour temperature of 3200 K when
- the lamp is relatively new
- the mains voltage is correct.
Any reduction of mains voltage either by dimming or simply due to the voltage drop on cables will reduce the colour temperature (light becomes yellow–orange–red as it is dimmed) and also the light output. Typically, tungsten sources should be matched in colour temperature to within ±150K. (See Figure 8.2 on p. 76.)
Sunlight
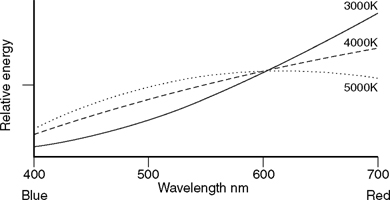
Note how sunlight has been modified on entering the Earth’s atmosphere (Figure 6.2) – energy distribution is not identical to Figure 6.1. This is because the shorter wavelengths (blue) of sunlight are scattered by tiny particles of dust in the Earth’s atmosphere. The scattered light (blue) creates the illusion of a ‘sky’, with some of the light scattered back to space. Figure 6.3 illustrates this.
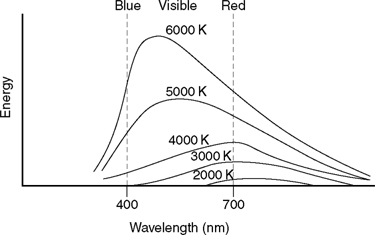
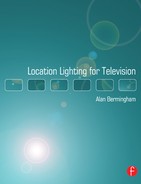
Figure 6.1 Spectral energy distribution for a black-body radiator
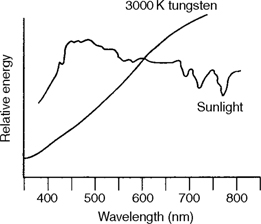
Figure 6.2 Relative spectral energy distribution for tungsten and sunlight
Figure 6.3 Scattering of blue wavelengths to give blue ‘sky’
‘Sunlight’ is therefore a combination of skylight and direct sunlight. Strictly speaking, the measurement of daylight/sunlight are correlated colour temperatures.
Daylight
This varies enormously in colour during the day. Average summer sunlight at 5500 K needs to be matched to ±400 K when additional light sources are used. This tolerance appears to be greater than that for tungsten, but the perceived colour shift in tungsten ±150K and daylight ± 400 K will be the same! The change in colour for each 1 Kelvin shift is less as the colour temperature of the light source is increased.
If light sources are not within the colour temperature tolerance of the camera’s ‘white balance’ then the sources have to be corrected with appropriate filters.
An important psychological/physiological difference should be noted. We associate red/ orange with warmth and blue colours with cold, but with colour temperatures, as the source becomes physically hotter, the colour temperature increases and it becomes blue!
6.2 Colour Temperature Correction
For many location shoots there is a need to cope with the problem of mixed lighting, e.g. daylight and tungsten sources. Typically this would be when lighting indoors during daylight hours. There is a need to correct the light sources to a common colour temperature, by using appropriate filters:
- to correct the tungsten sources to daylight (5500 K)
- to correct the daylight to tungsten (3200 K)
- to correct both sources to an intermediate value, say 4300 K.
There are two basic colour correction filters, colour temperature blue (CTB) and colour temperature orange (CTO). The colour temperature blue (CTB) filters transmit more blue wavelengths than orange/red wavelengths, and the increase in the proportion of blue light and decrease in red light results in an increase in colour temperature (Figure 6.4).
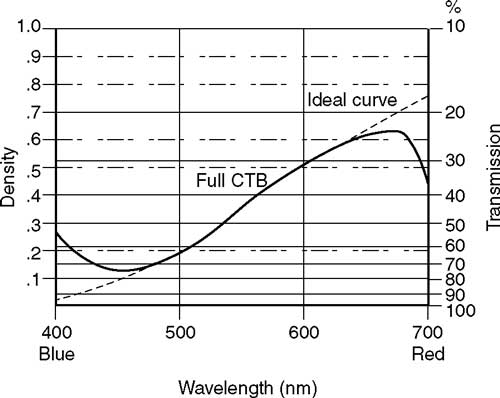
Figure 6.4 Filter characteristics for full colour temperature blue (CTB)
Often it is necessary to make intermediate or minor adjustments to colour temperature and a range of CTB filters is therefore available for this purpose as shown in Table 6.1.
Table 6.1 Colour temperature blue (CTB) filters – basic conversion
| Filter | Conversion (K) | Transmission (%) |
| Full CTB | 3200–5700 | 34 |
| ¾CTB | 3200–5000 | 45 |
| ½CTB | 3200–4300 | 55 |
| ¼CTB | 3200–3600 | 69 |
| 1/8CTB | 3200–3400 | 81 |
Note: See later tables for complete data on conversion.
Note the transmission of a full colour temperature blue, often referred to as a ‘full blue’, is only about 33%! This represents a significant loss of light. For example, a 2 kW tungsten lamp effectively becomes a 660 W lamp. Often a compromise is made on correction and light loss by using a ½CTB, or the recently developed ¾CTB.
The CTO filters behave in the opposite way to the CTB filters. They transmit more orange/red wavelengths than blue, consequently the colour temperature is decreased (Figure 6.5). A similar range of CTO filters is available to make possible intermediate or minor adjustments to colour temperature (Table 6.2).
Table 6.2 Colour temperature orange (CTO) filters – basic conversion
| Filter | Conversion (K) | Transmission (%) |
| Full CTO | 6500–3200 | 55 |
| ¾CTO | 6500–3600 | 61 |
| ½CTO | 6500–3800 | 71 |
| ¼CTO | 6500–4600 | 79 |
| 1/8CTO | 6500–5500 | 85 |
Note: See later tables for complete data on conversion.
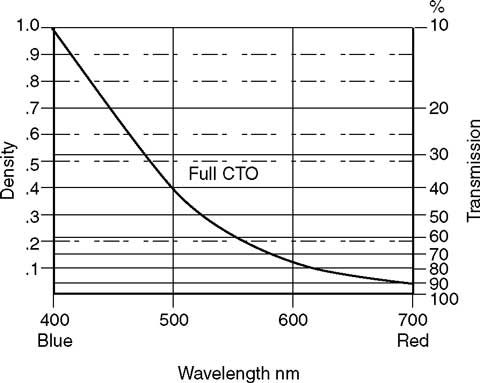
Figure 6.5 Filter characteristics for full colour temperature orange (CTO)
Note the transmission of a full CTO (full orange) is 55%, significantly more than a full blue. When using CTO filters on ‘in-shot’ windows, the filter must be placed on the outside of the window, otherwise the window glazing bars will be changed in colour by the filter. With large plate windows it may be possible to squeegee the filter onto the window. Ideally the CTO filters should be stapled to wooden frames and wedged in place. Care should be taken to avoid any wrinkles in the filter as these will cause reflection of lights. Acrylic filters, 3 mm thick, are available which overcome the problem of maintaining a rigid, wrinkle-free filter. These are more expensive than the normal flexible filters (polyester).
It should be noted that average summer sunlight (5500 K) is an ‘average’. There will be occasions when the daylight colour temperature is higher than this value and any additional artificial lighting will need to be corrected to a higher value. This is a situation where an HMI/MSR source may require, say, ¼CTB to match with daylight.
Similarly, on a winter’s day with a low-elevation sun, an HMI/MSR may require a ¼CTO to make a good match to the daylight. In both these cases it will be fairly obvious by eye that there is a need for correction to be applied to the artificial sources.
Filters are also available for correcting CSI/CID and HMI sources to tungsten lighting. When required to obtain an accurate match between two sources the procedure illustrated in Figure 6.6 is recommended.
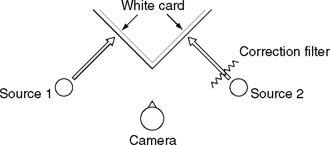
Figure 6.6 Method for matching two light sources
6.3 Mired
Often it is required to estimate which filter to use for a particular application. Unfortunately the change in colour temperature produced with a particular filter is not a constant value. It depends on the starting colour temperature; the higher the starting colour temperature, the greater will be the change.
A full colour temperature blue filter causes a bigger change on a 4000 K source than a 2800 K source, i.e.
2800 K + full blue = 4600 K (2000 K shift)
3200 K + full blue = 5700 K (2500 K shift)
4000 K + full blue = 8850 K (4800 K shift)
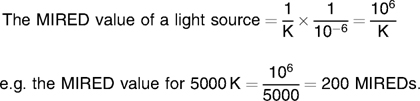
Fortunately it is possible to predict the effect of a filter by using the concept of MIREDs. These are based on the observation that a given filter causes a constant shift in the reciprocal value of the colour temperature of a light source. However, the reciprocal value of a colour temperature will give a very small number, so to make the numbers easier to handle we take a millionth of the colour temperature (its ‘micro’ value), hence MIREDs where MIRED stands for MIcro REciprocal Degree.
Manufacturers quote the MIRED shift for all colour temperature correction filters, CTB filters reduce the MIRED value of the colour temperature and therefore have a negative sign (Table 6.3).
Table 6.3 MIRED shift of CTB/CTO filters
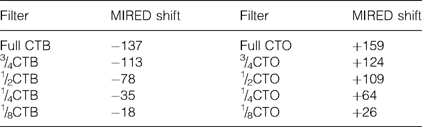
Note: A word of caution: the description FULL, ¾, ½ etc. is a very loose description. The addition of 2 fractional filters to make up a filter usually produces a larger MIRED shift, e.g. 2 × ½CTB = –156 MIREDs, 19 MIREDs away from a FULL CTB filter. Similarly 2 × ½CTO = +218.
Using this concept we can estimate the filter required to cause a particular change in colour temperature, or predict the new colour temperature when using a particular filter.
What filter is required to simulate Moonlight (4100 K) when using a 3200 K Tungsten source?

Required MIRED shift = –69, i.e. ½CTB (–78 MIREDs)
Note that the tolerances of 3200 K ± 150 K and 5500 K ± 400 K, discussed earlier, represents a MIRED shift of approximately 14 MIREDs, consequently use of the ½CTB filter would be within this tolerance.
Example 2
What is the new colour temperature if a ¾CTO is used on a 3200 K source?
![]()
MIRED shift of ¾CTO = +124
New MIRED value = 436
![]()
i.e. a colour temperature shift of 900 K.
Note the difference in colour temperature shift if used on a 5000 K light source:
MIRED shift of ¾CTO = 124
New MIRED value = 324
![]()
i.e. a colour temperature shift of 1914K.
This confirms the opening statement: the higher the initial colour temperature, the greater the effect of a colour temperature correction filter.
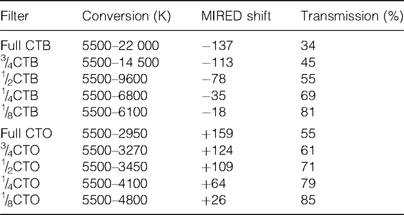
Note: There can be slight colour differences between filter batches and between manufacturers. Colour temperature correction filters are often used to create appropriate lighting effects, e.g. moonlight, sunset etc. Tables 6.4–6.6 give the appropriate colour temperature change introduced when using them.
Table 6.4 Tungsten light conversion
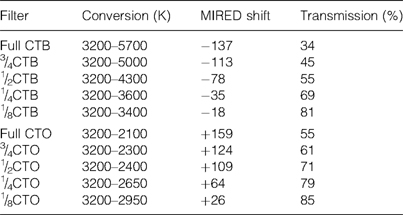
Table 6.5 Daylight conversionFilterConversion
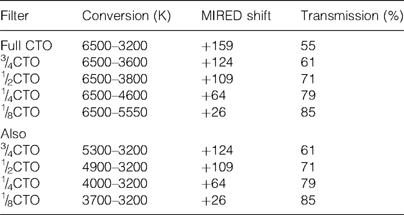
Table 6.6 Average summer sunlight conversion
- Beware of using filters in combination on luminaires. The heat absorbed by the filters becomes trapped between them, resulting in a short filter life.
- When using diffusion and correction filters, always use the correction filter on the outside of the diffusion. This is to allow the heat absorbed in the filter to dissipate. Placed inside the diffusion it will result in a shorter life due to the trapped heat.
6.4 Change of Camera White Point
Colour temperature correction filters may be used to change the white balance or white point on the camera. For example, to have warmer pictures, say in a tungsten-lit scene, rather than putting ¼CTO filters on all the light sources, simply move the white point to ¼CTB by holding a ¼CTB filter over the lens at the time of white balancing the camera. A 3200 K lit scene would then look warm, only scene elements lit with 3600 K (3200 K + ¼CTB) would look ‘normal’ (Figure 6.7).
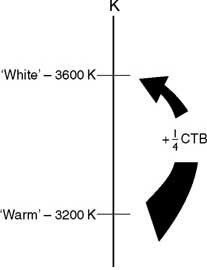
Figure 6.7 Change of ‘white’ point
The MIRED scale is approximately linear in its perceived effect (for sources of greater than 1800 K). So if one wished to have twice the effect of a certain filter, say +50 MIREDs, a filter with a + 100 MIRED shift would be used.
Note that colour temperature correction filters may be used in combination. Simply add the MIRED shift of each filter to determine the effect of a combination, and multiply the transmission factors to determine the overall transmission, e.g.
½CTB + ½CTB = full CTB
(–78) + (–78) = –156 MIREDs
Note that this is about 19 MIREDs greater than a full CTB (–137), i.e. a noticeable departure from average daylight. Some cameramen only carry ½CTB as a compromise on correction/ transmission; this is usually satisfactory, but be aware of the overcorrection when used together to produce full CTB. Similarly, overall transmission factor = 0.55 × 0.55 = 0.30, i.e. 30% transmission.
6.5 Colour Temperature Measurement
Colour temperature meters fall into two basic categories:
- Simple meters which base their measurement on the smooth spectral energy distribution curve for incandescent sources and make two comparison measurements, one in the blue end of the spectrum and one in the red end of the spectrum (Figure 6.8, page 60).
Note: (a) The curves are continuous and smooth.
(b) Relative decrease in red radiation and relative increase in blue radiation as colour temperature is increased.
(c) Within the visible spectrum the radiation curves are almost linear
Figure 6.8 Relative spectral energy distribution for incandescent sources.
- Digital meters which calculate the colour temperature from the analysis of the light source with three photocells, each filtered to examine a different part of the spectrum, e.g. Minolta Chroma Meter, Thoma TF5 Colormeter.
Digital meters may also have the facility to measure the actual chromaticity (colour) of the light source, e.g. Minolta Chroma Meter, Thoma TF5 Colormeter. Colour cameras also have a colour temperature indicator, generally not as accurate as the meters.
CIE Chromaticity Chart
The basic principle of colour synthesis using three suitable colours (R, G and B) has already been discussed. Using this system we can specify a particular colour in terms of R, G and B. However, this would only apply to colours that fall within the triangle. In practice, many colours in the real world, especially saturated and spectral colours, fall outside this basic triangle and require the use of negative values to specify them. The CIE, in 1931, introduced the CIE Chromaticity Chart using very special ‘primary’ colours. These are super saturated primaries, and do not exist in practice, but as a mathematical concept enable a colour to be specified in terms of X, Y and Z instead of RGB. The triangle produced by these three primaries embraces all known colours, including spectral colours. In this system, the three coefficients x, y and z are equated to 1, so only two coefficients are required to specify a particular colour; hence the ‘triangle’ can be redrawn as a right-angled triangle using coefficients of x and y only to plot a particular colour. If x and y are zero, then the coordinates 0, 0 must indicate z = 1, so the diagram represents all three ‘primaries’ (Figures 6.9 and 6.10).
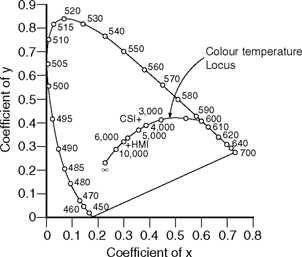
Figure 6.9 The CIE Chromaticity Diagram
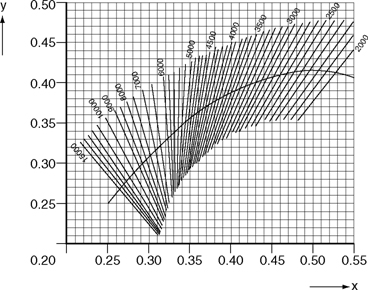
Figure 6.10 CIE diagram showing isotemperature lines
Chroma Meters, such as the Minolta Meter, include a plastic card showing the CIE diagram and the locus of the ‘black-body radiator’ (colour plot of increasing colour temperature for a ‘full’ radiator). This can be used to plot values of x and y if required. An enlarged version of the ‘black-body locus’ is included on the reverse of the plastic card for checking correlated colour temperature.
The Thoma Colormeter TF5 is similar to the Minolta but has more facilities, i.e. as well as measuring colour temperature it also indicates departures from the ‘ideal colour temperature curve’, plus chromaticity in u, v and u′, v′ terms.
When measuring ‘spikey’ light sources the fact that meters are calibrated against a continuous, smooth incandescent source can lead to measurement errors. The Thoma Colormeter TF5 is recommended by a leading light source manufacture for measuring discharge lights.
The important point to remember is to test any light source combination plus corrections on-camera – do not rely totally on meters!
6.6 Correlated Colour Temperature and Colour Compensating Filters
Strictly speaking, the term ‘colour temperature’ should only be used for incandescent sources, i.e. sources which are glowing by virtue of their temperature – sun, tungsten, tungsten halogen, carbon arc, oil lamps, candles.
The shape of the spectral energy distribution for these sources is very similar to that of a full radiator (poker), and a good ‘match’ can be made. Light sources which produce light from an electrical discharge tend to have a ‘spiky’ spectrum and may not give a good match to a full radiator (incandescent source), e.g.
| Fluorescent sources | |
| Low-pressure sodium | |
| High-pressure sodium | |
| High-pressure mercury | CSI |
| CID | |
| HMI | |
| MSR | |
| Xenon | |
| CDM |
There is, however, still a need to be able to describe the white point of such sources. This is done by quoting the correlated colour temperature for each source. This is the colour temperature which best describes the colour, i.e. looks closest to the colour. The term ‘correlated’ is dropped in everyday usage.
The CIE Chromaticity Chart can be used to determine the correlated colour temperature by plotting the value of x and y for non-incandescent sources and reading off the lines of isotemperature curves.
This is also a useful guide to the need for correction. Correction in the blue–orange direction has been discussed. However, few discharge sources will plot exactly on the colour temperature ‘locus’, they will plot either side of the locus representing a green or magenta bias (Figure 6.11).
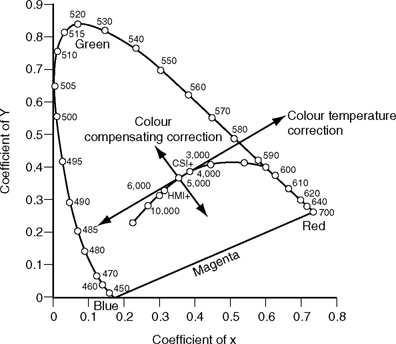
Figure 6.11 The colour correction ‘axis’ for correction filters
Colour compensating filters are used to provide the required correction in the magenta or green direction (Table 6.7) to help correct a discharge source onto the colour temperature locus, or simply to make correction between two discharge sources, say HMIs, to achieve a good colour ‘match’! See Figure 6.12.
Table 6.7 Colour compensating filters
| Filter | Value |
| Plus Green | CC 30 Green |
| Half Plus Green | CC 15 Green |
| Quarter Plus Green | CC 075 Green |
| Eight Plus Green | CC 0375 Green |
| Minus Green | CC 30 Magenta |
| Half Minus Green | CC 15 Magenta |
| Quarter Minus Green | CC 075 Magenta |
| Eight Minus Green | CC 00375 Magenta |
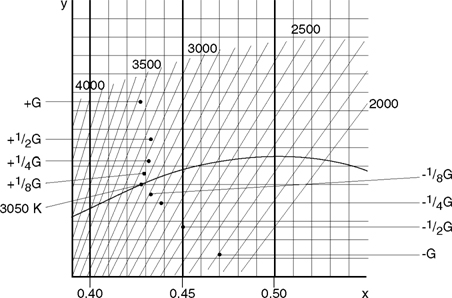
Note change in colour temperature as well as movement in the GreenIMagenta axis. Filter applied to a 3050k source.
Figure 6.12 Effect of colour compensating filters (on a tungsten source)
Meters are available which can measure the green/magenta error, in addition to providing an indication of the blue–orange correction required – usually specified in MIREDs, e.g. Minolta Colour Meter III. Note the observations made on measuring non-incandescent sources also apply – always check light source/filter combinations on camera!
6.7 Neutral Density Filters
Neutral density filters (ND filters) have very little colour bias and simply reduce the light equally throughout the spectrum (Figure 6.13).
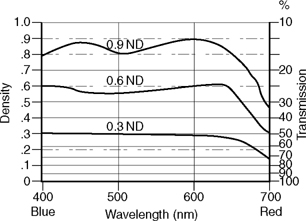
Figure 6.13 Characteristics of typical ND filters
The density of a filter is given by the formula:
![]()
For a filter with a 50% transmission or 0.5 transmission factor,
![]()
It is useful to think of the change in exposure introduced by an ND filter in terms of f-stops. The 0.3 ND filter would therefore introduce a one f-stop loss.
A range of ND filters is available (Table 6.8). Note that ND filters may be used in combination, e.g. 0.3 + 0.6 = 0.9 ND.
Table 6.8 Properties of ND filters
| Neutral density (ND) | Transmission (%) | Loss in f-stops |
| 0.15 | 70 | ½ stop |
| 0.3 | 50 | 1 stop |
| 0.6 | 25 | 2 stops |
| 0.9 | 12.5 | 3 stops |
| 1.2 | 6.25 | 4 stops |
The density scale is obviously a logarithmic scale so equal changes in density are perceived equally by the eye/brain, i.e. 0.3, 0.6, 0.9, 1.2.
Neutral density filters may be used:
- on windows, to reduce contrast between interior and exterior scenes
- on cameras, to adjust camera sensitivity as required, i.e. to help with excessive illuminance levels and/or help to work at wide apertures for depth-of-field considerations
- on luminaires, to assist in obtaining an appropriate lighting balance.
Neutral density filters are also available as 3 mm thick acrylic sheets (6 ft × 8 ft). These have the advantage of being completely rigid and therefore do not flap about in the wind or buckle.
Camera manufacturers use a different method for describing the neutral density filters used in camera filter wheels, i.e.
¼ND is used to indicate a transmission of ¼ or 25% (2-stop loss) – filter position 2
![]() ND is used to indicate a transmission of
ND is used to indicate a transmission of ![]() or 6.25% (4-stop loss) – filter position 4
or 6.25% (4-stop loss) – filter position 4
Neutral Density in Combination
Combination filters are available which provide full CTO correction and ND, e.g.
[0.3 ND + full CTO] provides 1½ stops of light loss
[0.6 ND + full CTO] provides 2½ stops of light loss
Note: When using diffusion and ND filters in combination always put the ND on the outside of the diffusion to avoid the ND filter becoming excessively hot.