
Chapter 8: Introducing Printing, Plotting, and Layouts
Getting hard-copy output from AutoCAD is something of an art. You’ll need to be intimately familiar with both your output device and the settings available in AutoCAD. You’ll probably spend a good deal of time experimenting with AutoCAD’s plotter settings and with your printer or plotter to get your equipment set up just the way you want.
With the huge array of output options available, this chapter can provide only a general discussion of plotting and printing. As a rule, the process for using a plotter isn’t much different from that for a printer; you just have more media-size options with plotters. Still, every output device is different. It’s up to you to work out the details and fine-tune the way you and AutoCAD together work with your particular plotter or printer. This chapter describes the features available in AutoCAD and discusses some general rules and guidelines to follow when setting up your plots.
I’ll start with an overview of the plotting features in AutoCAD and then delve into the finer details of setting up your drawing and controlling your plotter or printer.
In this chapter, you’ll learn to do the following:
- Understand the plotter settings
- Use layout views for WYSIWYG plotting
- Add an output device
- Store a page setup
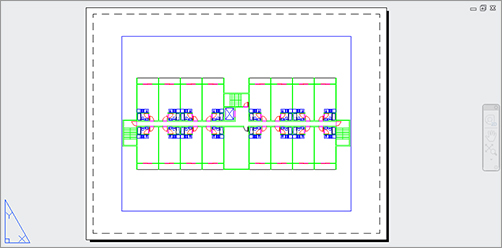
To see firsthand how the Plot command works, you’ll plot the Plan file by using the default settings on your system. You’ll start by getting a preview of your plot, before you commit to printing your drawing. As an introduction, you’ll plot from the Model view of an AutoCAD drawing, but be aware that typically you should plot from a layout view. Layout views give you a greater degree of control over how your output will look. You’ll be introduced to layout views later in this chapter. Now let’s get started!
First, try plotting your drawing to no particular scale:
1. Be sure your printer or plotter is connected to your computer and is turned on.
2. Start AutoCAD, and open the Plan.dwg file.
3. Click All from the Zoom flyout in the View tab’s Navigate panel or type Z↵A↵ to display the entire drawing.
4. Click the Plot tool from the Quick Access toolbar to open the Plot dialog box (Figure 8-1).
Figure 8-1: The Plot dialog box
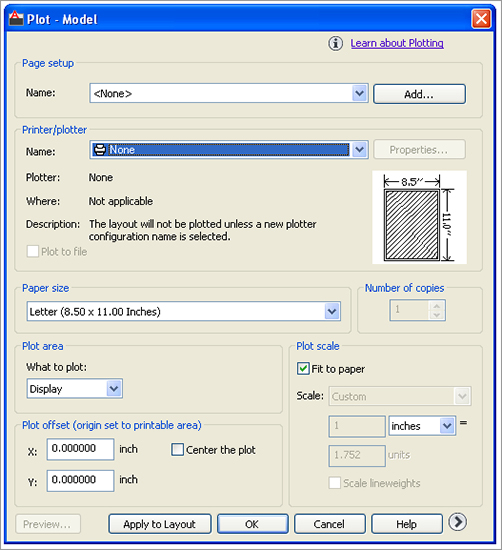
5. If the Name option in the Printer/Plotter group shows None, click the drop-down arrow and select your current Windows system printer.
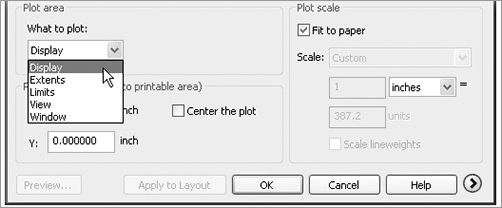
6. In the Plot Area group, make sure the Display option is selected in the drop-down list (Figure 8-2). This tells AutoCAD to plot the drawing as it looks in the drawing window. You also have the option to plot the limits of the drawing or to select an area to plot with a window. In addition, you can choose to plot the extents of a drawing or a saved view.
Figure 8-2: Choose the Display option.
7. Make sure the Fit To Paper option is selected in the Plot Scale group.
8. Click the Preview button in the lower-left corner of the dialog box. AutoCAD works for a moment and then displays a sample view of how your drawing will appear when printed. Notice that the view also shows the Zoom Realtime cursor. You can use the Zoom/Pan Realtime tools to get a close-up of your print preview.
9. Go ahead and plot the file: Right-click and choose Plot from the shortcut menu. AutoCAD sends the drawing to your printer.
10. Your plotter or printer prints the plan to no particular scale.
You’ve just plotted your first drawing to see how it looks on paper. You used the minimal settings to ensure that the complete drawing appears on the paper.
You may notice that a message bubble appears in the lower-right corner of the AutoCAD window (Figure 8-3). If you click the text that reads Click to view plot and publish details, the Plot And Publish Details dialog box opens to display some detailed information about your plot.
Figure 8-3: Click the message text to open the Plot And Publish Details dialog.
As you become more experienced with AutoCAD and your projects become more demanding, the information presented in the Plot And Publish Details dialog box may be useful to you. For now, make a mental note that this information is available should you need it.
Set the Appropriate Units
It’s important to make sure you use the appropriate unit settings in this chapter. If you’ve been using the metric measurements for previous exercises, make sure you use the metric settings in the exercises of this chapter; otherwise, your results won’t coincide.
Next, try plotting your drawing to an exact scale. This time, you’ll expand the Plot dialog box to show a few more options:
1. In the status bar, click the Annotation Scale tool and select 1⁄16´ = 1´-0˝ from the flyout.
2. Click Plot from the Quick Access toolbar again to open the Plot dialog box. If the Name option in the Printer/Plotter group shows None, click the drop-down arrow and select your current Windows system printer.
3. Click the More Options button; this is the round button with the > symbol in the lower-right corner of the dialog box. You’ll see some additional options appear on the right side of the dialog box (Figure 8-4).
Figure 8-4: Open the additional options on the right.

4. If your last printout wasn’t oriented on the paper correctly, select the Landscape option in the Drawing Orientation group.
Print Preview Dependencies
The appearance of the print preview depends on the type of output device you chose when you installed AutoCAD or when you last selected a Plotter Device option (described in the section “WYSIWYG Plotting Using Layout Views” later in this chapter). The print preview is also affected by other settings in the Plot dialog box, such as those in the Drawing Orientation, Plot Offset, and Plot Area groups. This example shows a typical preview view using the Windows default system printer in landscape mode.
5. In the Plot Scale group, clear the Fit To Paper check box. Then, select 1⁄16´ = 1´-0˝ from the Scale drop-down list. Metric users should select 1:20. As you can see, you have several choices for the scale of your output.
6. In the Paper Size group, select Letter. Metric users should select A4. The options in this drop-down list depend on your Windows system printer or the output device you configured for AutoCAD.
7. In the Plot Area group, select Limits from the drop-down list. This tells AutoCAD to use the limits of your drawing to determine which part of your drawing to plot.
8. Click the Preview button again to get a preview of your plot.
9. Right-click, and choose Plot from the shortcut menu. This time, your printout is to scale.
Here, you were asked to specify a few more settings in the Plot dialog box. Several settings work together to produce a drawing that is to scale and that fits properly on your paper. This is where it pays to understand the relationship between your drawing scale and your paper’s size, discussed in Chapter 3. You also saw how you can expand the options in the Plot dialog box.
The following sections are lengthy but don’t contain any exercises. If you prefer to continue with the exercises in this chapter, skip to the section “WYSIWYG Plotting Using Layout Views.” Be sure to come back and read the following sections while the previous exercises are still fresh in your mind.
Understanding the Plotter Settings
In the following sections, you’ll explore all the settings in the Plot dialog box. These settings give you control over the size and orientation of your image on the paper. They also let you control which part of your drawing gets printed. All these settings work together to give you control over how your drawing fits on your printed output.
AutoCAD Remembers Plotter Settings
AutoCAD 2011 relies mainly on the Windows system printer configuration instead of its own plotter drivers. However, It does remember printer settings that are specific to AutoCAD, so you don’t have to adjust your printer settings each time you use AutoCAD. This gives you more flexibility and control over your output. Be aware that you’ll need to understand the Windows system printer settings in addition to those offered by AutoCAD.
Paper Size
You use the option in this group to select the paper size for your output. You can select a paper size from the Paper Size drop-down list. These sizes are derived from the sizes available from your currently selected system printer. You’ll find out how to select a different printer later in this chapter.
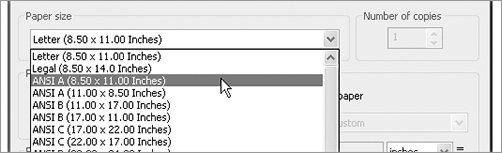
AutoCAD 2011 offers sheet sizes in both Imperial and metric measurements in the Paper Size group. AutoCAD assumes that if you pick a metric sheet size such as A4 or A5, you’ll want the sheet dimensions specified in metric measurements, and it adjusts the dialog box settings accordingly.
Drawing Orientation
When you used the Preview button in the first exercise in this chapter, you saw your drawing as it would be placed on the paper. In that example, it was placed in a landscape orientation, which places the image on the paper so that the width of the paper is greater than its height. You can rotate the image on the paper 90° into what is called a portrait orientation by selecting the Portrait radio button in the Drawing Orientation group. A third option, Plot Upside-Down, lets you change the orientation further by turning the landscape or portrait orientation upside down. These three settings let you print the image in any one of four orientations on the sheet.
In AutoCAD, the preview displays the paper in the orientation it’s in when it leaves the printer. For most small-format printers, if you’re printing in the portrait orientation, the image appears in the same orientation you see when you’re editing the drawing. If you’re using the landscape orientation, the preview image is turned sideways. For large-format plotters, the preview may be oriented in the opposite direction. The graphic in the Drawing Orientation group displays a capital A on a sheet showing the orientation of your drawing on the paper output.
Remember that you need to click the More Options button in the lower-right corner of the Plot dialog box to access the Drawing Orientation group. The More Options button looks like a circle with a greater-than sign. You can also press Alt+Shift+>.
Plot Area
The What To Plot drop-down list in the Plot Area group lets you specify which part of your drawing you want to plot. You may notice some similarities between these settings and the Zoom command options. Each Plot Area option is described next. Most of these options are used only in a Model view. Typically, when plotting from a layout view, you’ll use the Layout option.
Limits The Limits option (available in Model Space only) uses the limits of the drawing to determine the area to print. If you let AutoCAD fit the drawing onto the sheet (by selecting the Fit To Paper check box in the Plot Scale group), the plot displays exactly the same image that you would see on the screen if you selected Zoom All from the Zoom flyout on the navigation bar.
Layout The Layout option (available in layout views only) replaces the Limits option when you plot from a layout view. (See the section “WYSIWYG Plotting Using Layout Views” later in this chapter.) This option plots everything displayed within the paper margins shown in the layout view. Typically, this is the only option you’ll use when printing from a layout.
Extents The Extents option uses the extents of the drawing to determine the area to print. If you let AutoCAD fit the drawing onto the sheet (by selecting the Fit To Paper check box in the Plot Scale group), the plot displays exactly the same image that you would see on the screen if you chose the Zoom Extents tool from the Zoom flyout in the navigation bar.
Display Display is the default option; it tells AutoCAD to plot what is currently displayed on the screen. If you let AutoCAD fit the drawing onto the sheet (that is, you select the Fit To Paper check box from the Plot Scale group), the plot is exactly the same as what you see on your screen, adjusted for the width and height proportions of your display.
View The View option is available when you’ve saved a view in the drawing by using the View command. When you select View from the What To Plot drop-down list, another drop-down list appears, offering a list of views available in the drawing. You can then select the view that you want to plot. If you let AutoCAD fit the drawing onto the sheet (by selecting Fit To Paper from the Plot Scale group), the plot displays exactly the same thing that you would see on the screen if you recalled the view you’re plotting. Objects that don’t appear in the view are clipped in the plotted view.
Getting a Blank Plot?
Do you get a blank printout even though you selected Extents or Display? Chances are the Fit To Paper check box isn’t selected, or the Inches = Units (mm = Units for metric users) setting is inappropriate for the sheet size and scale of your drawing. If you don’t care about the scale of the drawing, make sure the Fit To Paper option is selected. Otherwise, make sure the Plot Scale settings are set correctly. The next section describes how to set the scale for your plots.
Window The Window option enables you to use a window to indicate the area you want to plot. Nothing outside the window prints. To use this option, select it from the drop-down list. The Plot dialog box temporarily closes to allow you to select a window. After you’ve done this the first time, a Window button appears next to the drop-down list. You can click the Window button and then indicate a window in the drawing area or AutoCAD will use the last indicated window. If you use the Fit To Paper option in the Plot Scale group to let AutoCAD fit the drawing onto the sheet, the plot displays exactly the same thing that you enclose in the window.
Plot Scale
In the previous section, the descriptions of several Plot Area options indicate that the Fit To Paper option can be selected. Bear in mind that when you instead apply a scale factor to your plot, it changes the results of the Plot Area settings and some problems can arise. This is where most new users have difficulty.
For example, the apartment plan drawing fits nicely on the paper when you use Fit To Paper. But if you try to plot the drawing at a scale of 1˝ = 1´, you’ll probably get a blank piece of paper because, at that scale, hardly any of the drawing fits on your paper. AutoCAD will tell you that it’s plotting and then tell you that the plot is finished. You won’t have a clue as to why your sheet is blank.
If an image is too large to fit on a sheet of paper because of improper scaling, the plot image is placed on the paper differently, depending on whether the plotter uses the center of the image or the lower-left corner for its origin. Keep this in mind as you specify scale factors in this area of the dialog box.
Scale
You can select a drawing scale from a set of predefined scales in the Scale drop-down list. These options cover the most common scales you’ll need to use.
You’ve already seen how the Fit To Paper option enables you to avoid giving a scale and forces the drawing to fit on the sheet when you’re plotting from the Model view. This works fine if you’re plotting illustrations that aren’t to scale. If you select another option, such as 1⁄8˝ = 1´-0˝, the inches and units input boxes change to reflect this scale. The Inches = input box changes to 0.125, and the Units input box changes to 12.
If you’re plotting from a layout, you’ll use the 1:1 scale option or perhaps a 1:2 scale if you’re plotting a half-size drawing. In a layout, the drawing scale is typically set up through the viewport. While you’re plotting from a layout, AutoCAD automatically determines the area to plot based on the printer and sheet size you select. For more information, see “WYSIWYG Plotting Using Layout Views” later in this chapter.
Custom Scale
In some cases, you may need to set up a nonstandard scale (not shown in the drop-down list) to plot your drawing. If you can’t find the scale you want in the Scale drop-down list, you can select Custom and then enter custom values in the Inches or mm and Units input boxes.
Through these input boxes, you can indicate how the drawing units in your drawing relate to the final plotted distance in inches or millimeters. For example, if your drawing is of a scale factor of 96, follow these steps:
1. In the Plot Scale group of the Plot dialog box, double-click the Inches = input box, enter 1, and press the Tab key.
2. Double-click the Units input box, enter 96, and press the Tab key.
Metric users who want to plot to a scale of 1:10 should enter 1 in the mm input box and 10 in the Units input box.
If you’re more used to the Architectural unit style in the Imperial measurement system, you can enter a scale as a fraction. For example, for a 1⁄8˝ scale drawing, do this:
1. Double-click the Inches = input box, enter 1/8, and press the Tab key.
2. Double-click the Units input box, enter 12, and press the Tab key.
If you specify a different scale than the one you chose while setting up your drawing, AutoCAD plots your drawing to that scale. You aren’t restricted in any way as to scale, but entering the correct scale is important: If it’s too large, AutoCAD will think your drawing is too large to fit on the sheet, although it will attempt to plot your drawing anyway. See Chapter 3 for a discussion of unit styles and scale factors.
Don’t Forget Your Annotation Scale
You may see a message saying that the “annotation scale is not equal to the plot scale” when you attempt to plot your drawing. You can click Continue at the message and your drawing will still be plotted to the scale you specify. If you are using any text or blocks that use the annotation scale feature, those items will be plotted at the Annotation scale setting for the Model view or layout you are trying to plot. See Chapter 4 for more on Annotation scale.
If you plot to a scale that is different from the scale you originally intended, objects and text appear smaller or larger than is appropriate for your plot. You’ll need to edit your text size to match the new scale. You can do so by using the Properties palette. Select the text whose height you want to change, right-click and choose Properties from the shortcut menu, and then change the Height setting in the Properties palette.
Adding a Custom Scale to the Scale Drop-Down List
If you use a custom scale frequently, you may find it annoying to have to input the scale every time you plot. AutoCAD offers the ability to add your custom scale to the Scale drop-down list shown earlier. You can then easily select your custom scale from the list instead of entering it through the text box.
Here are the steps you use to add a custom scale to the Scale drop-down list:
1. Choose Options from the Application menu to open the Options dialog box.
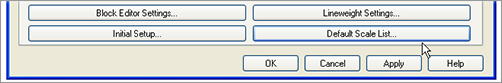
2. Select the User Preferences tab, and then click the Default Scale List button at the bottom of the dialog box.
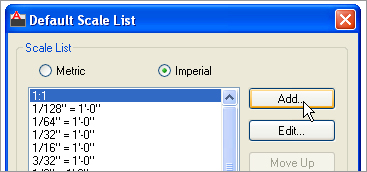
3. In the Default Scale List dialog box, click the Add button.
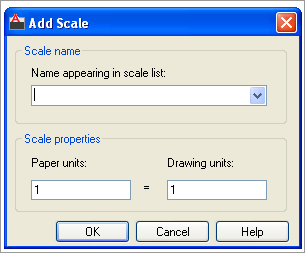
4. In the Add Scale dialog box, enter a name for your custom scale in the Name Appearing In Scale List text box, and then enter the appropriate values in the Scale Properties text boxes.
5. Click OK in each dialog box to close it.
There are several options besides Add in the Default Scale List dialog box. Clicking the Edit button lets you edit an existing scale in the list. Clicking the Move Up and Move Down buttons lets you change the location of an item in the list. Clicking Delete deletes an item or a set of items from the list. Clicking the Reset button restores the list to its default condition and removes any custom items you may have added.
Shortcut to the Edit Scale List Dialog Box
Instead of opening the Options dialog box and clicking Default Scale List on the User Preferences tab, you can enter Scalelistedit↵ at the Command prompt to open the Edit Drawing Scales dialog box directly.
Scale Line Weights
AutoCAD offers the option to assign line weights to objects either through their layer assignments or by directly assigning a line weight to individual objects. The line weight option, however, doesn’t have any meaning until you specify a scale for your drawing. After you specify a scale, the Scale Lineweights option is available. Select this check box if you want the line weight assigned to layers and objects to appear correctly in your plots. You’ll get a closer look at line weights and plotting later in this chapter.
Shaded Viewport Options
Most of your plotting will probably involve 2D technical line drawings, but occasionally you may need to plot a shaded or rendered 3D view. You may need to include such 3D views combined with 2D or 3D Wireframe views. AutoCAD offers the Shaded Viewport Options group that enables you to plot shaded or rendered 3D views of your AutoCAD drawing. These options give you control over the quality of your rendered output. (LT users don’t have the Shaded Viewport Options group.)
Remember that you need to click the More Options button in the lower-right corner of the Plot dialog box to get to the Shaded Viewport Options group. The More Options button looks like a circle with a greater-than sign. You also need to select a printer name in the Printer/Plotter group before these options are made available.
Shade Plot
The Shade Plot drop-down list lets you control how a Model Space view or layout is plotted. You can choose from the following options:
As Displayed plots the Model Space view as it appears on your screen.
Legacy Wireframe plots the Model Space view of a 3D object as a Wireframe view.
Legacy Hidden plots your Model Space view with hidden lines removed.
Conceptual/Hidden/Realistic... plots the Model Space using one of several visual styles. These selections override the current Model Space visual style. See Chapter 21 for more on visual styles.
Rendered renders your Model Space view before plotting (see Chapter 23 for more on rendered views).
Draft/Low/Medium/High/Presentation sets the quality of the plot.
The Shade Plot options aren’t available if you’re plotting from a layout view. You can control the way each layout viewport is plotted through the viewport’s Properties settings. You’ll learn more about layout viewport properties later in this chapter.
Quality and DPI
The Quality drop-down list determines the dots per inch (dpi) setting for your output. These options aren’t available if you select Legacy Wireframe or Legacy Hidden from the Shade Plot drop-down list:
Draft plots 3D views as wireframes.
Preview offers 150dpi resolution.
Normal offers 300dpi resolution.
Presentation offers 600dpi resolution.
Maximum defers dpi resolution to the current output device’s settings.
Custom lets you set a custom dpi setting. When Custom is selected, the DPI input box is made available for your input.
If some of the terms discussed for the Shaded Viewport Options group are unfamiliar, don’t be alarmed. You’ll learn about 3D Shaded and Rendered views in Part 4 of this book. When you start to explore 3D modeling in AutoCAD, come back and review the Shaded Viewport Options group.
Plot Offset
Sometimes, your first plot of a drawing shows the drawing positioned incorrectly on the paper. You can fine-tune the location of the drawing on the paper by using the Plot Offset settings. To adjust the position of your drawing on the paper, enter the location of the view origin in relation to the plotter origin in X and Y coordinates (see Figure 8-5).
Figure 8-5: Adjusting the image location on a sheet
For example, suppose you plot a drawing and then realize that it needs to be moved 1˝ to the right and 3˝ up on the sheet. You can replot the drawing by making the following changes:
1. Double-click the X input box, type 1, and press the Tab key.
2. Double-click the Y input box, type 3, and press the Tab key.
Now proceed with the rest of the plot configuration. With the preceding settings, the image is shifted on the paper exactly 1˝ to the right and 3˝ up when the plot is done.
You can also tell AutoCAD the location from which the offset is to occur. The Plot And Publish tab of the Options dialog box (choose Options from the Application menu) offers the Specify Plot Offset Relative To button group. This group offers two radio buttons: Printable Area and Edge Of Paper. You can select the option that makes the most sense for you.
Plot Options
The options in the Plot Options group offer a greater amount of control over your output and require some detailed instruction. Here is a brief description of these options. You’ll learn more about them in the next section.
Plot in Background
If you think your plot will take some time to complete, this option plots your drawing in the background so that after you begin a plot you can immediately return to your drawing work. You can also control this option through the Backgroundplot system variable.
Plot Object Line Weights
As mentioned earlier, AutoCAD lets you assign line weights to objects either through their layer assignment or by assigning them directly. If you use this feature in your drawing, this option lets you turn line weights on or off in your output.
Plot With Transparency
You can apply a transparency of objects and layers in your drawing. This option lets you control whether transparency is used when your drawing is plotted.
Plot with Plot Styles
Plot styles give you a high degree of control over your drawing output. You can control whether your output is in color or black and white, and you can control whether filled areas are drawn in a solid color or a pattern. You can even control the way lines are joined at corners. You’ll learn more about these options and how they affect your work in the next chapter.
Plot Paperspace Last
When you’re using a layout view, otherwise known as Paper Space, this option determines whether objects in Paper Space are plotted before or after objects in Model Space. You’ll learn more about Model Space and Paper Space later in this chapter.
Hide Paperspace Objects
This option pertains to 3D models in AutoCAD. When you draw in 3D, you can view your drawing as a Wireframe view. In a Wireframe view, your drawing looks like it’s transparent even though it’s made up of solid surfaces. Using hidden-line removal, you can view and plot your 3D drawings so that solid surfaces are opaque. To view a 3D drawing in the drawing area with hidden lines removed, use the Hide command or use one of the visual styles other than Wireframe. To plot a 3D drawing with hidden lines removed, choose the Hidden option or a visual style from the Shade Plot drop-down list.
Hide Paperspace Objects doesn’t work for views in the Layout viewport described in the next section. Instead, you need to set the viewport’s Shade Plot setting to Hidden. (Click the viewport, right-click, and choose Shade Plot Hidden from the shortcut menu.)
Plot Stamp On
The Plot Stamp feature lets you place pertinent data on the drawing in a location you choose. This includes the drawing name, date and time, scale, and other data. When you click the Plot Stamp On check box to turn on this option, an additional button appears.
Click this button to gain access to the Plot Stamp dialog box (Figure 8-6). This dialog box offers many controls over the plot stamp. It is a fairly extensive tool, so rather than fill this chapter with a description of all its features, see Appendix C for a complete rundown of the Plot Stamp options.
Save Changes to Layout
When this option is turned on, the changes you make to Plot dialog box settings are saved with the current layout. You’ll learn more about layouts in the section “WYSIWYG Plotting Using Layout Views.”
Figure 8-6: The Plot Stamp dialog

Exit Options
The Plot dialog box has the usual OK, Cancel, and Help buttons at the bottom. You’ll also see the Apply To Layout button. This button lets you save the plot settings you make without sending your drawing to the printer or plotter for output. It is convenient for those times when you decide halfway through your plot setup not to plot your drawing.
WYSIWYG Plotting Using Layout Views
So far you’ve done all your work in the Model view, also known as Model Space. There are other views to your drawing that are specifically geared toward printing and plotting. The layout views enable you to control drawing scale, add title blocks, and set up different layer settings from those in the Model view. You can think of the layout views as page-layout spaces that act like a desktop-publishing program.
This section introduces you to layout views as they relate to plotting. You’ll also learn more about layout views in Chapter 16.
You can have as many layout views as you like, each set up for a different type of output. You can, for example, have two or three layout views, each set up for a different scale drawing or with different layer configurations for reflected ceiling plans, floor plans, or equipment plans. You can even set up multiple views of your drawing at different scales in a single layout view. In addition, you can draw and add text and dimensions in layout views just as you would in Model Space.
To get familiar with the layout views, try the following exercise:
1. With the Plan file open, click the Quick View Layouts tool in the status bar (Figure 8-7) and then click the Layout1 preview panel.
Figure 8-7: Choose the Layout1 panel.
Options in the Preview Panel
When you hover over a Quick View Layouts preview panel, you see two icons along the top of the preview. The icon in the upper-left corner enables you to plot a layout. The icon in the upper-right corner enables you to start the Publish feature. See Chapter 29 for more on the Publish feature.
2. Click in the drawing area. A view of your drawing appears on a gray background, as shown in Figure 8-8. This is a view of your drawing as it will appear when plotted on your current default printer or plotter. The white area represents the printer or plotter paper.
Figure 8-8: A view of Layout1
3. Try zooming in and out using the Zoom Realtime tool or the scroll wheel of your mouse. Notice that the entire image zooms in and out, including the area representing the paper.
Layout views give you full control over the appearance of your drawing printouts. You can print a layout view just as you did the view in Model Space.
Let’s take a moment to look at the elements in the Layout1 view. As mentioned previously, the white area represents the paper on which your drawing will be printed. The dashed line immediately inside the edge of the white area represents the limits of your plotter’s margins. Finally, the solid rectangle that surrounds your drawing is the outline of the viewport border. A viewport is an AutoCAD object that works like a window into your drawing from the layout view. Also notice the triangular symbol in the lower-left corner of the view: This is the UCS icon for the layout view. It tells you that you’re currently in layout view space. You’ll see the significance of this icon in the following exercise:
1. Try using a selection window to select the lobby area of your drawing. Nothing is selected.
2. Click the viewport border, which is the rectangle surrounding the drawing, as shown in Figure 8-8. This is the viewport into Model Space. Notice that you can select it.
3. Right-click, and choose Properties from the shortcut menu. You can see from the Properties palette that the viewport is just like any other AutoCAD object with layer, linetype, and color assignments. You can even hide the viewport outline by turning off its layer.
4. Close the Properties palette.
5. With the viewport still selected, click the Erase tool in the Modify toolbar. The view of your drawing disappears with the erasure of the viewport. Remember that the viewport is like a window into the drawing you created in the Model view. After the viewport is erased, the drawing view goes with it.
6. Type U↵ or click the Undo button in the Quick Access toolbar to restore the viewport.
Creating New Viewports
You can create new viewports using the Vports command (the New tool in the View tab’s Viewports panel). See the section “Creating New Paper Space Viewports” in Chapter 16 for more information.
7. Double-click anywhere within the viewport’s boundary. Notice that the UCS icon you’re used to seeing appears in the lower-left corner of the viewport. The Layout UCS icon disappears. The Navigation bar and View Cube also appear inside the viewport.
8. Click the lobby in your drawing. You can now select parts of your drawing.
9. Try zooming and panning your view. Changes in your view take place only within the boundary of the viewport.
10. Click Zoom All from the Zoom flyout in the navigation bar or type Z↵A↵ to display the entire drawing in the viewport.
11. To return to Paper Space, double-click an area outside the viewport. You can also type PS↵ to return to Paper Space or MS↵ to access the space within the viewport.
This exercise shows you the unique characteristics of layout views. The objects in the viewport are inaccessible until you double-click the interior of the viewport. You can then move about and edit your drawing in the viewport, just as you would while in the Model view.
Layout views can contain as many viewports as you like, and each viewport can hold a different view of your drawing. You can size and arrange each viewport any way you like, or you can create multiple viewports, giving you the freedom to lay out your drawing as you would a page in a page-layout program. You can also draw in the layout view or import Xrefs and blocks for title blocks and borders.
Setting Plot Scale in the Layout Viewports
In the first part of this chapter, you plotted your drawing from the Model view. You learned that to get the plot to fit on your paper, you had to either use the Fit To Paper option in the Plot dialog box or indicate a specific drawing scale, plot area, and drawing orientation.
The layout view works in a different way: It’s designed to enable you to plot your drawing at a 1-to-1 scale. Instead of specifying the drawing scale in the Plot dialog box, as you did when you plotted from the Model view, you let the size of your view in the layout view viewport determine the drawing scale. You can set the viewport view to an exact scale by making changes to the properties of the viewport.
To set the scale of a viewport in a layout view, try the following exercise:
1. Press the Esc key to clear any selections. Then, click the viewport border to select it. You’ll see the Viewport Scale tool appear in the status bar.
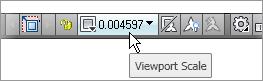
2. Click the Viewport Scale tool and a list of common drawing scales appears (Figure 8-9).
Figure 8-9: Choose a viewport scale.
3. Select 1⁄16˝ = 1´ (metric users should select 1:20). The view in the drawing window changes to reflect the new scale for the viewport. Now most of the drawing fits into the viewport, and it’s to scale. The scale of 1⁄16˝ = 1´ is similar to the metric 1:200 scale, but because you used centimeters instead of millimeters as the base unit for the metric version of the Plan file, you drop the second 0 in 200. The metric scale becomes 1:20.
4. Use the viewport grips to enlarge the viewport enough to display all of the drawing, as shown in Figure 8-10. As you move a corner grip, notice that the viewport maintains a rectangular shape.
Figure 8-10: The enlarged viewport
5. Click Plot from the Quick Access toolbar, and in the Plot dialog box, make sure the Scale option is set to 1:1 and your system printer is selected in the Printer/Plotter group; then click OK. Your drawing is plotted as it appears in the Layout tab, and it’s plotted to scale.
6. After reviewing your plot, close the drawing without saving it.
In step 2, you saw that you can select a scale for a viewport by selecting it from the Viewport Scale option in the status bar. If you look just below the Standard Scale option, you see the Custom Scale option. Both options work like their counterparts, the options in the Plot Scale group in the Plot dialog box.
Layout views and viewports work in conjunction with your plotter settings to give you a better idea of how your plots will look. There are numerous plotter settings that can dramatically change the appearance of your layout view and your plots. In the next section, you’ll learn how some of the plotter settings can enhance the appearance of your drawings. You’ll also learn how layout views can display those settings, letting you see on your computer screen exactly what will appear on your paper output.
This chapter mentioned that you can set up AutoCAD for more than one output device. You can do this even if you have only one printer or plotter connected to your computer. You might want multiple printer configurations in AutoCAD for many reasons. You might want to set up your system so that you can print to a remote location over a network or the Internet. Some printer configurations are strictly file oriented, such as the AutoCAD DWF format for Internet web pages or raster file output. (See Chapter 29 for more on DWF files.)
AutoCAD works best with printers and plotters configured as Windows system devices. Although you can add devices through the AutoCAD Plot Manager, Autodesk recommends that you set up your plotters and printers as Windows devices and then use the System Printer option in AutoCAD to select your output device. (In Windows XP, choose Start Settings Add A Printer to configure a new printer.) You can use the Add-A-Plotter Wizard to create predefined settings for your system printer so that you can quickly choose a printer or plotter setup.
You can also configure additional printers through the AutoCAD Plot Manager; this method also uses the Add-A-Plotter Wizard. Here’s how it’s done:
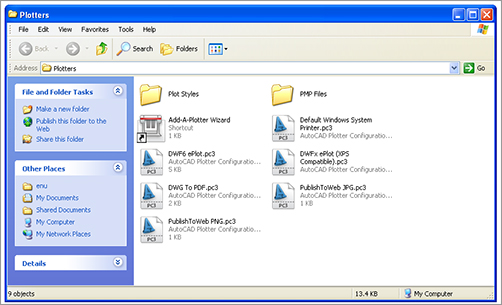
1. Click the Plotter Manager tool on the Output tab’s Plot panel to open the Plotters window (Figure 8-11). Your view of the Plotters window may look a little different, depending on your operating system, but the same basic information is there.
You can also open this window by clicking the Add Or Configure Plotters button in the Plot And Publish tab of the Options dialog box. It’s just an Explorer window showing you the contents of the Plotters folder that is buried in the Documents and Settings folder for your Windows user profile (C:Documents and SettingsUser NameApplication DataAutodeskAutoCAD 2011R18.1enuPlotters, where User Name is your login name).
2. Double-click the Add-A-Plotter Wizard icon to open the Add Plotter dialog box. You see the Introduction screen, which describes the purpose of the wizard.
Figure 8-11: The Plotters window
3. Click Next. The next screen of the wizard lets you select the type of setup you want. You’re offered three options: My Computer, Network Plotter Server, and System Printer. The My Computer and the Network Plotter Server options offer plotter options based on AutoCAD-specific drivers. The main difference between these two options is that the Network Plotter Server option asks you for a network server name. Otherwise, they both offer the same set of options. The System Printer option uses the existing Windows system printer as the basis for the setup.
4. If you click the My Computer radio button and then click Next, you see a listing of plotter models that are supported by AutoCAD directly through AutoCAD’s own drivers. If you use a PostScript device, or if you want to convert drawings to raster formats, this is the place to select those options. You can select the plotter or printer manufacturer name from the Manufacturers list on the left and then select a specific model from the list on the right. If you have a driver for a specific plotter or printer that isn’t listed, you can click the Have Disk button to browse to your driver location.
5. After you’ve made a printer or plotter selection, click Next. You’re then asked if you want to use an existing PCP or PC2 configuration file for the selected plotter. PCP and PC2 configurations files are plotter configuration files from earlier releases of AutoCAD.
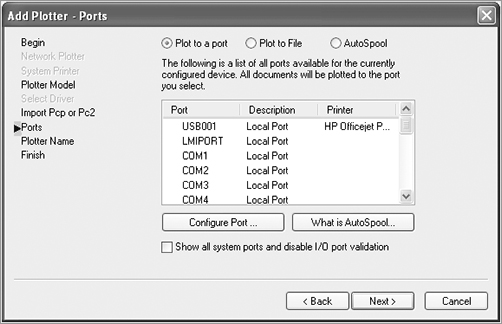
6. Unless you plan to use one of those files, click Next on the Import PCP Or PC2 screen. If you selected My Computer in step 3, the Ports screen opens (Figure 8-12). With the Plot To A Port option selected, you can use the list to select a port to which your printer or plotter is connected. The Configure Port button lets you set up the port if you have a specific requirement for it. If you intend to plot to a file instead of to a port, you can select the Plot To File radio button at the top as an alternative. An AutoSpool option is also offered if your printer requires this feature.
Figure 8-12: The Ports screen of the Add-A-Plotter Wizard
If you selected an option in step 4 that doesn’t require a port setup, click the Next button to skip this option; the Plotter Name screen opens. You can enter a descriptive name in the Plotter Name text box. This name will appear in the Printer Name drop-down list of the Plot Or Page Setup dialog box.
7. Enter a name for this configuration in the space provided, then click Next to open the Finish screen.
8. This screen gives you the option to make adjustments to the configuration you’ve just created by clicking the Edit Plotter Configuration button. Click Finish to exit the Add-A-Plotter Wizard. Your new configuration appears in the Plotters window.
This Edit Plotter Configuration button lets you fine-tune your plotter settings. For example, you can calibrate your plotter for more accurate scaling of your plots, or, if you’re creating a raster file output configuration, you can create a custom page setting for extremely high-resolution raster images.
After you’ve set up a plotter, the plotter information is stored as a file with the .pc3 filename extension in the Plotters folder described earlier.
Editing a Plotter Configuration
In step 8 of the previous exercise, you exited the Add-A-Plotter Wizard without editing the newly created plotter configuration. You can always go back and edit the configuration by opening the Plotters window (choose Plotter Manager on the Output tab’s Plot panel) and double-clicking the configuration you want to edit. You can recognize a plotter configuration file by its .pc3 filename extension.
Most users use their Windows system printer or plotter for other applications besides AutoCAD, and frequently the AutoCAD settings for that printer are different from the settings used for other applications. You can set up AutoCAD to use its own settings automatically so you don’t have to reconfigure your Windows system printer every time you switch applications. To do so, follow these steps:
1. Click the Page Setup Manager tool on the Output tab’s Plot panel to open the Page Setup Manager dialog box.
2. Click the Modify button to open the Page Setup dialog box.
Controlling the Appearance of the Layout Views
The Options dialog box offers a set of controls dedicated to the layout views. If you don’t like some of the graphics in the layout views, you can turn them off. Open the Options dialog box and click the Display tab to see a set of options in the Layout Elements group in the lower-left side of the dialog box.
As you can see, you can control the display of the tabs themselves, the margins, the paper background, and the paper shadow. In addition, you can specify whether AutoCAD automatically creates a viewport or opens the Page Setup dialog box when you open a layout view for the first time.
3. Select the printer that you want to configure in the Name drop-down list of the Printer/Plotter group.
4. Click the Properties button just to the right of the drop-down list to open the Plotter Configuration Editor dialog box. A list box displays all the properties of the printer or plotter. Not all these properties are editable, however. Each time you click a property in the list box, the lower half of the dialog box displays the options associated with that property.
5. Click the Custom Properties item in the list box. The lower half of the dialog box displays the Custom Properties button (Figure 8-13).
Figure 8-13: Click Custom Properties.
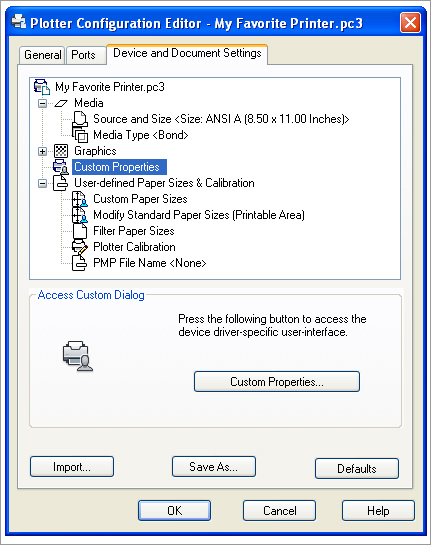
6. Click the Custom Properties button. You’ll see the Windows system printer options. These are the same options you see when you edit the properties of your printer by choosing Start Printers And Faxes or Start Control Panel Printers And Other Hardware.
7. Adjust these settings the way you want them when you plot from AutoCAD, and then click OK.
8. Back in the Plotter Configuration Editor dialog box, click the Save As button. A standard Save As dialog box appears.
9. Enter the name of the plot configuration you’ve set up, or accept the default name, which is usually the name of the Windows printer or plotter, and click Save.
10. Click OK in the Plotter Configuration Editor dialog box, then click OK in the Page Setup dialog box and close the Page Setup Manager.
The Plotter Configuration Editor offers a wide variety of options that are fairly technical in nature. If you want to know more about the Plotter Configuration Editor, see Appendix C.
Plotting Image Files and Converting 3D to 2D
If your work involves producing manuals, reports, or similar documents, you may want to add the Raster File Export option to your list of plotter configurations. The Raster File Export option lets you plot your drawings to a wide range of raster file formats, including CALS, JPEG, PCX, Targa, Tiff, and BMP. You can then import your drawings into documents that accept bitmap images. Images can be up to 8,000 × 8,000 pixels (set through the Plotter Configuration Editor) and can contain as many colors as the file format allows. If you need several raster formats, you can use multiple instances of this or any plotter configuration.
To convert your 3D wireframe models into 2D line drawings, use the Flatshot tool described in Chapter 21. You can then include your 2D line drawings with other 2D drawings for plotting and printing.
Unlike most other programs, AutoCAD offers hundreds of page setup options. It can be quite a chore to keep track of and maintain all these options. But as you settle into using AutoCAD, you’ll probably find that you’ll set up a few plotter configurations and stick to them. AutoCAD 2011 lets you save a page setup under a name to help you store and manage the settings you use most.
You’ve already seen the Page Setup Manager dialog box on your way to preparing a page for printing. In this section, you’ll take a closer look at this useful tool.
Follow these steps to create a page setup:
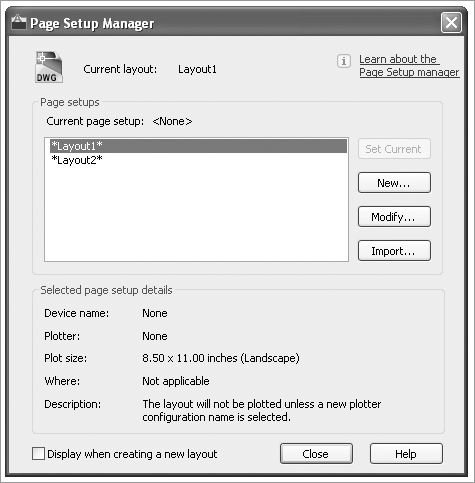
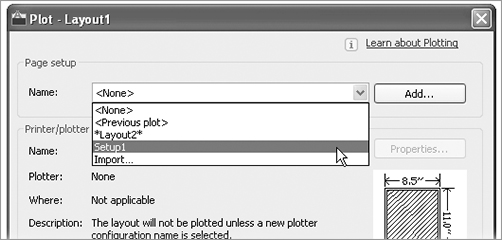
1. In AutoCAD, click the Page Setup Manager tool in the Output tab’s Plot panel. You can also right-click the Quick View Layouts tool in the status bar and choose Page Setup Manager. The Page Setup Manager dialog box opens (Figure 8-14). So far, you’ve used only the Modify option in this dialog box to modify an existing page setup. Now you’ll try creating a new setup.
Figure 8-14: The Page Setup Manager
2. Click the New button to open the New Page Setup dialog box (Figure 8-15).
Figure 8-15: Naming a new page setup
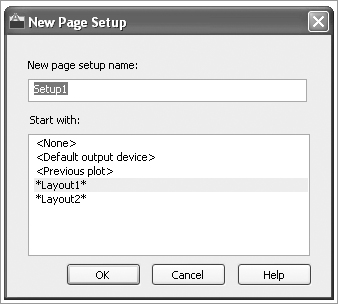
3. To create a new page setup, first enter a name in the New Page Setup Name input box, and then select a setup from the Start With list box. AutoCAD will use the setup you select as the basis for the new setup. Notice that AutoCAD offers the name Setup1 as a default name for a new setup.
4. Click OK when you’re finished. AutoCAD opens the Page Setup dialog box, where you can choose the settings for your new page setup.
5. Click OK to return to the Page Setup Manager, and then close it. Your new page setup is listed in the Current Page Setup list box. From here, you can select a page setup from the list box and then click the Set Current button to make it the current page setup for the layout.
You can also import other user-defined page setups by clicking the Import button. Because page setups are stored in the drawing, the Import button opens a standard file dialog box that displays drawing files. You can then select a file from which you want to import a page setup.
The current page setup applies to the current Layout tab, but after you create a new page setup, it’s offered as an option in the Page Setup Manager dialog box for all other Layout tabs. You can also select a page setup directly from the Plot dialog box by using the Name drop-down list in the Page Setup group.
Page setups can be used with the Publish feature described in Chapter 29 to set up batch plots or in the Sheet Set feature to set up sheet layouts quickly. You can also create an entirely new page setup “on the fly” while in the Plot dialog box. To do this, click the Plot tool in the Quick Access toolbar, and then click the Add button in the Page Setup group of the Plot dialog box. This opens a simple dialog box that enables you to enter a name for your new setup. After you enter a new name and click OK, you can proceed to choose your page settings. Then click OK or Apply To Layout and the setup will be saved under the new name.
Plotter and Printer Hardware Considerations
Positioning an AutoCAD drawing on the printer output is something of an art. Before you face a deadline with hundreds of plots to produce, you may want to create some test plots and carefully refine your plotter settings so that you have AutoCAD set up properly for those rush jobs.
As part of the setup process, you’ll need to understand how your particular printer or plotter works. Each device has its own special characteristics, so a detailed description of printer hardware setup is beyond the scope of this section. The following sections include a few guidelines.
Understanding Your Plotter’s Limits
If you’re familiar with a word-processing or page-layout program, you know that you can set the margins of a page, thereby telling the program exactly how far from each edge of the paper you want the text to appear. With AutoCAD, you don’t have that luxury. To place a plot on your paper accurately, you must know the plotter’s hard clip limits. The hard clip limits are like built-in margins, beyond which the plotter won’t plot. These limits vary from plotter to plotter (see Figure 8-16).
It’s crucial that you know your printer’s or plotter’s hard clip limits in order to place your drawings accurately on the sheet. Take some time to study your plotter manual and find out exactly what these limits are. Then make a record of them and store it somewhere in case you or someone else needs to format a sheet in a special way.
Hard clip limits for printers often depend on the software that drives them. You may need to consult your printer manual or use the trial-and-error method of plotting several samples to see how they come out.
Understanding the Plot And Publish Tab in the Options Dialog Box
I mentioned the Plot And Publish tab in the Options dialog box earlier in this chapter. This tab contains several options related to plotting that can be useful. Here’s a summary of those options and their purposes.
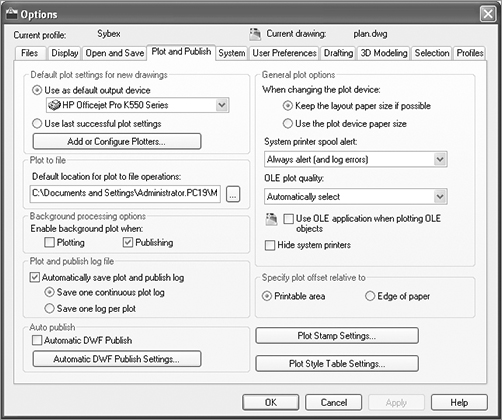
Default Plot Settings For New Drawings
The options in this group let you control the default plot settings for new drawings and for drawings from earlier versions of AutoCAD that are opened for the first time in AutoCAD 2011. The Use As Default Output Device radio button and drop-down list let you select the default plotter or printer to be used with new drawings. When the Use Last Successful Plot Settings radio button is selected, the last successful plotter settings for subsequent plots are used. This is how earlier versions of AutoCAD worked. The Add Or Configure Plotters button opens the Plotters window. This is the same as choosing the Plot Manager tool from the Output tab’s Plot panel. From the Plotters window, you can launch the Add-A-Plotter Wizard to add new plotter configurations. You can also edit existing plotter configurations.
General Plot Options
These options control some of the general plotter parameters. The Keep The Layout Paper Size If Possible radio button causes AutoCAD to attempt to plot to the paper size specified in the Plot dialog box, regardless of the paper size in the plotter. If the specified size is larger than the capacity of the plotter, a warning message is displayed. The Use The Plot Device Paper Size option causes AutoCAD to use the paper size specified by the system printer or the PC3 plot configuration file currently in use. Both settings are also controlled by the Paperupdate system variable.
The System Printer Spool Alert drop-down list offers control over printer-spooling alert messages. The OLE Plot Quality drop-down list lets you control the quality of OLE objects embedded in or linked to a drawing. This setting can also be controlled through the Olequality system variable.
When the Use OLE Application When Plotting OLE Objects check box is selected, AutoCAD launches any application that is associated with an OLE object embedded or linked to the AutoCAD drawing that is currently being plotted. This helps improve the plot quality of OLE objects. You can also set this option through the Olestartup system variable.
The Hide System Printers option affects the Printer/Plotter group’s Name drop-down list in the Plot and Page Setup dialog boxes. With this option turned on, you see only printers that have a .pc3 filename extension associated with them. These include printers that have been set up using the Add-A-Plotter Wizard discussed earlier in this chapter.
Plot To File
You have the option to plot to a file that can be downloaded to your printer or plotter at a later date. The Plot To File group lets you specify the default destination for the plot files.
Plot And Publish Log File
You can maintain a plot log file that records information about each plot you make. This can be helpful when you must keep records of hard-copy output for billing purposes. The location of the plot and publishing log file can be specified in the Files tab of the Options dialog box under the Plot And Publishing Log File Location listing. The log file has a .csv filename extension.
Background Processing Options
AutoCAD performs background plots so that after you begin a plot, you can immediately return to your drawing work instead of waiting for the plot to be completed. The options in this group let you turn on this feature either for standard plotting or for the Publish feature discussed in Chapter 29. You can also control this option through the Backgroundplot system variable.
Plot Stamp Settings
This button opens the Plot Stamp dialog box, which you saw in the section “Plot Options” earlier in this chapter. The Plot Stamp dialog box lets you determine what information is displayed in a plot stamp, which is a label placed on the print of a drawing to provide information about the source file.
Plot Style Table Settings
When you click this button, the Plot Style Table Settings dialog box opens. This dialog box controls the type of plot styles used in AutoCAD. In the case of named plot styles, you can also select a default plot style for layer 0 and a default plot style for objects. Note that the Use Color Dependent Plot Styles and Use Named Plot Styles radio buttons don’t have an effect on the current drawing; they affect only new drawings and pre–AutoCAD 2000 drawings being opened for the first time in AutoCAD 2011. The Default Plot Style Table drop-down list lets you select a default plot style table for new and pre–AutoCAD 2000 drawings. These settings are also controlled by the Pstylepolicy system variable.
The Add Or Edit Plot Style Tables button in the Plot Style Table Settings dialog box opens the Plot Styles dialog box. From there, you can double-click an existing plot style table file or start the Add-A-Plot Style Table Wizard to create a new plot style.
Specify Plot Offset Relative To
Here you can determine whether the plot offset is set in relation to the printable area of your printer or to the edge of the paper. The printable area is determined by the printer margin.
Auto Publish
You can set up AutoCAD to automatically publish your file to a DWF, DWFx, or PDF file when you save or close a drawing. Place a checkmark in the Automatic Publish check box to enable this feature. The Automatic Publish Settings button give you control over the location of the published files as well as the file format, password protection, and other file features. Note that this feature will increase the time it takes to save or close a file.
After you’ve established the limits of your plotter or printer, you’ll be better equipped to fit your drawing in those limits. You can then establish some standard drawing limits based on your plotter’s limits. You’ll also need to know the dimensions of those hard clip limits to define custom sheet sizes. Although AutoCAD offers standard sheet sizes in the Paper Size button group of the Page Setup and Plot dialog boxes, these sizes don’t take into account the hard clip limits.
Figure 8-16: The hard clip limits of a plotter
Knowing Your Plotter’s Origins
Another important consideration is the location of your plotter’s origin. For example, on some plotters, the lower-left corner of the plot area is used as the origin. Other plotters use the center of the plot area as the origin. When you plot a drawing that is too large to fit the sheet on a plotter that uses a corner for the origin, the image is pushed toward the top and to the right of the sheet (see Figure 8-17). When you plot a drawing that is too large to fit on a plotter that uses the center of the paper as the origin, the image is pushed outward in all directions from the center of the sheet.
Figure 8-17: Plotting an oversized image on a plotter that uses the lower-left corner for its origin
In each situation, the origin determines a point of reference from which you can relate your drawing in the computer to the physical output. After you understand this, you’re better equipped to place your electronic drawing accurately on the physical medium.
Using Batch and Electronic Plots
The focus of this chapter has been printer or plotter hard-copy output. But a major part of your work will involve the transmission of electronic versions of your documents. More than ever, architects and engineers are using the Internet to exchange documents of all types, so AutoCAD offers several tools to make the process easier.
I’ve mentioned that you can control some of your output settings thorough the Plot And Publish tab of the Options dialog box. The Publish feature includes items that enable you to “print” your drawings as a file that can be emailed to clients and consultants or posted on an FTP site or website. The Publish feature lets you create a single file that contains multiple pages so you can combine several drawing sheets into one file.
The Publish feature also enables you to plot several drawings at once without having to load and print each one individually. This can be helpful when you’ve finished a set of drawings and want to plot them during a break or overnight. Chapter 29 gives you a detailed look at the Publish feature.
Understand the plotter settings. Unlike other types of documents, AutoCAD drawings can end up on nearly any size sheet of paper. To accommodate the range of paper sizes, the AutoCAD plotter settings are fairly extensive and give you a high level of control over your output.
Master It Name a few of the settings available in the Plot dialog box.
Using layout views to control how your plots look. The Layout tabs in AutoCAD offer a way to let you set up how a drawing will be plotted. You can think of the Layout views as a kind of paste-up area for your drawings.
Master It Name some of the items that you see in a layout view.
Add an output device. Typically, AutoCAD will use the Windows system printer as an output device, but often you will find that the printer you use is a dedicated plotter that is not connected to Windows in the usual way. AutoCAD lets you add custom plotters and prints through the Add-A-Plotter Wizard.
Master It How do you start the Add-A-Plotter Wizard?
Store a page setup. Most of the time, you will use the same set of plotter settings for your drawings. You can save plotter settings using the Page Setup feature.
Master It Describe a way to create a page setup. Describe how to retrieve a setup.