
Chapter 13: Supporting Tools
In this chapter, we will be taking a look at a few tools that can make managing your firewalls and keeping an eye on the overall health of your organization straightforward. Many organizations have monitoring tools, such as Security Information and Event Management (SIEM), in place that already collect and aggregate information from many systems just to keep track of important incidents or to keep on top of change management. We will learn about a couple of handy add-ons that elevate an admin's visibility into the system health or network security. We will also look at an interesting and convenient (and free!) tool that aggregates and helps to enforce external threat intelligence feeds. Lastly, we will have a look at the Application Programming Interface (API).
In this chapter, we're going to cover the following main topics:
- Integrating Palo Alto Networks with Splunk
- Monitoring with Pan(w)achrome
- Threat intelligence with MineMeld
- Exploring the API
Technical requirements
This chapter will demonstrate several ways to connect the firewall to an external monitoring or management device. Access to a lab environment to install some of these tools can be helpful to gain an insight into what information can be extracted that is most useful to your organization. We will be running one of the tools in a Docker container.
You can find instructions on how to install Docker at their official page: https://docs.docker.com/engine/install/
Integrating Palo Alto Networks with Splunk
Splunk is a popular log aggregator and analyzer that can collect logs from many different sources and return information gathered from those logs in a wide variety of dashboards and "single panes of glass." To connect a firewall to Splunk, you will first need to set up a syslog-ng server to receive syslog messages from the firewall. Take the following steps to prepare your Splunk instance.
Depending on your flavor of Linux, the following instructions may vary. I've included yum and apt-get:
- You may need to uninstall rsyslog as per Splunk's recommendations:
sudo rpm -e --nodeps rsyslog
sudo apt-get remove rsyslog
- Install syslog-ng:
sudo yum-get install syslog-ng
sudo apt-get install syslog-ng
- Once the installation is complete, start syslog:
sudo systemctl start syslog-ng.service
sudo systemctl enable syslog-ng.service
- Lastly, verify whether syslog-ng is running by fetching the process ID:
sudo pidof syslog-ng
Once you are logged in to the Splunk portal, from the main screen, click on Add Data and, in the next screen, search for Palo Alto Networks (or Palo, as you can see in the following screenshot), and then click on the Configure now link on the output:
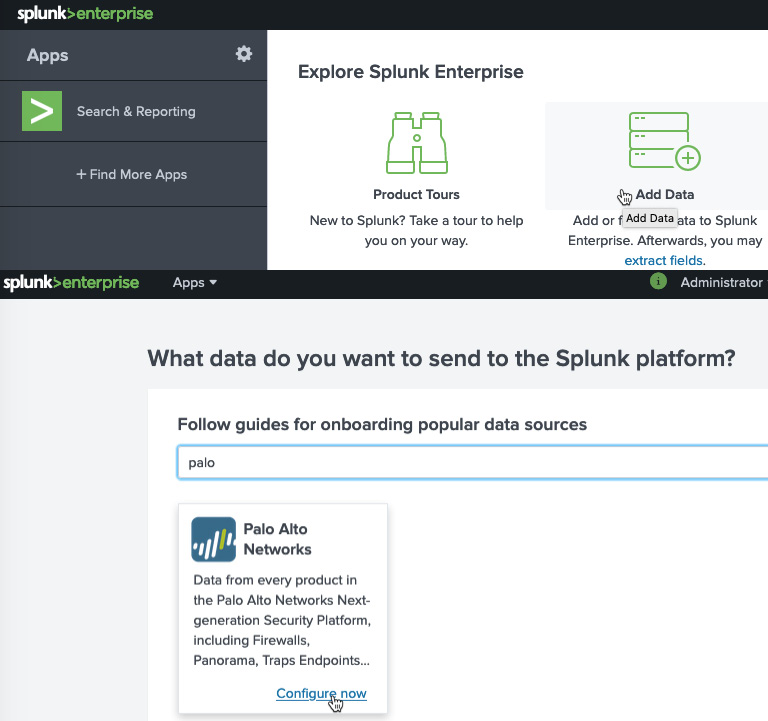
Figure 13.1 – Adding Splunk data
The next few steps, as shown in the following screenshot, guide you through the process and even give you step-by-step instructions on how to uninstall rsyslogd so that it can be replaced by syslog-ng on your Splunk server and so that you will be able to receive Palo Alto log files:
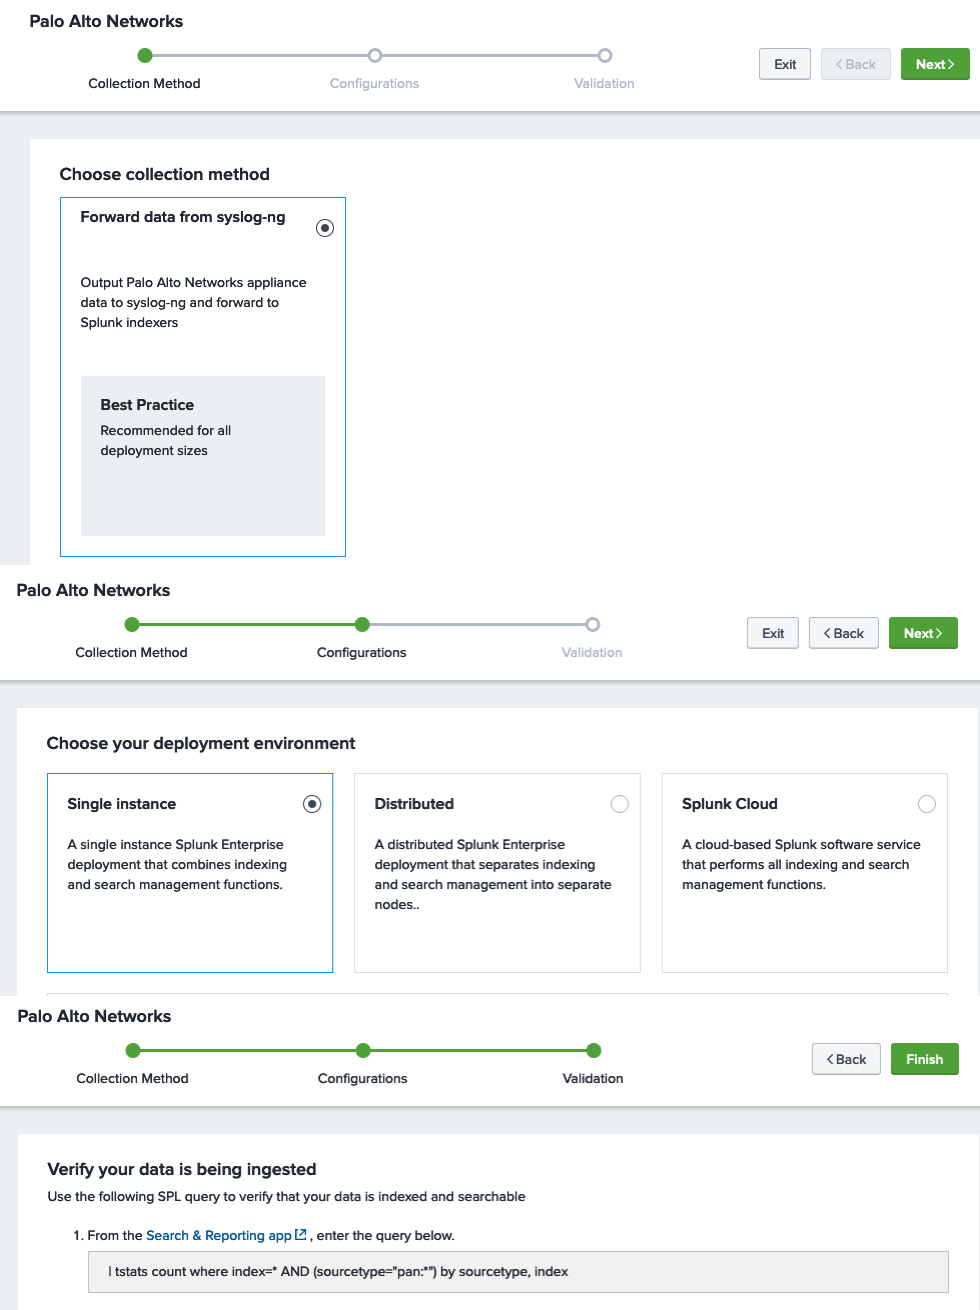
Figure 13.2 – Setting up data collection
The next step is to install the Palo Alto Networks applications by returning to the main page and clicking on + Find More Apps. In the application library, you can search for Palo Alto, which will return two applications:
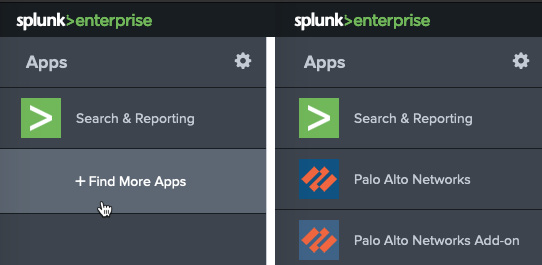
Figure 13.3 – Adding the Palo Alto applications
The first application provides log correlation for ingested logs and provides several dashboards with summary information, as you can see in the following screenshot. The second application can be used to correlate the MineMeld, Aperture, and Autofocus feeds:
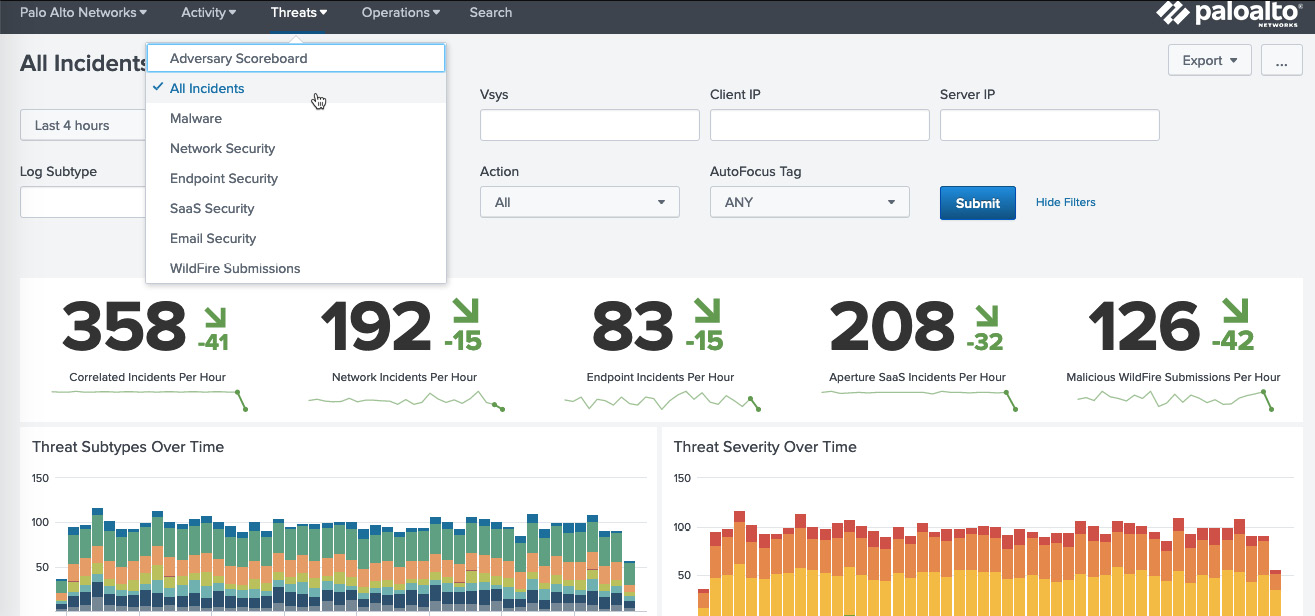
Figure 13.4 – Splunk threat dashboard
For all of this information to be made available to Splunk, you need to set up log forwarding on the firewall or Panorama.
In Device | Server Profiles | Syslog, or Panorama | Server Profiles | Syslog, create a Syslog profile that points to the Splunk server:
- Click on Add and name the profile Splunk.
- Click on Add to create a new server and set the server hostname.
- Set the IP of the Splunk server.
- Set the protocol and port. The default is UDP on port 514. Check your specific configuration as it may be configured differently.
- Set the supported format to BSD or IETF.
- Set the appropriate facility used by your syslog installation.
Then, for firewalls, in Objects | Log Forwarding, create or update the log forwarding profile called default and add the splunk profile to SysLog for all log types, as shown in the following screenshot.
Make sure the profile is also added to your security rules in Policy | Security:
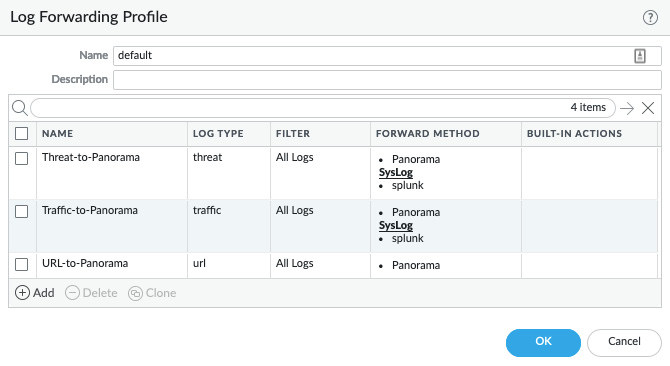
Figure 13.5 – Default log forwarding profile
Next, add a log forwarding profile in Device | Log Settings for the System, Configuration, User-ID, HIP Match, and GlobalProtect logs, as illustrated in the following screenshot, for a firewall. Repeat the log forwarding on Panorama in Panorama | Log Settings. Splunk can correlate these events as well and provide a simplified dashboard for these logs:
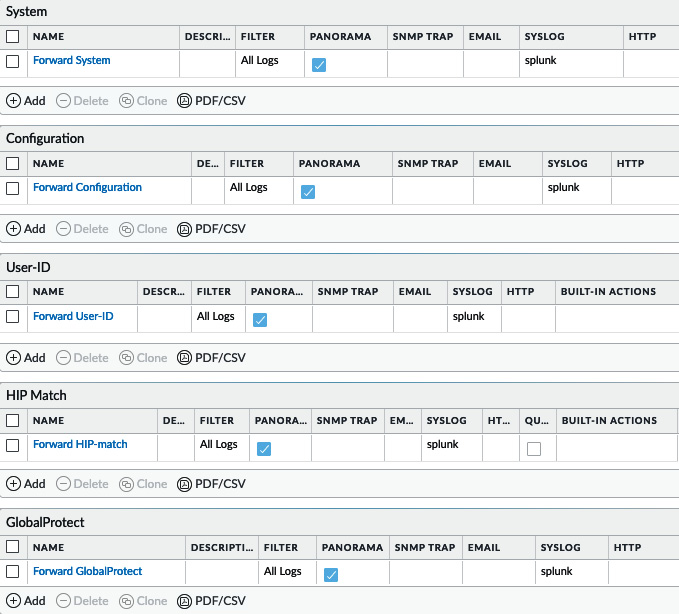
Figure 13.6 – Device log settings
Besides server-installed correlation engines, there are also lightweight browser plugins to keep an eye on your device's health, as we'll see in the next section.
Monitoring with Pan(w)achrome
Some monitoring tools come in very simple packaging, such as the Chrome browser extension Pan(w)achrome (also known as Panachrome). You can install the extension right from the Chrome web store:
- Open https://chrome.google.com/webstore/category/extensions in the Chrome browser.
- Search for pan(w)achrome.
- Click on Add to Chrome, as shown in the following screenshot:

Figure 13.7 – Adding the Pan(w)achrome extension to Chrome
- Once the extension is installed, the icon will appear in your extension quick launch.
- Click on the icon to go to the landing page, where you can add new firewalls, as shown in the following screenshot:
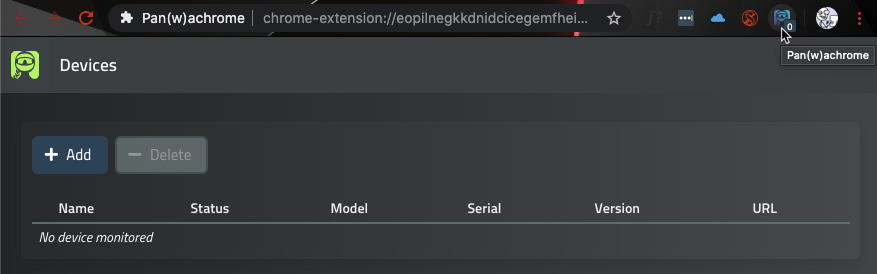
Figure 13.8 – Pan(w)achrome managed devices
- Click on the Add button and add the firewall by its URL.
- Select whether you want to authenticate using an API key or username and password.
The API key can be easily extracted from each firewall using the following command:
curl -k -X GET 'https://<firewall>/api/?type=keygen&user=<username>&password=<password>'
Alternatively, use the following URL in a browser:
https://<firewall>/api/?type=keygen&user=<username>&password=<password>
The output will look similar to the following. You will need to collect the string of text between the <key> and </key> tags without including the tags themselves:
<response status = 'success'><result> <key>LUFRPT1OQ3JTZCM2Z4Yk9lOE5EDSGF345YQ==</key> </result></response>
- You can now use the API key to add a new device, as in the following screenshot:

Figure 13.9 – Adding a new device
- Once the device is added, it will appear in the list of managed devices with some basic information, as you can see in the following screenshot:

Figure 13.10 – Managed devices
The plugin is now installed and ready to go. You can now click on the device name to go to the dashboard, where you will see the following overview page, containing a live view of the current ingress, egress, active sessions, and connections per second:
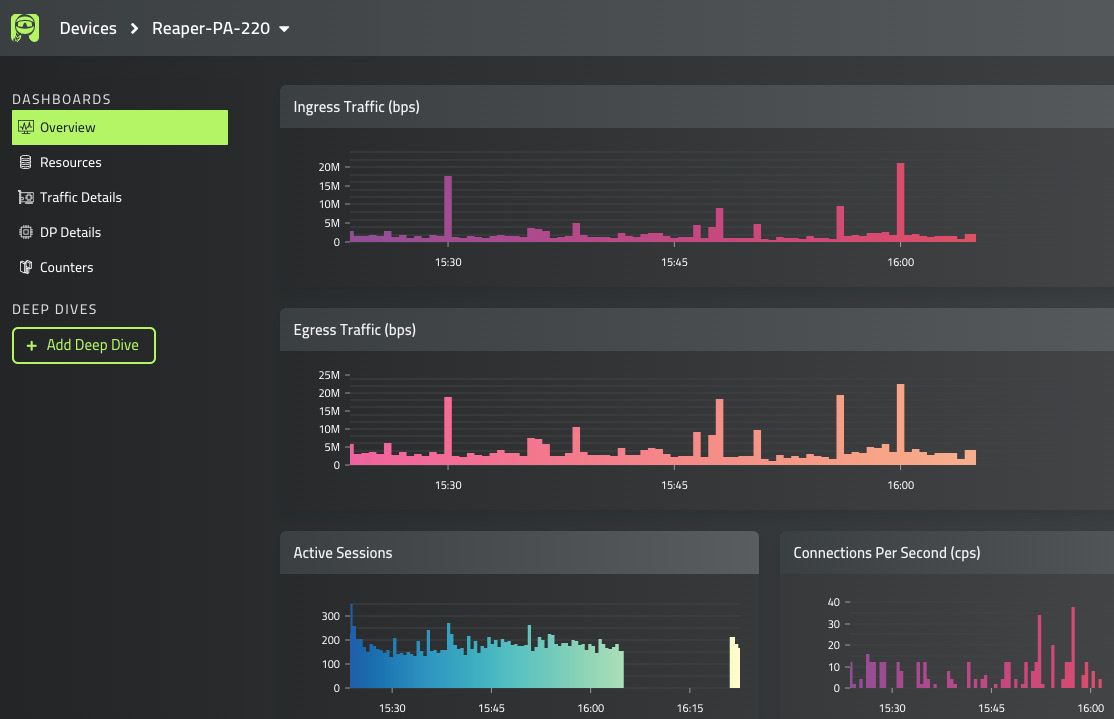
Figure 13.11 – Panachrome overview
Important note
The statistics will start to be collected once the gateway is added to the extension for as long as the browser is open. This is not a typical data collection tool as it does not keep a log and all the data is reset once Chrome is closed, including the connected gateways. A future version plans to contain gateway retention (you can keep track of updates via https://www.pangurus.com/forum/panachrome).
The other dashboards also provide valuable live output from your system. This is one of the traits Panachrome puts forward that none of the other tools are quite able to match :

Figure 13.12 – The other default dashboards
Another cool feature is the ability to add deep-dive dashboards that contain more specific information (and where more options will become available in the future). You can add monitoring for GlobalProtect activity or SSL decryption, as well as add zone-specific dashboards. This can come in real handy when keeping a close eye on system health and user activity in times of heightened remote work:
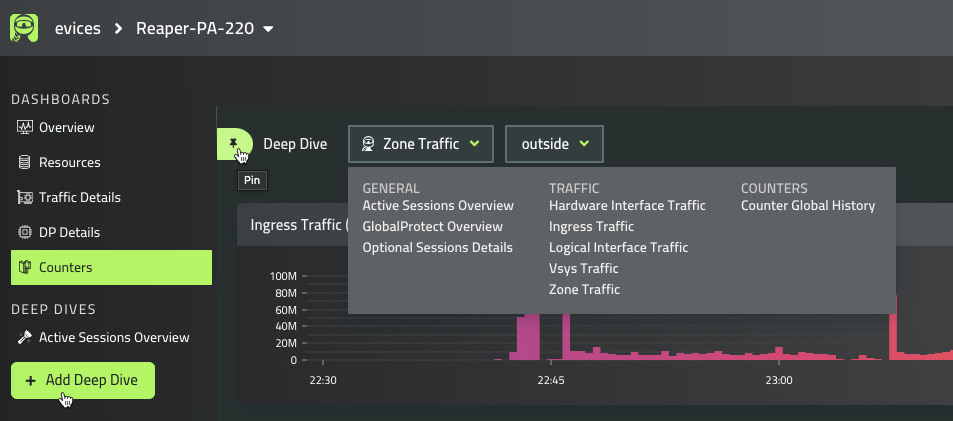
Figure 13.13 – Deep-dive dashboards
You can now leverage a simple but powerful browser plugin to keep an eye on the overall health of your firewalls without needing to go to a management or monitoring portal. In the next section, we'll learn how to consolidate freely available and powerful threat intelligence data.
Threat intelligence with MineMeld
MineMeld is a tool provided by Palo Alto Networks and is an extensible threat intelligence processing framework. This means it is able to ingest several threat intelligence feeds and aggregate the information so that you can feed it into the firewall as an additional protection vector, which is pretty cool.
The installation is straightforward, and you can even run it in a Docker container:
sudo docker pull paloaltonetworks/minemeld
sudo docker volume create minemeld-logs
sudo docker volume create minemeld-local
sudo docker run -dit --name minemeld --restart unless-stopped --tmpfs /run -v minemeld-local:/opt/minemeld/local -v minemeld-
logs:/opt/minemeld/log -p 443:443 -p 80:80 paloaltonetworks/minemeld
MineMeld can now be accessed via https://<hostIP>.
Important note
The -p 443:443 -p 80:80 flags tell Docker which host ports to map to the container ports – in this case, ports 443 and 80 on the host are directly mapped to the same ports in the container. To change the ports that should be mapped to the host, change the first number – for example, -p 8443:443 -p 8080:80 would make the MineMeld instance available on ports 8443 and 8080 on the host IP or the https://<HostIP>:8443 hostname.
By default, MineMeld will already take in information from dshield and spamhaus. DShield is a project by the SANS internet storm center and Spamhaus is an international non-profit organization. Both organizations track malicious activity on the internet and maintain a live database of hosts that are involved in these activities.
When you log on to MineMeld, you are presented with the dashboard, as you can see in the following screenshot. The dashboard provides an overview of the overall state of the miners and outputs and the number of indicator updates that have taken place in the last hour, 24 hours, 7 days, or 30 days:

Figure 13.14 – The MineMeld dashboard
You can also create your own inputs from paid services or custom threat intelligence collectors inside your network.
In the following diagram, you can see how all the components are connected. The green input nodes, called miners, collect indicators from external services. The indicators are forwarded or removed to the red processor, which aggregates the data. The aggregated indicators are then forwarded to the yellow output nodes. The thickness of the gray line indicates the volume of updates that a certain miner has forwarded recently:

Figure 13.15 – MineMeld miners to output nodes
The default output nodes have been set so that they accept indicators depending on the confidence score assigned by the input node:
- inboundfeedhc only accepts a confidence score that is >75.
- inboundfeedmc accepts a confidence score that is >50 but <75.
- inboundfeedlc accepts a confidence score that is <50.
As you can see in the following screenshot, you can access all the existing nodes from the NODES menu. Clicking on each will bring up its status and statistics:

Figure 13.16 – MineMeld nodes
If you click one of the miners, you will get a new window showing its status and the prototype used for the miner, as in the following screenshot:
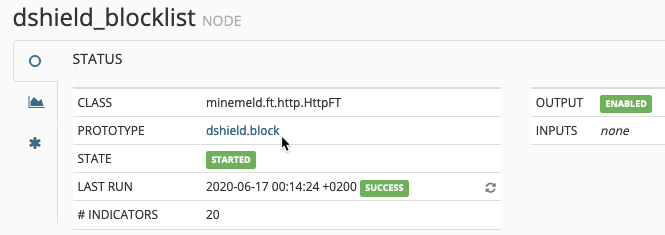
Figure 13.17 – Miner details
A prototype in MineMeld is basically the configuration that makes up a node. At the top, it indicates whether the prototype is a miner, a processor, or an output and whether it is stable or experimental. There is some basic information about where the node came from and who the author is, whether the indicators are IPv4, IPv6, and/or URLs, and the configuration associated with the node.
You can view many more prototypes by going to the Config page and clicking on browse prototypes in the bottom-right corner, as you can see in the following screenshot, or by manually browsing to https://<minemeld>/#/prototypes:
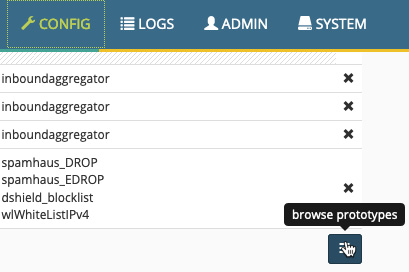
Figure 13.18 – browse prototypes
Once you find a prototype you like, you can either select to turn it into a node or create a new prototype using that node as a template, as you can see in the following screenshot:

Figure 13.19 – Turning a prototype into a node
Once you select to create a new node from a template, you are asked to provide a name for the node and are then brought back to the Config page. Here, you should click on the INPUTS column of the processor and add the new miner, as follows. Lastly, you must click on Commit to activate the configuration and start the new miner:
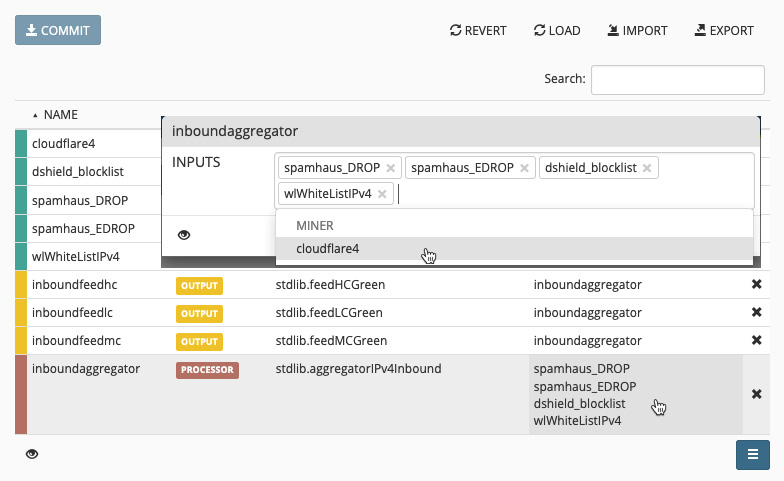
Figure 13.20 – Adding a miner to the processor
Now, go back to the Nodes page and click any of the output nodes. This will bring up the FEED BASE URL fields, as you can see in the following screenshot:
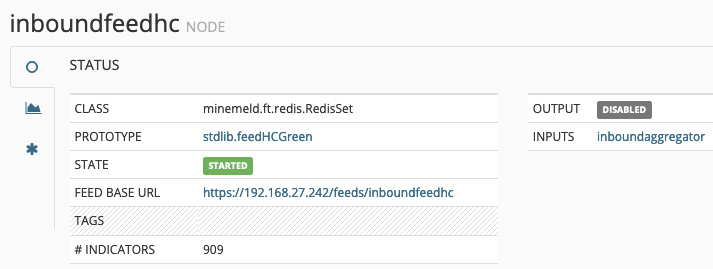
Figure 13.21 – inboundfeedhc details
Now, follow these steps to create an External Dynamic List (EDL) on the firewall:
- Copy the feed base URL (https://<HostIP>/feeds/inboundfeedhc).
- In the firewall, go to Objects | External Dynamic List.
- Create a new EDL and call it Minemeld feed.
- Set Type to IP List.
- Set Source to the feed base URL.
- Set the update interval (Five Minute, Hourly, Daily, Weekly, or Monthly).
- You can click on Test Source URL to make sure the firewall is able to fetch the IP list:

Figure 13.22 – Firewall EDLs
Once you save the change to the firewall, it will start fetching the IP list and you can reopen the object to review the list and even make manual exceptions, as you can see in the following screenshot:
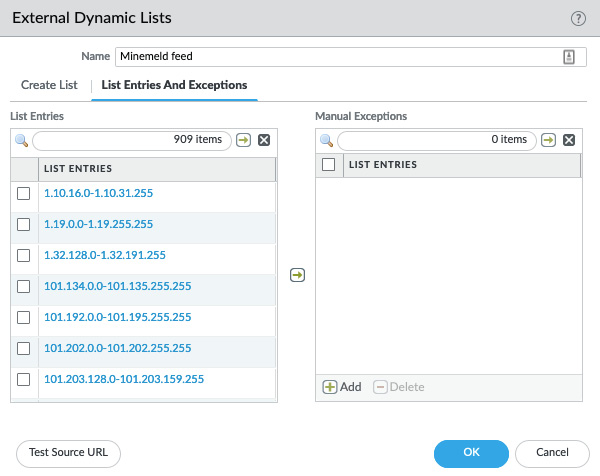
Figure 13.23 – Reviewing and adding exceptions to an EDL
You can also verify the state of the EDL from the command line with the following command:
reaper@PA-220request system external-list stats type ip name "Minemeld feed"
vsys1/Minemeld feed:
Next update at : Tue Jun 16 23:57:27 2020
Source : https://192.168.27.242/feeds/inboundfeedhc
Referenced : Yes
Valid : Yes
Auth-Valid : Yes
You can now set up MineMeld and collect threat intelligence feeds from external parties. You can add additional miners and bind them to a processor so that the information becomes available in an output feed. You can also create EDLs and apply them to security rules.
In the next section, we'll learn how to access configuration and operational commands through the API.
Exploring the API
The API is a universally compatible way of accessing the firewall and executing all sorts of commands, from extracting information to adding and updating runtime information or configuration. If you have external monitoring, you could automate adding blacklisted IPs on the firewall when a security event is triggered, or if an access point supports sending out API commands, it could update user-to-IP mapping on the firewall when a user logs on or off.
To be able to use the API, however, you will always need an API key to authenticate any remote sources making a connection to the firewall. You can generate a key using the following command from the terminal or command line:
curl -k -X GET 'https://<firewall>/api/?type=keygen&user=<username>&password=<password>'
Alternatively, you can search the following URL in a browser:
https://<firewall>/api/?type=keygen&user=<username>&password=<password>
The output will look similar to the following:
<response status="success"> <result> <key>LUFRPT14MW5xOEo1R09KVlBZNnpnemh0VHRBOWl6TGM9bXcwM3FGA fDSF4564EWdGSet </key> </result></response>
You can use curl (both GET and POST) from any terminal, or you can simply access the firewall's web interface using the URL to execute the API commands.
Adding &key=<key> after API commands will now authenticate the connection.
This key represents an admin account, so keep it just as safe as you would the password to the user account. If the account used is a superuser account, API access will also be granted elevated status. It is advisable to create a unique account for API operations and assign it an admin role that restricts access to everything except the required API options, as you can see in the following screenshot:
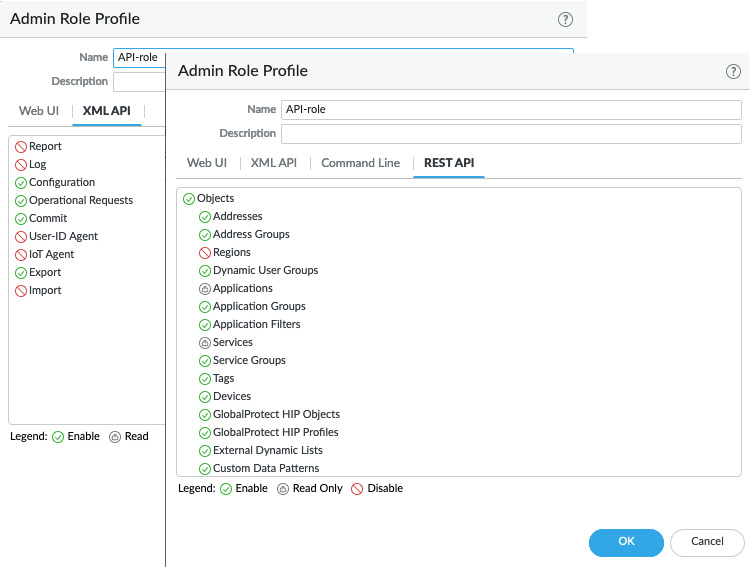
Figure 13.24 – API admin role
Here are a few common examples.
You can easily extract reports via the API so that you don't need to go in through the web interface:
https://192.168.27.2/api/?type=report&async=yes&reporttype=predefined&reportname=top-attacker-sources&key=LUFRPT14MW5xOEo1R09KVlBZNnpnemh0VHRBOWl6TGM9bXcwM3FGAfDSF4564EWdGSet
In the preceding command, I'm fetching a predefined report called top-attacker-sources. You can also retrieve custom reports.
You can also run a lot of CLI commands from the API, which lets you view a lot of the runtime statistics.
The following URLs, which you could also run via curl on the command line, will output CLI information directly in your browser, instead of needing to log on to the firewall.
You can view the logged-on administrators with the following API URL:
https://192.168.27.2/api/?type=op&cmd=<show><admins></admins%></show>&key=LUFRPT14MW5xOEo1R09KVlBZNnpnemh0VHRBOWl6TGM9bXcwM3FGA fDSF4564EWdGSet
Alternatively, you can review the currently known user-to-IP mappings:
https://192.168.27.2/api/?type=op&cmd=<show><user><user-ids><all></all></user-ids></user></show>&key= LUFRPT14MW5xOEo1R09KVlBZNnpnemh0VHRBOWl6TGM9bXcwM3FGAfDSF4564 EWdGSet
The following URL lets you see the logged-on GlobalProtect users:
https://192.168.27.2/api/?type=op&cmd=<show><global-protect-gateway><current-user/></global-protect-gateway></show>&key= LUFRPT14MW5xOEo1R09KVlBZNnpnemh0VHRBOWl6TGM9bXcwM3 FGAfDSF4564EWdGSet
You can even disconnect GloblalProtect users using the following API URL:
https://192.168.27.2/api/?type=op&cmd=<request><global-protect -gateway><client-logout><gateway>gateway</gateway><user>reaper</user><reason>force-logout</reason<
/client-logout></global -protect-gateway></request>&key=LUFRPT14MW5xOEo1R09KVlBZNnpnemh 0VHRBOWl6TGM9bXcwM3FGAfDSF4564EWdGSet
From a monitoring perspective, you can quickly call up the current data plane load from an API call:
https://192.168.27.2/api/?type=op&cmd <show><running><resource-monitor><minute></minute></resource-monitor></running></show>&key=LUFRPT14MW5xOEo1R09KVlBZNnpnemh0VHRBOWl6TGM9bXcwM3FGA fDSF4564EWdGSet
If needed, you can collect the power supply, thermal, and board power stats:
https://192.168.27.2/api/?type=op&cmd=<show><system><environmentals></environmentals></system></show>&key=LUFRPT14MW5xOEo1R09KVlBZNnpnemh0VHRBOWl6TGM9bXcwM3FGA fDSF4564EWdGSet
From a scripted operation perspective, a pretty cool trick is the following. If you have a second default route set with a higher metric, you can launch an API call to change the metric so that the backup route takes over when needed:
https://192.168.27.2/api?type=config&action=set&xpath=/config/devices/entry[@name='localhost.localdomain']/network/virtual-router/entry[@name='default']/routing-table/ip/static-route/entry[@name=Second-Gateway']/metric&element=<metric>5</metric>&key=LUFRPT14MW5xOEo1R09KVlBZNnpnemh0VHRBOWl6TGM9bXcwM3 FGAfDSF4564EWdGSet
There are plenty of useful commands that can help set up remote monitoring or interact with configuration items. You can browse through the available API commands by navigating to the firewall (or Panorama) API interface at https://<hostname>/api and the REST API manual at https://<hostname>/restapi-doc/.
In this section, we learned about the API and a few simple tricks that can make life easier as you can use any browser or terminal that has curl installed to launch commands on a firewall.
Summary
In this chapter, we reviewed a couple of handy tools that can be set up to augment an existing Syslog or SIEM solution. We looked at tools that provide an administrator with some quick and easy ways to perform and automate some management and monitoring tasks without needing to depend on cumbersome monitoring portals. You learned how to access the API section of the firewall and Panorama so that you can easily find the commands you need to set up automation. You are now also able to set up your very own threat intelligence server that can aggregate multiple data flows into easy-to-use security rule objects.
Congratulations, you made it to the end! I want to thank you for sticking with me all the way here. Hopefully, you've learned a lot and have been able to impress a few people left and right with your new skills. It is my sincere hope you thoroughly enjoyed reading this book and will keep it by your side as a trusted companion.