14
Vendor and Expenses Reports
QBCU
5.1.3
Having access to reports that will give you detailed insight into what your expenses are, who you are paying, and the amount paid to each vendor will help you to control expenses and maintain a profitable business. There are a number of reports in QuickBooks Online (QBO) that will help you understand what you owe to vendor suppliers and other creditors.
We will dive into the information you can expect to find in each report, how to customize the report, and how to generate reports. We will also discuss ways you can use reports to help you manage your expenses and cash flow. I recommend you run these reports and review them on a weekly basis. Having access to this information will help you to manage your cash flow and stay on top of the money that goes out of your business.
In this chapter, we will focus on the following key reports:
- Generating an accounts payable (A/P) aging report
- Generating an unpaid bills report
- Generating an expense by vendor summary report
- Generating a bill payments report
The US edition of QBO was used to create this book. If you are using a version that is outside of the United States, results may differ.
Generating an accounts payable (A/P) aging report
An accounts payable aging report, also known as an A/P aging report, groups unpaid bills based on the number of days they are outstanding or due. Similar to the A/R aging report that we saw in the previous chapter, there are five main groups: current, 1-30 days, 31-60 days, 61-90 days, and 91 days and over. QuickBooks calculates the age of a bill by using the bill date. To stay on top of bills, business owners should review this report on a weekly basis, and take the necessary steps to pay bills that are nearly due. For bills coming due, you should go ahead and process the payment online with your financial institution or write a check directly from QuickBooks.
Follow these steps to generate an A/P aging report:
- Navigate to Reports from the left menu bar, as indicated in Figure 14.1:

Figure 14.1: Navigating to the Report Center
- Scroll down to the What you owe section and select Accounts payable aging summary, as indicated in Figure 14.2:

Figure 14.2: Selecting the Accounts payable aging summary report
In addition to the Accounts payable aging summary report, there is an Accounts payable aging detail report. The detailed report includes information about each bill for the vendor. This includes the bill date, bill number, due date, and amount due. The summary report, on the other hand, includes the open balance for each vendor, grouped by the age of the bill (current, 1-30 days, 31-60 days, 61-90 days, and 91 days and over).
- Click on the Customize button and you can customize the report period, format numbers, columns to display, aging method, days per aging period, and the number of periods for the A/P aging summary report. You can also filter by the vendor and configure other general customizations, as indicated in Figure 14.3:
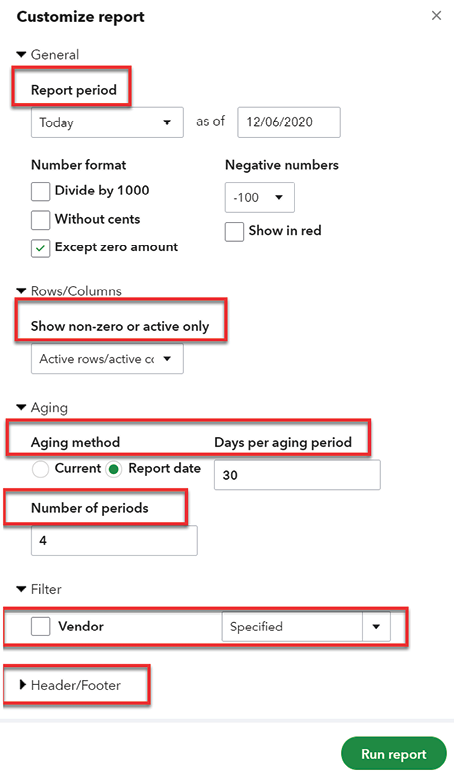
Figure 14.3: Report customization options
The following are brief descriptions of the customizable fields available for an A/P aging summary report:
- Report period: You can select preset dates from the drop-down menu, which includes Today, This week, This month, This quarter, or This year. If you prefer a custom date range, select Custom from the dropdown and manually enter the dates.
- Show non-zero or active only: Choose to display non-zero only, which means only accounts with activity for the report period specified will be displayed on the report. You can also choose to show active accounts only, which means any account that was made inactive will not be shown on the report.
You can learn more about how to make accounts inactive in Chapter 5, Customizing QuickBooks for Your Business.
- Aging method: You can choose an aging method of Current or Report date. Current will calculate the age of each bill as of today’s date, whereas Report date will use the report period to calculate the number of days a bill has remained outstanding (unpaid).
- Days per aging period: Customize the number of days per aging period or use the standard 30 days per aging period.
- Number of periods: Similar to Days per aging period, you can also customize the number of periods in which to group bills. In the preceding example, we have chosen four periods (1-30, 31-60, 61-90, and 91 days and over).
- Filter: You can filter the A/P aging report for a specific vendor by selecting the vendor from the dropdown.
- Header/Footer: You can customize the header information, such as report title, and the footer information, such as date/time prepared.
- After making your selections, click the Run report button.
- An A/P aging summary report—similar to the following one—will appear:

Figure 14.4: Sample A/P aging summary report
In this sample A/P aging summary report, Photos by Design’s outstanding bills total $300.00 with The Phone Company. Of this amount, $150 is 1-30 days past due and $150 is 31-60 days past due. Click on any amount or the TOTAL column to see the details of the bill. In order to maintain favorable credit terms with vendor suppliers, the business owner needs to make a payment or make arrangements to pay the past due amount.
Before contacting vendor suppliers, you need to run an unpaid bills report to see the details behind the open balances on this A/P aging summary report. We will show you how to generate an unpaid bills report next.
Generating an unpaid bills report
An unpaid bills report is a list of all bills that have not been paid, as of the date range for the report. It is very similar to an A/P detail report, with the exception that it does not group invoices based on the number of days outstanding. The report includes details such as the vendor’s name and a list of all unpaid bills, including amount, due date, number of days past due, and open balance. You can use this report to quickly identify bills that are past due. This will allow you to follow up with vendors, to make payment arrangements for any bills that are past due or coming due.
Follow these steps to generate and customize an unpaid bills report:
- Navigate to Reports from the left menu bar, as indicated in Figure 14.5:

Figure 14.5: Navigating to the Reports Center
- Scroll down to the What you owe section and select Unpaid Bills, as indicated in Figure 14.6:

Figure 14.6: Running the unpaid bills report
- Customize the unpaid bills report by clicking on the Customize button and selecting a report period, an aging method, minimum days past due, a filter, and header/footer info, as indicated in Figure 14.7:
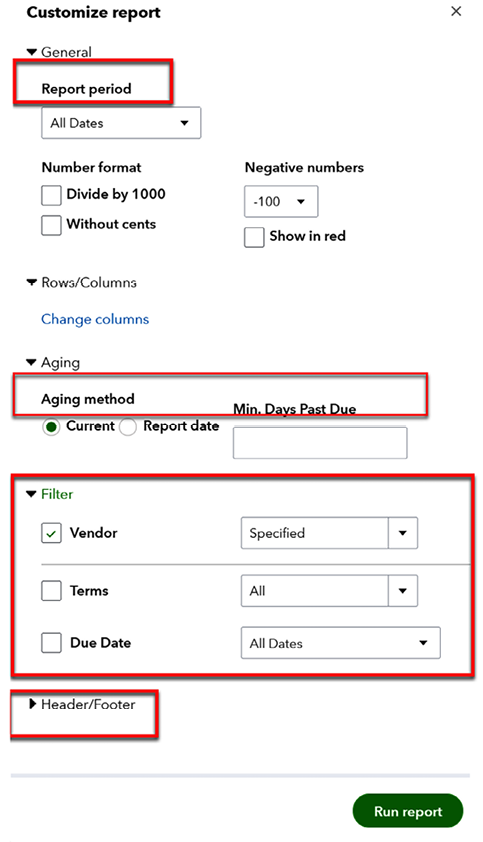
Figure 14.7: Report customization options
The following are brief descriptions of the customizable fields available for an unpaid bills report:
- Report period: Select the date range for which to run the report. You can manually enter a date range, or choose from the following: Today, This Week, This Month, This Quarter, or This Year.
- Aging method: The aging method is used to calculate the number of days a bill is past its due date. You can select the Current option, which will use today’s date, or you can select the Report date option. The Report date option will use the report period to calculate the number of days the bill remains unpaid.
- Min. Days Past Due: If applicable, you can enter a minimum number of days a bill is past due, or you can leave this field blank.
- Filter: You can filter the unpaid bills report by selecting a specific vendor, payment terms, and due date of the bill.
- Header/Footer: Similar to the A/P aging report, you can customize the report title and the report date and time in the Header/footer section.
- After making your selections, click the Run report button to generate the unpaid bills report.
- An unpaid bills report, similar to the following one, should appear:

Figure 14.8: Sample unpaid bills report
In this sample unpaid bills report, Photos by Design has unpaid bills totaling $300.00. As seen in the previous section, the total unpaid amount is due to The Phone Company. The oldest bill has been past due for 35 days in the amount of $150.00.
This report lists the vendors in alphabetical order and includes the vendor name, contact phone number, bill date, due date, number of days past due, and outstanding amount. To maintain good credit with your vendor suppliers, you should review this report on a weekly basis and contact vendors to make payment arrangements.
To help you stay on top of what you are spending your money on, you need to review the expenses by vendor report. We will show you how to run this report next.
Generating an expenses by vendor summary report
In order to maintain a healthy and positive bottom line, you need to be aware of what your business expenses are. An expenses by vendor summary report provides detailed information about the vendors with whom you are spending your money. This report includes a list of vendors and the total amount you have paid for a specific time period. You can use this report to gauge what your largest expenses are. Plus, you can also use the information on this report to negotiate better pricing with those suppliers from whom you purchase the most.
Follow these steps to generate an expenses by vendor summary report:
- Navigate to Reports from the left menu bar, as indicated in Figure 14.9:

Figure 14.9: Navigating to the Report Center
- Scroll down to the Expenses and vendors section and select the Expenses by Vendor Summary report, as indicated in Figure 14.10:

Figure 14.10: Selecting the Expenses by Vendor Summary report
- You can customize an expenses by vendor summary report by clicking on the Customize button and selecting the reporting period, accounting method, number format, columns to display, and period comparison, as indicated in Figure 14.11:

Figure 14.11: Report customization options
The following are brief descriptions of the customizable fields available for an expenses by vendor summary report:
- Report period: From the drop-down menu, select a reporting period, or manually enter the date range for which to run the report.
- Accounting method: Select the accounting method (Cash or Accrual) for which you would like to run the report.
- Number format: Format numbers by dividing by 1,000, displaying them with or without cents, and making negative numbers red. You have three formatting options for negative numbers: -100, (100), or 100-.
- Columns: You can format the report to display information by total only, days, weeks, months, quarters, years, customers, or vendors.
- Show non-zero or active only: You can choose to display non-zero only, which means only accounts with activity for the period will show up on the report. You can also show active accounts only, which means any account that was made inactive will not be shown on the report.
You can learn more about how to make accounts inactive in Chapter 5, Customizing QuickBooks for Your Business.
- Period comparison: You can compare the current period to a previous period from the drop-down menu.
- After making your selections, click the Run report button to generate the report.
- An expenses by vendor summary report, similar to the following one, should be displayed:

Figure 14.12: Sample expenses by vendor summary report
In the sample expenses by vendor summary report, total expenses for Photos by Design are $5,191.77. Photo Supply Co. received the highest payment of $1,000. The report gives business owners insight into who they are spending their money with. As discussed, this can be helpful when it comes to negotiating a better price for goods and services.
To drill down to specific payments made to vendors, you can run a bill payments report. We will show you how to generate this report next.
Pro Tip: The vendor summary report is great for reviewing what you have paid vendors for the year to determine who may be subject to 1099s. You can quickly review the report to see who you have paid $600 or more to, which is the threshold for generating a 1099 form. You can learn more about how to process 1099s in Chapter 16, Managing 1099 Contractors in QuickBooks Online.
Generating a bill payments report
A bill payments report includes detailed payment information about the bills you have paid. The report is broken down by the method of payment (for example, cash, credit card, or check). It includes the payment date, check number (if applicable), vendor, and amount paid. If you want to determine the payments made for a specific time period, this report will give you the information you need.
To generate a bill payments report, follow these steps:
- Navigate to Reports from the left menu bar, as indicated in Figure 14.13:
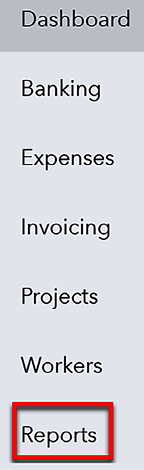
Figure 14.13: Navigating to the Report Center
- Scroll down to the What you owe section and select Bill Payment List, as indicated in Figure 14.14:

Figure 14.14: Running the bill payment list report
- On the next screen, you can customize the report period and determine how the report is grouped, as indicated in Figure 14.15:

Figure 14.15: Customizing the bill payment list report
The following are brief descriptions of the customizable fields for a bill payments report:
- Report period: Select a preset time period, such as today, this week, this month, this quarter, or this year. You can also select Custom, and enter a date range.
- Group by: When it comes to sorting, you can group the report by account, vendor, day, week, month, quarter, or year.
- After making your selections, click the Run report button to generate the bill payment list report.
- A bill payment list report, similar to the following one, should be displayed:

Figure 14.16: Sample bill payment list report
In the sample bill payment list report, Photos by Design has paid a total of -$4,305.09 in checks and $234.41 via Mastercard. When funds are withdrawn from the checking account, a negative amount reduces the balance in the checking account. This is the reason why the total for checks is -$4,305.09. On the other hand, a payment made with a credit card increases the balance due on that card, which is represented by a positive number. This report includes the payment date, check number (or payment reference number), vendor, and amount paid.
You can run this report for any time period, to gain insight into payments made to all vendors. This information can help you to forecast the amount of cash you need available to meet your obligations to vendors.
Pro Tip: Don’t forget to memorize reports that you will use on a regular basis. This will save you time reformatting and searching for reports. To learn how to memorize reports, head over to Chapter 11, Report Center Overview.
Summary
In this chapter, we have provided you with information about four key reports that will help you to control your business expenses and stay on top of payments to your vendors. Our goal was to introduce you to the A/P aging report, the unpaid bills report, the expenses by vendor report, and the bill payments report. We have accomplished this goal by providing step-by-step instructions on how to customize and generate each of these reports. In addition, we have explained how these reports will help you to stay on top of unpaid bills so that you can maintain a good credit history with your vendors.
In the next chapter, we will show you how to set up and manage your employees and contractors.
Join our book’s Discord space
Join the book’s Discord workspace for a monthly Ask me Anything session with the author: https://packt.link/QuickBooks
