
The analysis phase is the last step in the performance test cycle after which we suggest and publish the report to the stakeholder. In this chapter we will study how to capture details of the running test.
In SoapUI we have features to capture data and we have graphs to showcase data which makes it easy to analyze:
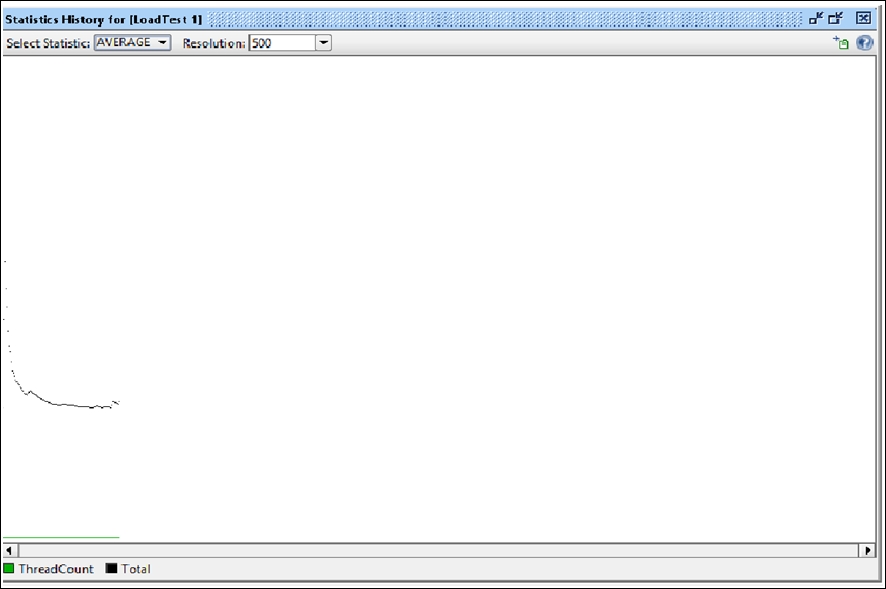
The preceding screenshot shows the average thread count over time.
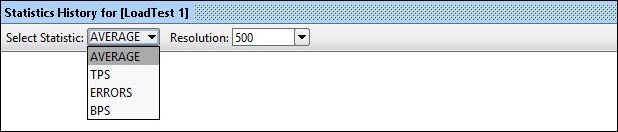
We can select data for AVERAGE response time, TPS, ERRORS and BPS (Bytes exchanged per second) as shown in the following screenshot:
In case we want to monitor the server statistics, we need to switch to monitoring utilities like Perfmon for Windows and SAR and K SAR reporting for Linux-based OSs.
Perfmon: You can access performance monitor by typing perfmon at the command prompt or by selecting the Performance or Reliability and Performance Monitor from the Administrative Tools menu.
This is how the screen will pop up:
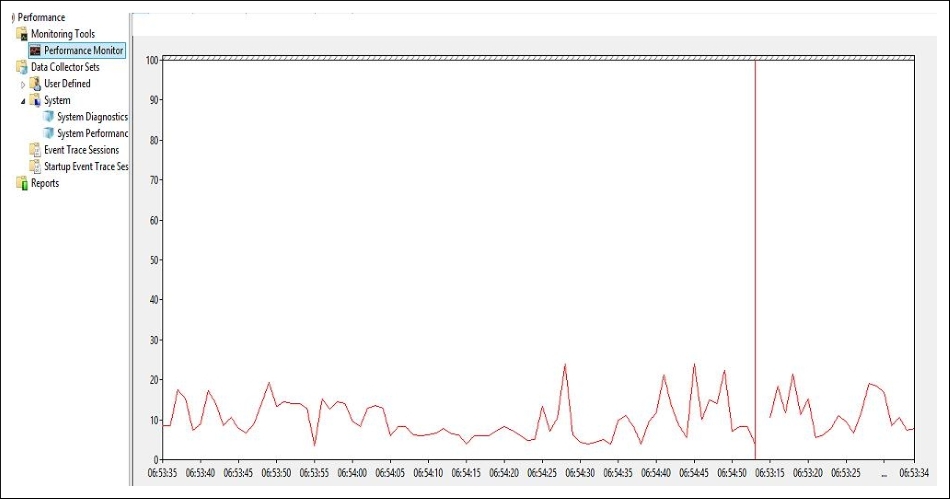
In Perfmon you can configure the performance counters you want to monitor like: physical disk, memory, process, CPU, and network.
Following is the list of the performance counters usually monitored.
- Server analysis:
- Database analysis:
- Some of the common performance bottlenecks are:
- Buffer overflow: This is a bottleneck where a process or a program writing to a buffer exceeds buffer memory and writes to other memory locations.
- Configuration parameters tuning: These are the parameters which are configured in the wrong manner, for example Max connections, Flow limit, and so on.
- Memory Leakage: This is a bottleneck where a process keeps on holding memory after use, even after the process or program has stopped running.
Let's take a look at SAR and KSAR reporting features:
- System Activity Report (SAR): SAR is a command line utility used to monitor Linux based systems you can monitor most of the performance counters using it. The data collected can further be analyzed to tune the application and increase performance of the application under test. The data presented by SAR reporting is in numerical format and doesn't have an interactive UI also, in case of monitoring multiple systems, each system will require a SAR instance to be run.
- KSystem Activity Report (KSAR): KSAR is the next version of SAR unlike SAR it has to download from SourceForge. It can work in a client server architecture where you are not required to install KSAR on every system you want to monitor. It also has a very interactive UI which can be used to view data in a better form helping you to analyze the performance results faster.
We have now studied how to monitor server-side resources for analysis purposes during a load test.