Panel data (spreadsheet-like data with several distinguishable rows and columns; the kind of data we generally encounter) is best handled by the DataFrame data structure available in pandas and R. Arrays can be used too but it would be tedious.
So what is a good example of data in real life that can be best represented by an array? Images, which are generally represented as multidimensional arrays of pixels, are a good example. In this section, we will see examples of multidimensional representation of an image and why it makes sense.
Any object detection or image-processing algorithm performed on an image requires it to be represented in a numerical array format. For text data, term-document matrix and term frequency-inverse document frequency (TF-IDF) are used to vectorize (create numerical arrays) the data. In the case of an image, pixel values are used to represent an image.
For a 100 x 50 pixel RGB image, there would be the following:
- 5,000 pixel values in one channel
- Three channels each for red, blue, and green
Hence, if you flatten the image pixels as one single vector, its length would be 15,000 (5,000 for each of the three channels). A grayscale image would contain a single channel. Each pixel value represents the degree of brightness for each channel.
A dataset of multiple images then becomes four-dimensional data representing the following:
- Width of the image in pixels
- Height of the image in pixels
- Number of channels
- Serial number of the image
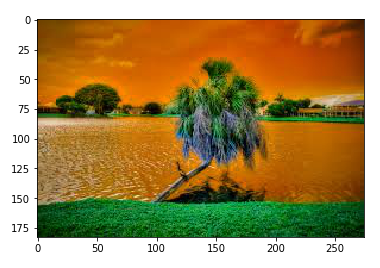
Let's verify the shape of the resultant image pixel arrays by reading an image. To work with images, a Python package called opencv (cv2) is quite helpful:
# reading images using opencv package
import cv2
import matplotlib.pyplot as plt
import os
os.chdir('')
img=cv2.imread('view.jpg')
img2=cv2.imread('rose.jpg')
The imread method returns an array of pixels. Let's check the object type of the returned object img:
print(type(img))
This returns <class 'numpy.ndarray'>, which confirms that it returns a numpy array.
Next, let's have a look at the shape of the array. It should return us the pixel width, pixel height, and number of channels:
img.shape
This returns (183, 275, 3).
It is a tuple of three numbers representing image height in pixels, image width in pixels, and number of channels. Hence, this image has a height of 183 pixels, a width of 275 pixels, and three channels of the dimension 183 x 275 representing red, blue, and green.
The img object looks as follows on printing:

Now the question arises, why would someone want to subset an array of image pixels? There can be multiple reasons for that:
- Selecting and/or manipulating a region of interest in the image. This can be a small block of the image representing an object.
- Selecting only one color channel from the image.
The array of pixels can be seen as a plot/image with pixel height and pixel width as the axes labels as shown in the following code:
plt.imshow(img)
Take a look at the following output: