
9
Measuring ROI in Employee Engagement With a Broad Focus
Home Furnishing Stores
![]()
This case was prepared to serve as a basis for discussion rather than to illustrate either effective or ineffective administrative and management practices. All names, dates, places, and organizations have been disguised at the request of the author or organization.
Abstract
This large chain of home furnishing stores with popular brands is pushing for more growth, increased profitability, and more talent performance. Although the chain is very successful, top executives and the HR team believed that better performance was possible, particularly if employees were more engaged. The concept of engagement was pushed beyond just being engaged with work but also being engaged with customers and the community. With this broader definition of engagement, the chain implemented a comprehensive revised employee engagement program with impressive results. The combination of making adjustments in responsibilities, changing the definition of engagement, and utilizing the creativity, experience, and smart thinking of employees was what made this program successful. Store managers were involved, a new engagement survey instrument was developed, e-learning was used to focus on seven components of engagement, workshops were conducted for both the employees and managers, and online support helped to deliver a very positive ROI to the executives.
BACKGROUND
Home Furnishing Stores (HFS) is a large international retailer for several major brands. Some brands exist within their major store name and locations; other brands represent stand-alone stores for the brand and integrate with the overall products. HFS operates in more than 20 countries with more than 40,000 employees. Customers can purchase items in the store, have items delivered to their home, or have items delivered to a pickup center. As with many other retailers, HFS is shifting to an e-commerce option and the executives want to make sure the same excellent customer experience that is offered in-store is also felt online.
HFS, which is traded on the New York Stock Exchange, has been a good investment for shareholders. However, in a very competitive industry, and with the ups and downs of global markets, HFS wants to place additional focus on making the stores more profitable and growing both the number of stores and the e-commerce platform. While there are many facets that drive store profitability and growth, most of it rests with the talent in the organization. Their focus is on the employees who work directly with the customers and procure their products (procurement) and who distribute the products to the various customers and locations (distribution centers).
Vision
There is usually some debate on which stakeholder group is more important to the success of the organization. Some would indicate that the investors are more critical because, without them, there is no company. The goal of the company is to provide a good return on investment through share price growth and dividends. Others would say that the customers make the difference. Without the customers, there are no sales and the goal is to attract great customers and keep them for a long time. Still, others would say none of this occurs without great talent in the stores, distribution centers, and procurement function. Together they make it work. The executives at HFS have indicated that while all three groups are important, improvements in the organization have to focus on the employees. The vision for HFS is for it to be truly a great organization. In simple terms, executives want HFS to be a great place to work. This is where employee engagement becomes a critical issue: The company has been a great place to work, but the executives want to make it better. Recent years have seen an excessive rise in employee turnover; executives want to increase engagement to lower turnover and continue to make the company one of the best places to work and attract the best and brightest in the future.
In addition, executives want HFS to be a great place to shop by providing the best customer experience possible, whether customers are in the store or online. They want customers to feel respected, engaged, and nurtured along the way—the same online experience that Zappos has enjoyed and has been reported in several references (Heish 2010). For the in-store sales they want the experience to be extremely pleasant and helpful to make customers return often, purchase more, and stay with them for a long time.
At the same time, with great talent providing a great customer experience, financial performance should follow, increasing the profitability of the stores and allowing investors to receive more return on their investment through dividend and share price growth. From the investment perspective, executives want HFS to be a top performing company. Still, the top executives, and particularly the CEO, wanted to do more. They wanted to make HFS an important part of the community and a great company for the community. This would entail focusing on not only issues such as local health, education, and low-income challenges, but also environmental projects.
Collectively when these four goals are achieved, a very important sustainable enterprise is developed: the vision for the organization.
The Value of Engagement
This new vision places a tremendous focus on employee engagement. The perception is that employee engagement would drive all three subsequent issues: a great place to shop, a great place to invest, and a great company for the community. Exhibit 9-1 shows the connection. By revising the engagement process to focus on broader issues beyond the scope of the work of one individual, the company will be able to achieve several important changes. When employees become engaged with the customer and encourage and support them, the customers become more valuable to the organization. This customer experience will improve customer satisfaction, the net promoter score (NPS), customer loyalty, and customer complaints.
EXHIBIT 9-1. The Value of Employee Engagement

Engagement should connect directly to sales growth, profit improvement, shrinkage reduction, improved efficiencies, and increased retention. These are classic outputs from employee engagement and should be a substantial part of the process to improve the organization’s financial performance.
Having employees become more involved and engaged in the community provides much support and assistance where stores are located and distribution centers are placed. Locally, they can help with education issues if employees volunteer for projects in school systems. They can work in low-income areas if the company sponsors projects aimed at uplifting people. And finally, HFS employees could help the environment by participating in recycling programs, efficient fuel consumption, energy conservation, and other important areas.
This perception of employee engagement provides a backdrop for major revisions in an employee engagement program in order to achieve these significant outcomes.
The Analysis
The HR team went about the process of making these changes. The team began with the end in mind, which were the goals shown in Exhibit 9-1, and asked a few questions, including “How can engagement make this improvement?” and “What must employees be doing in the future that they are not doing now that can have such an important impact on customers, financial performance, and the community?” This analysis involved several phases to make sure that an employee engagement program is the proper solution and is clearly connected to the business.
Stage 1: Review literature on engagement. Fortunately, there are many examples of outstanding companies that have been built on the shoulders of fully engaged, committed, and connected employees. These examples covered the three areas of customer experience, financial performance, and community performance.
Stage 2: Review the current status of engagement. Although HFS employees were already engaged and the company was already using standard engagement instruments, there was a feeling that this was not enough. This was because there wasn’t a broad enough definition of engagement, some of the existing scores were not where they should be, and some of the issues needed to strengthened beyond just engagement to include accountability and responsibility for success.
Stage 3: Form focus groups with employees. Several focus groups were conducted to see what employees thought might be possible after reviewing the proposed concepts to strengthen engagement. The focus groups met with great excitement and enthusiasm, and suggested some changes and adjustments that would make them better. This created a lot of interest in the program.
Stage 4: Form focus groups with managers. Although the store managers would work together throughout the process, the company held separate focus groups to see how management team would react to the program and to see what was feasible. It also wanted to know what the managers would support and achieve in the demanding environment of retail stores. Again, great input was received, which led to more adjustments to the process to make it better.
Stage 5: Conduct interviews with senior executives. Several interviews were conducted to show the draft of the program and how it linked to the business. With these inputs, the team was ready to design and implement the program.
THE APPROACH
Once employee engagement was redefined with its many facets, the process was ready for execution. The challenge was to introduce the program in a way that was meaningful and timely, and with ample support along the way.
Engagement Defined
Exhibit 9-2 shows the seven components of engagement that fit the new definition desired by the company: my role, my team, my customer, my responsibility, my career, my leadership, and my community.
EXHIBIT 9-2. The Components of Engagement

My Role: The beginning point is to redefine the role of work so that all employees can clearly see that they have many responsibilities in their work. They have to plan the work, they have to execute it, and they have to control that work. This involves checking progress, making decisions, and making changes. It is fundamental to engagement to have employees operating in a different way, being more involved in decisions, and checking their progress along the way.
My Team: The company had previously worked in teams in the stores, online, in distribution centers, and in procurement. Although all employees have individual responsibility, it is important for them to help one another and coordinate with the others. This involves continuous communication to share information with one another about the status of individual efforts. An important part of this process is supporting one another, filling in when necessary, and helping out when requested, which all works to make sure that the team functions extremely well as a unit.
My Customer: Here the focus is on working with customers. It is important for employees to provide great customer service in every way possible and inspire customers to have an amazing experience while they are in the store. This will encourage customers to refer others to the store, which will increase the net promoter score. Employees are also encouraged to show customers how to become more engaged. As customers become more involved in learning about products in the store, as well as providing input on new products and suggesting product changes, great things will happen. Customers will become a vast network of decision makers to help provide guidance in the future.
My Responsibility: Along with changes in work, team expectations, and customer expectations comes a change in responsibility and accountability. Here, the focus is not what they are doing as much as what the impact will be. The philosophy must be that the impact and not the activity is what makes a difference, whether it’s with the employees closing a sale, the customer returning often, or the investors realizing an improving return on their investment. This requires the outcomes to be clearly focused on improvements that will help the customers, investors, and the community.
My Career: HFS wants to have more internal promotions. To achieve this, career opportunities are provided for individuals to move up in stores, the regions, and the distribution centers and procurement. Career paths had already been developed, but now the focus will be on the employee taking initiatives. This is action is voluntary, suggesting that it will be helpful for the employees to work on their career. This begins with setting clear goals and working toward those goals with a career development plan that is carefully followed and routinely monitored. The key will be the manager’s role in providing feedback on progress and supporting employees in their career development efforts.
My Leadership: HFS recognizes that leadership is not just for those who are in leadership positions. Leadership is everywhere. Every person can exhibit leadership by influencing others and by serving as a role model of what should be done or the processes that should be completed. Leadership is also about supporting and serving others, earning respect along the way. Influence, support, and respect are an important part of everyone’s leadership dimension.
My Community: To ensure that each HFS location is an important part of the community, employees are encouraged to get involved in an area they would like to pursue. In some cases, some time off may be provided. In others, it’s a part-time responsibility. This will be coordinated by the corporate social responsibility team, with individual outcomes monitored along the way. The key is to be involved in some activity that will have an impact in the community that can be connected to their own efforts and influence.
Collectively these seven components provide a much broader definition of engagement, moving from typical engagement with the work itself to other dimensions of the team, the customer, the career, and the community.
Program Design
With a new definition of engagement, the challenge is to introduce the program to the entire team and make it successful in the organization. The program was designed in six steps, as shown in Exhibit 9-3.
EXHIBIT 9-3. Program Design

Before a program is rolled out in a new region or area, engagement data are collected using a preprogram survey. Following that, all employees take seven, 30-minute e-learning modules, each of which is aimed at one of the seven components of engagement.
Next, a full-day workshop for associates and managers is conducted. This is designed to provide an overview for the program, and provide feedback on the engagement survey data, which were collected from the employees and managers. It also serves as a quick review of the seven modules, ensuring that everyone has taken the e-learning modules and understands what is involved. Some limited skill practices are conducted, and the support that is available for them to use and reference is described, including the fact that their immediate manager will serve as a coach for the process. Expectations are defined and the concept of action planning is introduced. Action planning involves a particular team, usually led by a manager, and provides the associates and their managers with an opportunity to see how engagement is making a difference with customers, financial performance, and community performance.
The managers attend a second one-day workshop where the value of engagement is clearly outlined, along with tips on how to support the program and make it successful. They also learn how to be an effective coach to their employees. During the workshop they view best-practice videos that show some examples of the behaviors they need to support the seven modules. Some limited skill practices are also conducted with team managers. Finally, each manager selects a team and uses input from their team to choose two measures in the three areas to improve. This begins the action planning process.
The next component is on-the-job training, where the tools, information, and assistance is available to the participants through an engagement portal HFS developed. One-on-one coaching from the manager is available: It may be routinely scheduled or provided on an as-needed basis. Team meetings are often an important part of this program because they allow employees to discuss status, remove obstacles, and suggest enablers. The actions from the action plan are checked off as they are completed, until the desired impact is achieved.
Finally, two months after the program is introduced, a post-program engagement survey is conducted to show the difference between it and the preprogram version. Adjustments are made to the program as needed. Collectively, this design involves the key individuals who are required to make the program work, and it presents everything in a nonthreatening, unbiased way. The program is not focused so much on the performance of individuals, as it is on the performance of the program. Responsibilities and expectations are clearly part of the program and the focus is on having an impact, with engagement being the vehicle to achieve that impact.
EVALUATION APPROACH
HFS’s comprehensive engagement program is highly visible, linked to key business objectives, and requires substantial resources. These critical factors, along with the need to identify program successes and improvement opportunities, led to the implementation of an ROI evaluation study using the ROI Methodology. In addition to determining the extent to which the program was increasing engagement capabilities and positively affecting key business measures, the evaluation was positioned to help identify opportunities for improvement for further implementation throughout the organization.
ROI Methodology
A robust evaluation was planned to identify:
• reaction to the program by the associates and managers
• knowledge and skills gained through participation in modules
• success with the application of knowledge and skills in the workplace as associates are more engaged
• barriers and enablers to the application of the knowledge and skills
• business impact and return on investment of the engagement program.
This provided insight into what was working well with the program and opportunities for improvement. Furthermore, evaluation results helped communicate the program’s value to increase adoption once it becomes fully integrated into the organization.
The ROI Methodology serves as the structure for designing, planning, and implementing the evaluation study. This approach reports a balanced set of measures, follows a step-by-step process, and adheres to a set of guiding principles that are CEO- and CFO-friendly. These elements ensure a thorough and credible process for communicating the impact of the engagement program to key stakeholders.
The ROI Methodology approach begins with a fundamental framework of categorizing data, which represent measures that capture program success from the participant, system, and economic perspectives. Exhibit 9-4 presents the definition of each level of evaluation data. When combined with intangible data, these five levels tell the complete story of the engagement program’s success.
EXHIBIT 9-4. Evaluation Framework
Level |
Measurement Focus |
1. Planned Action |
Measures participant reaction to the program and planned action |
2. Learning |
Measures changes in knowledge and skills (engagement concepts) |
3. Application and Implementation |
Measures changes in actions and on-the-job behavior (engagement) |
4. Impact |
Measures changes in business impact measures |
5. Return on Investment (ROI) |
Compares the monetary benefits from the program to the costs of the program |
Because the engagement program was comprehensive with many activities, the evaluation required careful planning. Detailed data collection and ROI analysis plans were developed and are presented as Exhibits 9-5 and 9-6.
Data Collection
Exhibit 9-5 shows the data collection plan for this program, which starts with the objectives and defines the measures, data collection method, source, timing, and responsibilities. This is a classic plan for ROI analysis.
ROI Analysis Plan
Exhibit 9-6 presents the ROI analysis plan for this program, and represents a very common approach to this type of analysis. It begins with the business impact measures that are influenced by the program, with each participant selecting at least two measures to improve using the engagement competencies and skills. The method of isolation is the participant’s estimate of the program’s influence on the impact data. While creating a comparison group would be the best way to show the impact of the program, the experimental versus control group comparison was not feasible because when participants select different measures, matching groups would be almost impossible. With participant estimates, the data are collected in a nonthreatening, nonbiased way, and there are adjustments for error in their estimates. Standard items (presented later) provided to participants in the workshop or through experts are used to convert data to money.
Sampling Approach
With the program in place, the team wanted to evaluate the early users to judge the success and make any adjustments. The program was rolled out globally, although the United States had a bit of a head start. Although the program was rolled out to the entire workforce, the sample evaluation was limited to 198 people, composed of store associates and managers, who formed 28 teams after participating in one of 12 workshops. They each took the survey engagement before attending the workshop. A team could be as small as two people working close together on a project or as large as 10 or 12 people. The key was to have the team focused on the action plan process to improve two measures, which would be individual or team-based.
EXHIBIT 9-5. Data Collection Plan


EXHIBIT 9-6. ROI Analysis Plan

RESULTS
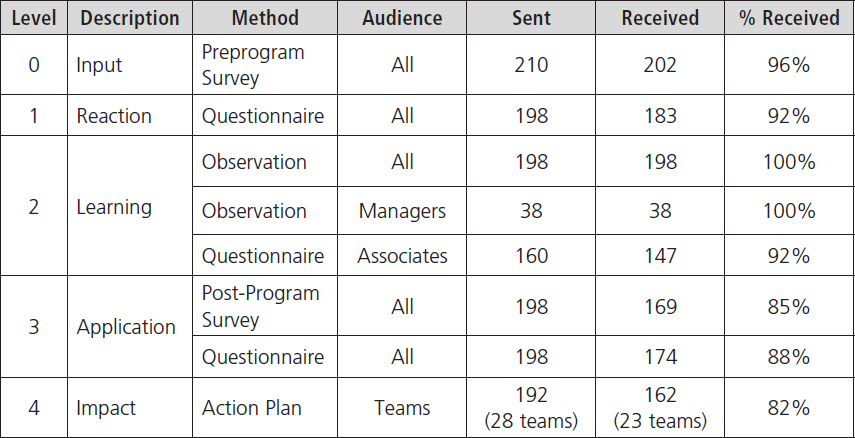
Exhibit 9-7 shows the data collection responses from all the planned data collection. The first part was the preprogram engagement survey, which targeted 210 people, of which 198 were in the first workshops. The pre-survey received 202 responses, representing 96 percent. During the workshop, several data sets were collected. First, reaction to the program and the concepts was collected, with 183 people providing the data (92 percent). For learning, the facilitator observed 198 associates and managers, and a subjective assessment was done to make sure the individuals were grasping the concepts and able to use them comfortably in their discussions.
In their workshop, the managers had more practice with the skills and were also observed by the facilitator, with a 100 percent “pass” rate. Although the end of each e-learning module captured some learning data, a questionnaire was used to capture learning data in the context of employee capability. While 160 of the associates received the survey, 147 of them completed it, for a response rate of 92 percent.
Two months later the post-program engagement survey was collected using the workshop participants as the target group. All 198 participants were sent the engagement survey and 169 people responded, for an 85 percent response rate. In addition, the same group received another questionnaire, which asked a few questions about the process; 174 people responded, representing 88 percent. Action plans were developed by 28 teams, with a total of 192 people participating. (Apparently, six people failed to connect with a team.) Four months later, 23 teams reported data with completed plans and five were either not available or did not provide the data. Thus, action plan data from 162 employees (84 percent) were provided, which represents 82 percent of the teams.
EXHIBIT 9-7. Data Collection Responses
Level 1 (Reaction) Results
Exhibit 9-8 shows how participants reacted to the program based on the data captured at the end of the workshop. This provided an opportunity for employees and their managers to clarify their reactions and provide responses. The group’s average reaction met or exceeded expectations (four out of five on a five-point scale). A total of 183 responded to this questionnaire, representing a 96 percent response rate. The responses from managers and employees were similar and are reported together. The technology effectiveness question (question 4) had a lower-than-expected result, which may reflect several technology glitches; for example, some participants had difficulty following the different modules and processes. Otherwise, the reaction to the program was very good, with “intent to use” being the star measure.
EXHIBIT 9-8. Reaction Results
Average Reaction |
|
The program is important to my success |
4.4 |
The program is important to HFS’s success |
4.4 |
The content is relevant to our needs |
4.4 |
The technology was user friendly |
3.8 |
The classroom session was a good investment of my time |
4.1 |
I would recommend this program to others |
4.2 |
The program was easy to follow |
3.9 |
I will use the content in my work |
4.5 |
The action plan was valuable |
4.2 |
*Using a 5-point scale (n = 183)
Level 2 (Learning) Results
The first measure of learning was the observation of the skill practices. Because employees had to repeat practices if the skills were unsatisfactory, all participants scored satisfactory, as reported by the facilitators (all passed). For associates, role plays were minimal, whereas they were significant for managers. Additional learning results were connected by having the participants rate the extent to which they have the capability to use those skills. This observation was completed during the workshop, and a total of 147 people responded. “My Leadership” and “My Community” received the lowest ratings, which is understandable because some employees were uncomfortable with leadership issues and involvement in their community.
EXHIBIT 9-9. Learning Results
Average reaction |
|
I am capable of using “My Role” concepts |
4.8 |
I am capable of using “My Team” concepts |
4.7 |
I am capable of using “My Customer” concepts |
4.4 |
I am capable of using “My Responsibilities” concepts |
4.1 |
I am capable of using “My Career” concepts |
4.1 |
I am capable of using “My Leadership” concepts |
3.9 |
I am capable of using “My Community” concepts |
3.8 |
*Using a 5-point scale (n = 147)
Level 3 (Application) Results
Exhibit 9-10 shows the application results collected two to four months after the workshop. It begins with the percent of teams completing action plans (82 percent), which was a very high number considering the detail involved in the actual planning process. The percent using coaching was a little less than expected, as well as those using the engagement portal. Although no objectives were set for portal use or coaching use, it was expected that almost all participants would use both. Pre- and post-engagement surveys (which each had 25 questions) showed gains, although the engagement skill sets were already there for many participants. The score of 3.6 is close to where it needs to be for success (four out of five). On the post-assessment, the results moved to a 4.5 for total skill assessment. The extent of use result just met the objective and was lower for frequency and success with use. The results shown are for a composite of all seven modules. The most valuable, least valuable, and most difficult engagement skills were what would be expected for this kind of process: career, leadership, and community, respectively.
EXHIBIT 9-10. Application Results
Percent responding |
|
Percent completing action plans |
82% |
Percent using the manager in a coaching |
51% |
Percent using the engagement |
61% |
Average for engagement survey (8 skills): (24 Survey Items) |
|
Pre |
3.61 |
Post |
4.52 |
For engagement skills—self assessment on a composite of seven modules |
|
Extent of use |
4.3 |
Frequency of use |
4.1 |
Success with use |
4.2 |
*Using a 5-point scale
Barriers and Enablers
Exhibit 9-11 shows the barriers to use. As expected, there were not many barriers. The greatest barrier was not enough time, which was anticipated given the time constraints for the e-learning and virtual modules. The other noted barriers were minor, ranging from technology to lack of support, although lack of support was in the acceptable range.
EXHIBIT 9-11. Barriers to Use
Percent responding |
|
Not enough time to make it work |
21% |
Program was too comprehensive |
14% |
Lack of support from regional manager |
8% |
Technology issues |
9% |
Doesn’t fit the culture |
7% |
Too difficult to use the concepts |
6% |
Other |
8% |
Also, as expected, the enablers were present with many of the participants, as shown in Exhibit 9-12. This is encouraging because of the high use of the skill and follow-through on the action plans. The greatest enabler was the value of the engagement concepts, which was relevant to managers and employees. Following this was manager support. However, it was anticipated that the engagement portal would be rated higher than it was.
EXHIBIT 9-12. Enablers to Success
Percent responding |
|
Valuable concepts |
77% |
Manager support |
71% |
Motivation |
62% |
Easy to use |
52% |
Team support |
31% |
Engagement portal |
24% |
Customer feedback |
19% |
Community response |
12% |
Other |
21% |
Level 4 (Impact) Results
Exhibit 9-13 shows the impact results in terms of the particular measures chosen by teams. Each team was asked to select at least two measures to improve using the engagement skills, concepts, and competencies in the program. By design, the measure should have a monetary value attached to it (or one that could be located easily). This eliminated the community measures, NPS, and customer loyalty.
EXHIBIT 9-13. Impact Results
Business Measures Selected |
Number |
Percent selecting |
New accounts |
11 |
21% |
Increased revenue from current customers |
9 |
17% |
Store profit margin |
7 |
13% |
Voluntary turnover |
6 |
12% |
Product returns |
4 |
8% |
Inventory shrinkage |
3 |
6% |
Direct store expenses |
3 |
6% |
Customer complaints |
2 |
4% |
Compliance discrepancies |
2 |
4% |
Other |
5 |
10% |
Each team was required to select at least two measures. A few managers selected three measures. (n = 52)
As expected, the most often used measure was acquiring new customers. HFS provided mechanisms to reach out to individuals who were not current clients, which was important for the teams, who selected that measure for improvement 21 percent of the time. The number 2 measure was increasing sales with current customers—including taking extra effort to up-sell, cross-sell, and entice current customers to visit the store more often and provide excellent service to make them buy more (17 percent of the managers selected this measure).
Increasing store profit margins was the next measure (13 percent), which was improved by controlling expenses, limiting waste, and avoiding price discounting or the need to give discounts to compensate for problems. Staff turnover came in fourth with 12 percent, although turnover at HFS is lower than a typical retail store. Product returns were reduced and 8 percent selected this measure. Returns occur when customers aren’t fully satisfied with the product they have purchased or the product has not lived up to expectations. Good customer service can reduce returns. Inventory shrinkage was another important measure for consideration with 6 percent. Controlling costs and reducing customer complaints were the next two measures (6 percent and 4 percent, respectively). Finally, some managers addressed the compliance discrepancies measure (4 percent). There were several other miscellaneous measures that were either unique to a particular store or an unusual problem that was not one of the key measures. A few ambitious managers selected more than two measures.
Isolating the Effects of the Program
To have a credible analysis, initial steps had to be taken to isolate the effects of the program from other influences. Given the sales and marketing metrics that were used, many other factors will affect these measures, which often leaves a program like this with only a minor part of the improvement. While several processes were considered, such as setting up a control group or using simple trend line analysis, the team settled on using estimates from the participants.
The estimates were collected on the action-planning document (see Exhibit 9-14, on the next page), with explanation in the workshop as to what was involved in the estimate and how important the issue was to the final analysis. In addition, the estimate was adjusted for error using a confidence estimate. Research has shown that estimates taken from credible people in a nonthreatening way are accurate and conservative.
Converting Data to Money
To determine the monetary benefits, each individual data item has to be converted for use to money. This has to be profit-added, costs reduced, or costs avoided. Exhibit 9-15 shows the measures that are driven in this program, along with the monetary value. These values were provided to the participants in the program, which means that it took almost no effort on their part to locate and use them in their action plan.
For new accounts, the marketing analytics section calculated the value based on the profit from the customer over the lifetime of the customer. In essence, if the customer stays active with the company for an average of five years, the company will make $650 in profit during that time. For the second measure, sales to current customers, the store operating profit margin is the value-add, which is averaging 20 percent.
EXHIBIT 9-15. Converting Data to Money
Data Item |
Value |
New account |
$650 |
Sales with existing customers |
20% margin |
Store profit margin |
All is value-add profit |
Staff turnover |
60% of annual salary |
Product returns |
10% of average sale |
Inventory shrinkage |
All is value-add profit |
Store expenses |
All is value-add profit |
Customer complaints |
$500 per complaint |
Compliance discrepancies |
$500-1500 |
EXHIBIT 9-14. Action Plan Focused on Obtaining New Accounts

The store profit margin is already converted to money and any increases in value are benefits. The staff turnover figure comes from external studies about the cost of turnover for the retail industry—it totals 60 percent of annual pay and is accepted within the company as a credible, conservative number. This figure includes all costs of recruiting selection and onboarding, as well as the disruption cost of voluntary turnover. The customer care center uses 10 percent of the average sale to calculate product return. The cost is based on assumptions that the items may be damaged and cannot be resold, the items always need to be restocked, and an adjustment may need to be made. Inventory shrinkage is reported as money lost because of lost inventory.
Store expenses are direct cost reductions and are value-added directly into the calculation. Customer complaints come from the customer care center and are investigated locally, regionally, and globally, if needed. The group uses a model that estimates a cost of $500 per complaint. This assumes the time to address the complaint, the cost of satisfying the customer (which sometimes includes waiving part or all of the charge), and the ill will caused by the complaint.
The cost of a compliance discrepancy varies depending on the compliance and issue. These involve store compliance regulations from the city, county, state, and federal government. It could involve safety, environment, labor, or other issues. The team was asked to contact the compliance department for the estimate.
Monetary Benefits
When changes in the impact measures identified in Exhibit 9-13 are adjusted for the effect of the program and converted to monetary values using the data in Exhibit 9-15, the monetary benefits are developed. The improvement is different from one store to another—23 teams comprising 162 people completed the action plans and every team’s task was to improve at least two measures. Unfortunately, five teams did not provide an action plan in four months. Although would be helpful to find out what happened, in terms of the analysis there is a very specific rule for addressing missing data: Guiding Principle 6 indicates that missing data get a zero in the process. Thus, the total benefits are adjusted based on the 23 teams and 162 individuals who provided data, but the cost is based on all 28 teams and 193 employees.
Exhibit 9-16 shows a one-page sample of 12 pages of data showing the improvements connected to this program. While it only represents 12 measures, it illustrates the variety of data represented in the program, and shows how the adjustments are made. Three other tables complete the 52 measures for the 23 teams.
Next, the first-year value of this measure is developed using the data conversion numbers in Exhibit 9-15. Although there could be some argument to suggest that this is a long-term program and that the benefits should be considered for a longer period, only the first year of benefits are calculated. This means that after the impact occurred, the amount was extrapolated for the entire year. Some may suggest that this is not credible because the data might not continue at that level for the entire first year. However, when considering that the vast majority of the team members will still be in their jobs the second, third, and perhaps even fourth year, there should be some benefit from this program as long as they are in that job. A multiyear benefit also could be used. However, because it is possible to take the prework, attend the workshop, and work the virtual process in a few weeks, this was considered a short-term solution, so only one year of impact was used. This is to be conservative, which is reflected in Guiding Principle 9. Exhibit 9-16 shows the monetary value for one year.
The contribution factor is the allocation to this program, because the team members provided a particular percent of the improvement that is directly related to the program. The next column is the confidence, which reflects the error in the allocation. Following the process, using Guiding Principle 7, the three values are multiplied to provide an adjusted value. When these are calculated for all 162 participants, including both measures, the total is 52 measures improved by at least some amount. With all of these totaled, the improvement is based on 52 measures valued to be $1,386,024.
The Costs
Exhibit 9-17 shows the costs allocated to this program, some of which were prorated just to this sample size. For example, the needs assessment cost was estimated to be approximately $25,000, which includes reviews, focus groups, and interviews. This amount involves the up-front analysis necessary to decide on the specific need for this program. This value is divided by the total employees to yield a cost per employee, and then multiplied by 192, which is the total in the sample.
The most significant cost was the development. Some content was purchased from a major supplier, an outside production company produced the videos, and other content was developed under contract with freelancers or by the L&D team. In total, the development and production costs for the materials and videos totaled $425,000. Separately, the development of the two workshops cost $35,000.
The content for the engagement portal was developed for approximately $75,000, and developing the seven e-learning modules was about another $84,000. These costs were prorated over the 40,000 employees to develop a cost per participant. The total costs allocated to this sample of 192 represent the cost per participant multiplied by 192. Exhibit 9-17 shows the prorated costs for these items. The cost of equipment and components were estimated to be around $12 per participant.
The coach’s time was allocated at a half day per participant, because not all participants used their coach, and others used the coach for more than half a day total. For participants, the costs were calculated by their time for a day, the time away from work for the e-learning modules, and any other virtual activities. A total of three days of time was used. Most participants also required a travel expense, although minor. The cost of trainers, facilitation and coordination, and facilities and refreshments were easily available.
EXHIBIT 9-16. Business Impact Data

EXHIBIT 9-18. Program Costs Summary
Needs assessment (prorated over all employees) $25,000 ÷ 40,000 employees = 0.625 × 192 |
$120 |
Program development and video production costs (prorated over all sessions) $425,000 ÷ 40,000 = 10.625 × 192 |
2,040 |
Content development for workshops (prorated over all sessions) $35,000 ÷ 40,000 = 0.875 × 192 |
168 |
Engagement portal (prorated over all sessions) $75,000 ÷ 40,000 = 1.875 × 192 |
360 |
E-learning programs (prorated over all sessions) $84,000 ÷ 40,000 = 2.1 × 192 |
403 |
E-learning components used by participants $12 × 192 |
2,304 |
Program materials $35 × 192 |
6,720 |
Travel and lodging: participants $390 × 192 |
74,880 |
Facilitation and coordination $6,000 × 12 days of facilitation, trainer, and coordination |
72,000 |
Facilities and refreshments 12 days at $220 per day |
2,640 |
Participants salaries plus benefits $734 × 192 |
140,928 |
Coaches’ salaries plus benefits $520 × 192 |
99,840 |
Overhead |
4,200 |
ROI evaluation $40,000 |
40,000 |
Total |
$446,603 |
In addition, an overhead cost for the total employee engagement team, including the L&D leadership not directly involved in the program, was estimated to be $4,200. The cost of the evaluation, which comprised the planning, data instrument design, data collection, analysis report writing, and briefings, was $40,000, including the cost of the briefings with travel. With all costs included, the total as indicated in Exhibit 9-17 is $446,603.
ROI Calculation
When the total monetary benefits from Exhibit 9-16 are compared with the total fully loaded costs from Exhibit 9-17, the calculations are as follows:

This is a very impressive ROI that greatly exceeds the objective of 20 percent. For every dollar invested in this program, it is returned plus another $2.10 in monetary benefits.
Intangible Benefits
The list of the intangibles connected with this project included teamwork, career satisfaction, net promoter score, customer loyalty, community image, reputation, brand, and reduction in carbon emissions. The participants were asked to indicate the extent to which these intangibles were influenced by the program. In order for a suggested intangible benefit to be included on this list, at least 10 percent of participants had to identify the influence as at least three out of five on a five-point scale. These intangibles represent an important data set for executives. If they were converted to monetary value, there would be even more value from this program and a higher ROI.
Credibility of the Data
When employee engagement is connected to the business in a program like this, there are always questions about the credibility of data. Here is what makes these data credible:
1. The business impact, which drives the ROI, represented actual store measures. They can be identified directly to the store and tracked and validated if necessary.
2. The participants selected the measures that were important to them with input from their immediate manager.
3. Participants had a desire to improve the measure, and took ownership in the program as they connected the skills of engagement to those important measures.
4. For participants who did not provide data (five teams in this case), there was an assumption that they received no value from the program. In reality, some of these individuals changed stores, either through promotion or transfer, and actually gained value despite not completing the project. However, the conservative approach is to use zero for them.
5. Only one year of improvement was recognized in the calculation. In reality, the significant change in engagement, which was validated with the data collection at Level 3, should provide value for a second, third, and even fourth year. However, to be conservative, only the first year was used.
6. All the costs were tabulated including time away from work. Some of these costs are debatable, but to be credible, every cost category was included.
7. Using participant estimates to isolate the effects of the program was not the most favored approach, but it is credible. The estimation was collected in a nonthreatening, unbiased way, and was adjusted for error.
8. A balanced profile of financial and nonfinancial, quantitative and qualitative data was presented. This provided executives with a great data set to make decisions about future implementation of the program.
COMMUNICATION OF RESULTS
With the results in hand, the data were communicated to the groups according to the communication plan. First, a live briefing was conducted with top executives and those responsible for the implementation of the program. In addition, briefings were conducted with regional executives during normal meetings and with the HR team. A three-page summary was sent to all store managers. The participants received a summary of the results shortly after they submitted them, as well as a summary of the changes made as a result of the program.
Based on the briefings with the executive team, the following adjustments were made:
• Improvements were made to make the technology easier and more reliable.
• The role of the participant’s manager was strengthened to make sure that proper measures were selected and any needed support was provided.
• The role of the coach was diminished.
• Some efforts were taken to strengthen the link between the engagement survey and the rest of the program. There was concern that the engagement survey was not tightly integrated into the program.
• Another group of participants (teams) would be monitored in six months to ensure that the programs were still working.
QUESTIONS FOR DISCUSSION
1. How did the company’s new definition of engagement influence the design of the employee engagement program?
2. Discuss the importance of getting participants committed to provide quality data.
3. Critique the evaluation, design, and method of data collection.
4. Is this case study credible? Explain.
5. How can this type of process be used to build support for programs in the future?
6. How can the outcomes of engagement be linked to your organization’s business objectives?
REFERENCE
Hsieh, T. 2010. Delivering Happiness: A Path to Profits, Passion, and Purpose. New York: Business Plus.