6
Pilot Sites: Success Stories and Learnt Lessons
6.1 Introduction
The operation of microgrids offers the possibility of coordinating distributed resources in a more or less decentralized way, so that they behave as a single producer or load in energy markets. In this way, the full benefits of distributed resources can be exploited in a consistent, manageable way. A method for a systematic analysis of these benefits including a quantified evaluation is provided in Chapter 7, but a number of real-world microgrids are already in operation worldwide [1,2] as off-grid applications, pilot cases and full-scale demonstrations. Significant experience and various lessons can be already learnt from these real-world operating microgrids of all types, that is, community/utility, commercial, industrial, institutional, campus, military and remote off-grid, including pilot projects and commercial scale demonstrations.
The aim of this chapter is to provide a non-exhaustive overview of real-world microgrids currently in operation across the world, specifically in Europe, the USA, Japan, China and South America. Many of these demonstrations have been presented in a series of dedicated microgrid symposiums held in Berkeley, California, USA (2005), Mont Tremblant, Quebec, Canada (2006), Nagoya, Japan (2007), Kythnos Island, Greece (2008), San Diego, California, USA (2009), Vancouver, BC, Canada (2010), Jeju Island, Korea (2011), Évora, Portugal (2012), Santiago, Chile (2013). Presentations and other materials from these events are available at [3].
A number of equally interesting microgrid applications, such as in Bornholm island in Denmark, Jeju island in Korea and off-grid microgrids in Canada, are not included, since it was clearly impossible to cover all efforts in such a dynamically developing field in a single chapter.
6.2 Overview of Microgrid Projects in Europe
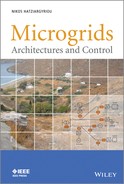
In the European Union (EU), microgrids form a key component in the Strategic Research Agenda for Europe's Electricity Networks of the Future [4]. In the past few years, substantial public and private investments have been made in R&D, demonstration and deployment activities in the smart grids area, including microgrids. Figure 6.1 shows a map of the 211 smart grid related projects running in EU27 at a total investment of ![]() 5 billion [5]. This amount includes more than
5 billion [5]. This amount includes more than ![]() 2 billion spent on smart meter rollouts. Besides the R&D activities in various projects related to microgrids, two major research efforts have been devoted exclusively to them. Within the 5th Framework Programme (1998–2002), the microgrid [6] activity was funded at
2 billion spent on smart meter rollouts. Besides the R&D activities in various projects related to microgrids, two major research efforts have been devoted exclusively to them. Within the 5th Framework Programme (1998–2002), the microgrid [6] activity was funded at ![]() 4.5 million. The Consortium, led by the National Technical University of Athens (NTUA), included 14 partners from seven EU countries, including utilities, such as EDF (France), PPC (Greece) and EdP (Portugal); manufacturers, such as EmForce, SMA, Germanos, Urenco and research institutions and universities such as Labein, INESC Porto, the University of Manchester, ISET Kassel and École de Mines. This project was successfully completed, providing several innovative technical solutions, including the development of:
4.5 million. The Consortium, led by the National Technical University of Athens (NTUA), included 14 partners from seven EU countries, including utilities, such as EDF (France), PPC (Greece) and EdP (Portugal); manufacturers, such as EmForce, SMA, Germanos, Urenco and research institutions and universities such as Labein, INESC Porto, the University of Manchester, ISET Kassel and École de Mines. This project was successfully completed, providing several innovative technical solutions, including the development of:
- DER models plus steady-state and dynamic analysis tools enabling simulation of LV asymmetrical, inverter dominated microgrid performance,
- islanded and interconnected operating philosophies,
- control algorithms, both hierarchical and distributed (agent based),
- local black start strategies,
- definitions of DER interface response and intelligence requirements,
- grounding and protection schemes,
- methods for quantification of reliability benefits,
- laboratory microgrids of various complexities and functionalities.
Figure 6.1 Geographical distribution of investments and project categories in EU. Source: JRC. Reproduced by permission of John Wiley & Sons Ltd
A follow-up project titled More Microgrids [7] within the 6th Framework Programme (2002–2006) was funded at ![]() 8.5 million. This second consortium, comprising 22 partners from 11 EU countries, was again led by NTUA and included manufacturers such as Siemens, ABB, SMA, ZIV, I-Power, Anco, Germanos and EMforce; power utilities from Denmark, Germany, Portugal, the Netherlands and Poland, and research teams from Greece, the UK, France, Spain, Portugal, FYROM and Germany.
8.5 million. This second consortium, comprising 22 partners from 11 EU countries, was again led by NTUA and included manufacturers such as Siemens, ABB, SMA, ZIV, I-Power, Anco, Germanos and EMforce; power utilities from Denmark, Germany, Portugal, the Netherlands and Poland, and research teams from Greece, the UK, France, Spain, Portugal, FYROM and Germany.
The achievements of this project include:
- investigation of new DER controllers to provide effective and efficient operation of microgrids,
- development of alternative control strategies using next generation information and communications technology,
- application of innovative protection methods,
- technical and commercial integration of multiple microgrids, including interface of several microgrids with the utility distribution management systems,
- studies of the impact on power system operation, including benefits quantification of microgrids at regional, national and EU levels,
- studies of the impact on the development of electricity network infrastructures, including quantification of the benefits of microgrids, to the reinforcement and replacement strategy of the ageing EU electricity infrastructure,
- field trials of alternative control strategies in actual installations, with experimental validation of various microgrid architectures in interconnected and islanded modes, and during transitions, testing of power electronics components and interfaces, and of alternative control strategies, communication protocols.
The change of scale from laboratories to real world pilot sites, realized by the More Microgrids project, has been a crucial step in drawing practical conclusions on different aspects of the operation and management of microgrids. The pilot sites include rural, residential, industrial and commercial microgrids in several countries. Two large laboratories were also used as pilot sites. This enabled field tests, which would have been risky to carry out on real-world microgrids. The Table 6.1 and Figure 6.2 give an overview of the pilot sites.
Table 6.1 European Pilot Microgrids
Figure 6.2 Pilot sites considered in the More-Microgrids project for field tests
Figure 6.3 Wide area view of the Gaidouromantra microgrid in Kythnos island
The following sections provide a description of the first three pilot microgrids mentioned in Table 6.1, the experimentation objectives at each pilot site, an overview of the results and some conclusions and lessons learnt.
6.2.1 Field Test in Gaidouromandra, Kythnos Microgrid (Greece): Decentralized, Intelligent Load Control in an Isolated System
The pilot microgrid electrifies an isolated settlement of 12 houses in a small valley of Kythnos, an island in the Aegean Sea, Greece (Figure 6.3).
The generation system comprises 10 kW of PV, a nominal 53 kWh battery bank and a 5 kW diesel genset. The aim of the system is to be 100% supplied by the solar energy produced by the PVs or stored in the batteries, so the diesel genset is only intended as a back-up unit, in case of prolonged cloudiness, or in emergency. A typical house with its PV is shown in Figure 6.4. A second PV array of about 2 kW, is mounted on the roof of the control system building. This is a house of about 30 m2 surface area, built in the middle of the settlement in order to house the battery inverters, the battery banks, the diesel genset and its fuel tank, the computer equipment for monitoring and the communication hardware, referred to as the system hut or system house (Figure 6.5). The 2 kW PV is connected to an SMA inverter and, along with a 32 kWh battery bank, they provide power for monitoring and communication. Residential service is powered by three Sunny Island battery inverters, connected in a parallel master–slave configuration, forming one strong single-phase circuit. This allows the use of more than one battery inverter only when more power is demanded by the consumers. Each battery inverter (SI4500) has a maximum power output of 3.6 kW. The battery inverters in the Kythnos system have the capability of operating in either isochronous or droop mode. The operation in frequency droop mode gives the possibility of passing information on to switching load controllers, in case the battery state of charge is low, and also to limit the power output of the PV inverters when the battery bank is full.
Figure 6.4 Typical house with PV on mountain slope
Figure 6.5 The interior of the system house
The electric system in Gaidouromantra is composed of the overhead power lines, a communication cable running in parallel to provide the monitoring and control needs. The grid and safety specifications for the house connections respect the technical solutions of the public power corporation (PPC), which is the local electricity utility. This decision was taken on the grounds that, potentially, the microgrid may be connected to the rest of the island grid.
The houses are supplied with single-phase electricity service, limited by a 6 A fuse. This means that each home can have lighting, a refrigerator, a water pump and some small electrical appliances. The residents were asked from the beginning to use high-performance appliances, such as fluorescent lamps and refrigerators with good insulation.
6.2.1.1 Objectives of the Demonstration
The primary goal of this demonstration was to test the decentralized control approach [8–10] described in Section 2.8. An agent-based load controller was designed and used to monitor the status of the power installation by taking measurements of voltage, current and frequency, in order to coordinate the energy management of the microgrid.
The objectives can be distinguished in technical and energy goals:
- The technical goal is to test a quite complex control system in a real environment. The Java-based MAS system has been tested in a real environment and occupied households. This means that the complex multi-agent system with all the functionalities (JADE platform, ontology, yellow pages capabilities, negotiation algorithm, coordination algorithm) should be installed and run smoothly for a long period of time.
- The electrical goals aim at the increase of energy efficiency by minimization of diesel generator usage and the shift of load consumption during hours of PV production excess. The goal is to encourage the operation of the most energy consuming loads, when there is excess of RES energy, and to curtail them when there is not enough energy in the batteries. The curtailment should be fair (equal) for all households, so the “greedy” houses should be curtailed first. A secondary goal of the demonstration is to maintain the comfort level in the settlement. Therefore, if a resident feels the need to operate the water pump, or another controllable appliance (load), the agents are required to interfere to the minimum possible extent with this decision.
6.2.1.2 Technical Installation
Each house in the Kythnos microgrid is equipped with a water pump (1–2 kW), which is used to supply water to the residents of the house. The water pump is typically the largest load in a house and is considered as non-critical. Therefore, in case of energy shortage, it should be disconnected if needed.
The main feature of the system is the intelligent load controller (ILC) that hosts the Java agents described in Chapter 2. The controller measures electrical values such as voltage, current and frequency, and can remotely control up to 256 power line communication (PLC) load switches connected at any place inside the house. Each ILC controls two PLC switches. The first PLC switch controls the water pump, while the second controls a power socket, and any load connected to it (e.g. air-conditioning unit). Also, the ILC features a Wi-Fi interface that enables it to wirelessly connect to a local area network (Figure 6.6). This eliminates the need of a data cabling infrastructure, and simplifies the installation of the units.
Figure 6.6 Communication among the load controllers
The core of the unit is an integrated computer module that runs the Windows CE 5.0 operating system. The integrated computer module is driven by the powerful Intel® XscaleTM PXA255 processor at 400 MHz and features 64 MB of RAM and 32 MB flash memory (instead of a hard disk drive). Thus, it is suitable for demanding applications.
The operating system supports the installation of a Java virtual machine, and an agent environment based on the JADE platform has been embedded in the controller. This way, along with the MGCC installed in the system house of the Kythnos microgrid, the first actual field test of multi-agent systems in a microgrid has been realized.
The ILC hosts an integrated web server, through which it is feasible to remotely control the operation of each controller. During the installation in the Kythnos microgrid, a broadband internet connection has allowed remote control through a virtual private network. As a result, commands have been sent and data exchanged among the ILCs, the MGCC and authorized users who were not required to be onsite.
Figure 6.7 shows how the ILCs are connected in the house electricity network. Each ILC unit is connected to the power line outside the house, between the energy (kWh) meter and the house's electrical panel. The PLC switches are installed inside the electrical installation of the household.
Figure 6.7 Connection of the load controller in the house electricity network. Reproduced by permission of the IEEE

Figure 6.8 shows pictures of the installed load controllers. For the installation of the ILCs, 5 houses were selected plus the System House where the battery inverters (Sunny Islands) are installed.
Figure 6.8 Installation of the load controllers outside the houses
6.2.1.3 Software Implementation
The key actors of the decentralized control system are the load agents and the MGCC.
Figure 6.9 presents the agent-based software topology. Each ILC hosts an agent. The microgrid central controller (MGCC) is housed in the system house. A PC hosts the agent platform and the software interfaces for communication with the Sunny web-box, a commercial product from SMA that hosts a web server and acts as a data logger for the PV or the battery inverters. These pieces of software form the multi-agent system.
Figure 6.9 The agent-based software topology
The MGCC is responsible for monitoring the operation of the microgrid and coordinating the load agents. Therefore, it gathers information about the amount of energy consumed and the amount of energy produced respectively, from the load agents (intelligent load controllers) and the inverters of the PVs and the batteries. The MGCC is also informed about which controllable loads are in operation every moment. The controllable loads comprise the two loads in each house equipped with a PLC switch. If the production units of the microgrid (i.e. the PVs and the batteries) are able to supply the requested power, then the MGCC takes no action. If the PVs are capable of producing more power than the loads request, then the MGCC sends a message to the batteries informing the relevant agents that there is a surplus of power. The agents controlling the batteries are able to decide if there is a need for the batteries to be charged, according to their state of charge.
If the loads on operation demand more power than the production units can offer, the MGCC informs the load agents that there is a need for load shedding. The ILCs, equipped with intelligent agents, and hence with communication skills, negotiate in order to decide autonomously which load will be disconnected from the grid.
Figure 6.10 illustrates the main steps of the algorithm.
Figure 6.10 The main steps of the MAS algorithm in Kythnos
Both the PV and the battery inverters employ droop control in order to adjust and coordinate their operation, as described in detail in Chapter 3. This functionality needs to be considered in the operation of the MAS system. A typical operation of the inverters is shown in Figure 6.11. In this case, the SOC of the battery is close to 100% and, as a result, the battery inverters increase the system frequency. It can be seen that the PV inverters understand that there is no need for more power in the system and they respond by reducing their production according to the droop curves.
Figure 6.11 The PV production affected by the SOC of the battery
It should be noted that the MAS needs to understand (perceive) the state of the environment, also taking into account that sometimes measurements might be misleading or conflicting. For example, in this case, the MGCC and the ILC should understand that there is available energy in the system and the low production of the PV inverters is caused by the droop action and not by a reduction in the solar irradiation. Therefore the system should allow the uninterruptible operation of all the controllable loads. The overall performance of the MAS system during three days of operation in a single house is shown in Figure 6.12. The MAS proceeds with load shedding during the period with lack of energy, but it allows operation when there is sufficient energy, shown by the fact that the frequency reaches 52 Hz.
Figure 6.12 Load shedding in a specific house (indicated with ellipses). Reproduced by permission of the IEEE.
6.2.1.4 Conclusions, Lessons Learnt and Technical Perspectives
The Kythnos microgrid was the first actual test site, where the MAS system for decentralized control of DER was implemented. Although the system is quite simple, this experiment constitutes the first attempt to use this technology in a real environment. An intelligent controller with an embedded processor hosted the agents. This device could be used for the MAS deployment in small or larger test sites to monitor and evaluate the behavior of the consumers. The hardware performance has been satisfactory and the algorithms could be processed fast enough. Minor technical problems concerning, for example, Wi-Fi signal losses due to the high levels of humidity, maloperation of the PLC switches, when the system frequency was above 52 Hz, could be solved with minor system modifications without affecting the citizens' comfort. It is clear that the MAS system developed is too complicated for the control application of just a few houses, and similar results could have been obtained by centralized control based on a simple set of “if…then…else” rules. The primary goal of the experiment, however, was to test techniques, such as negotiation algorithms, wireless communication and CIM-based ontology, for this application, and this has proven very successful. Moreover, further experiments have shown that the MAS technology offers great scalability for larger applications.
The main drawback of this technique is the high installation costs, including all the required electrical modifications in the internal electrical installations of the houses and the maintenance cost. This is one of the main debates in other EU projects. It has been shown that the knowhow required by the appropriate technical personnel should include ICT, as well as expertise in electrical installations. Furthermore, in some cases, the cost of the necessary electrical equipment required (electricity panels, switches etc.) can be comparable with, or even higher than, the cost of the load controller. This finding suggests that research efforts should further exploit internet technologies such Smart TV and smart appliances as described in Chapter 2.
6.2.1.5 Societal
Most of the citizens have accepted the system well and were very cooperative during the tests. They have allowed the installation of the intelligent controllers acting autonomously on their non-critical loads and they have accepted their cooperative behavior based on the equality principle of sharing the energy consumption. The MAS for energy optimization has provided the technical limitation and protection of the system to prevent overuse. This helped to maintain good relationships between the neighbours. The importance of involving or at least explaining to the users the operation of the system – and especially the negotiation process – cannot be overstressed. The graphical interface presented in Figure 6.13, has been used to demonstrate to the users the operational concept of the installed MAS in Kythnos. Clearly, in larger deployments, this task needs a dedicated effort undertaken by specialized personnel (customer service).
Figure 6.13 Simple electric diagram of the Kythnos microgrid
6.2.2 Field Test in Mannheim (Germany): Transition from Grid Connected to Islanded Mode
This field test site is an ecologically oriented residential estate in the Wallstadt district of Mannheim, Germany (Figure 6.14). It is considered as a key success factor for sustainable development to start awareness building with consumers and producers (pro-sumers) who have a positive attitude towards innovation and renewable energy. The selected settlement includes 580 households. The site includes several privately owned small photovoltaic systems (Figure 6.15) and one private Whispergen cogeneration unit. Further PV installations are in progress.
Figure 6.14 Map of the Wallstadt ecological estate. Courtesy: Dr. Frieder Schmitt, MVV, Germany
Figure 6.15 Typical house within the Wallstadt ecological estate. Courtesy: Dr. Frieder Schmitt, MVV, Germany
One measure for awareness building in preparation of the field test was the customization and installation of the display panel “VisiKid” at the entrance of the “Kinderhaus” in Mannheim-Wallstadt. VisiKid shows in real time, the current power level and how much energy has been produced by the PV panels (Figure 6.16). This intuitive explanation brings the timely value of energy from photovoltaic systems closer to parents and children.
Figure 6.16 The VisiKid panel, displaying the PV generation at the Kinderhaus entrance. Courtesy: Dr. Frieder Schmitt, MVV, Germany
The LV distribution grid represents a typical residential area with an intermeshed ring grid structure. It is fed from the MV grid via three 20/0.4 kV, 400 kVA transformers, and is operated in closed configuration. The LV grid, whose neutral is directly grounded at the MV/LV substation, is a three-phase network with distributed neutral. The LV voltage is 230/400 V (phase to neutral/phase to phase voltage) and the MV voltage is 20 kV. The apartments are connected to the electrical network by underground cables (Al 4 × 150 mm2). There are 27 distribution boxes and further underground cables, which complete the LV grid in Wallstadt. Within the More Microgrids project, the LV grid was modified in order to prepare it for optional islanding. The new distribution area, including all relevant loads, distributed generators and storage, is served by one transformer. Power quality and grid characteristics have been monitored since 2006.
6.2.2.1 Description of the Experiments and Evaluation Results
For awareness building, the socio-economic experiment “Washing with the sun” was successfully realized. This was used to evaluate the willingness of customers to change the usage of household appliances, such as washing machines, dishwashers and tumble-dryers, to promote the consumption of local and solar-produced electricity. In days of good solar production, a message was sent to the participants specifying a time interval with high solar production and recommending the use of appliances in this period. A total of 24 households participated and shifted their loads significantly.
Two sets of technical experiments have been achieved in Wallstadt:
- realization of seamless transition between grid connected and islanded mode,
- installations of software agents responsible for the management of loads, storage and generators.
Seamless Transition between Grid Connected and Islanded Mode
Within the grid segment just described, the team prepared the Kinderhaus to operate as a microgrid, comprising two PV systems with a Sunny-Backup System, controllable loads and adding sufficiently designed battery storage as buffer, able to supply 10 kW for 1 hour.
To prove the feasibility of an iterative switching from islanded to grid-connected mode and vice versa, an additional battery for stabilizing the frequency was installed, in combination with a system of inverters able to realize an islanded mode. This battery (48 V 105 Ah, 21 A for 5 h) has been used, in combination with a system for the single purpose of regulating the frequency, while switching to islanded mode.
The Sunny-Backup System was connected to part of the loads inside the Kinderhaus, and an islanded mode was flawlessly realized in two days. During the periods of islanded operation, the frequency increased from 50 to 52 Hz caused by the increased SOC of the batteries. After reconnection to the grid, the frequency quickly returns to the 50 Hz imposed by the dominance of the grid.
Multi-Agent System for Energy Management
These experiments focused on the management of loads exposed to fluctuating generation. A combination of the agents' management abilities and the necessary communication links between the agents and their corresponding generators and/or loads was provided by a power-line network. In the network, IP addresses were assigned for each load and generator involved. The experiments carried out have shown that it is possible to control flexible loads (e.g. air-conditioning units) by increasing or decreasing their total consumed power according to a defined percentage of photovoltaic power, virtually assigned to them.
The system implementation focused on the usage of the agent-based software as well the available equipment at the test site. The system architecture was designed taking into account the existing broadband power line (BPL) communication networks. Unlike in the Kythnos pilot site, distributed I/O modules were extensively used, and the agents were hosted on central PCs, so the agents were not situated near the loads. This is graphically shown in Figure 6.17.
Figure 6.17 The system architecture at Wallstadt
6.2.2.2 Conclusions, Lessons Learnt and Perspectives
The main achievement of this experiment is the technical feasibility of the successful transition between the grid-connected and islanded mode of operation and vice versa in an automatic and seamless way. A further achievement is the increase of energy efficiency, that is, energy demand reduction as a result of the automatic negotiation between agents. These results are complementary, since during islanded operation an efficient demand-side management reduces load and thus helps to stabilize the islanded grid.
The ability to work in islanded mode increases the security of supply and thus contributes to the sustainability goals. This might be less important for strong, meshed grids, but could be well studied in Mannheim under real conditions without endangering the power supply to customers. DSOs operating weaker grids could be interested to develop grid segments as microgrids that are able to run in islanded mode during times of congestion or grid failures.
The microgrid installations in Wallstadt are further used for educational and demonstration purposes. The demonstration has been integrated into the educational concept of the Kinderhaus. Renewable energy and the timely value of electricity is now part of the daily routine and the annual curriculum for the children. Further schools in Mannheim would like to follow the visualization and experiments realized at this Kinderhaus.
6.2.3 The Bronsbergen Microgrid (Netherlands): Islanded Operation and Smart Storage
This demonstration case was set up at the Bronsbergen holiday park near Zutphen (Figure 6.18) in the Netherlands. The holiday park comprises 210 cottages, of which about 100 have been fitted with PV systems. The peak power of all the PV systems together is 315 kW, whereas the peak load in the park is about 150 kW. The profiles of power exchange through the distribution transformer in the park have been measured extensively, as well as various power quality aspects. The presence of large amounts of PV generation introduces particular problems in the LV distribution system in the park, among which are very high 11th and 13th harmonic currents and voltages. This situation, combined with the fact that, in high summer, the daily electricity consumption is more or less equal to the daily PV generation, made an ideal opportunity to explore the advantages of local storage, in combination with the improvement of power quality. This microgrid was therefore selected by Continuon (now Liander) for tests with “smart storage” and islanded operation.
Figure 6.18 Aerial view of the city of Zutphen, showing the Bronsbergen holiday park
A flexible AC distribution system (FADCS) has been proposed to address the following existing problems:
- Zero-sequence currents – third harmonic currents from the PV inverters cause considerable currents in the neutral conductor of the three-phase system, resulting in circulating currents on the delta side of the distribution transformer.
- Harmonics – the PV inverters inject considerable amounts of harmonics into the network. Also, the combined input capacitance of all inverters, together with the inductance of the distribution transformer, causes the system to show a poorly damped resonance at around 650 Hz. This resonance is excited heavily by the inverters.
- Asymmetry – the predominantly single-phase loads and generators result in poor symmetry of the three-phase voltages.
Moreover, the FADCS can be combined with electricity storage in batteries, which will support the envisaged islanded operation. Sunlight has supplied a total of 720 battery cells, each rated 2 V/500 Ah. The cells have been placed in four containers of 180 cells each. The smart storage and FACDS have been designed based on the microgrid concept.
The experimentation involved the contribution of several industrial actors:
- Liander, the local distribution network operator, acquired the test cottage (Figure 6.19) right next to the distribution transformer and made the battery containers, all the cabling and the distribution panels.
- EMforce designed, manufactured and installed the inverters, the battery monitoring system and all control systems.
- Sunlight Systems manufactured and supplied the batteries.
Figure 6.19 Outside view of the cottage used as the system house
6.2.3.1 Objectives of the Demonstration
Before any equipment was built, the three partners compiled a project plan outlining the following seven objectives:
6.2.3.2 Description of the Pilot Site
In order to be able to perform the experimentation mentioned, a circuit breaker was installed between the MV/LV transformer feeding the holiday park and the main LV busbar. Also, a number of fuses and contactors were added in order to provide sufficient flexibility in the various operating modes needed for the tests. The single-line diagram of Figure 6.20 illustrates these modifications. Two fuse groups were used to connect the inverters to the microgrid. If no testing was going on, the microgrid could be connected directly to the transformer so that all equipment, including the circuit breaker, could be isolated and safely accessible for staff.
Figure 6.20 Schematic representation of the microgrid
The circuit breaker and the distribution board for the storage system were installed inside the system room (Figure 6.21), between the two inverter cubicles.
Figure 6.21 The system room with switchgear cabinet (center) and inverters
For reasons of size, weight and safety the batteries were installed in four purpose-designed containers, located in the “garden” of the cottage as illustrated in Figures 6.22 and 6.23.
Figure 6.22 View of the cottage and the battery containers. The distribution transformer is in the concrete box at the top right of the open container
Figure 6.23 Installation of the batteries

The microgrid was controlled by an MGCC, which is designed to send setpoints to the two inverters, and contains the logic for automatic disconnection and reconnection of the microgrid. The circuit breaker was set so that if disconnection was caused by a fault current, it would trip automatically. If the microgrid was islanded as a consequence of an MV disconnection, an islanding test algorithm, implemented in the MGCC, would have detected that event and instructed the circuit breaker to open.
The computer on which the MGCC was implemented also served as a platform for the battery monitoring system, which measured the voltage across each group of six battery cells. All measurements were logged on a second-by-second basis.
Each inverter was connected to a string of 360 cells connected in series, each rated at 2 V, 500 Ah. The rated voltage of a battery string was therefore 720 V.
6.2.3.3 Experiments
All experiments served to confirm the achievement of one or more of the objectives already mentioned:
- Parallel operation of inverters – it was shown that in islanded mode, two inverters could be run in parallel in a stable manner without any master–slave function. Changes in active and reactive power were shared equally between the two inverters.
- Fault level – in islanded mode (but with the cottages connected directly to the transformer to avoid inconvenience to the owners) many short-circuit tests were done on a single inverter and on two inverters in parallel, both with a low-impedance fault and a fault including a simulated cable resistance. A typical example of recorded voltages and currents during a low-impedance phase-to-phase fault is shown in Figure 6.24. In all cases, the inverters generated enough current to blow the 200 A fuses installed in the distribution feeder within 5 seconds.
- Battery management – proper operation of the battery agent was demonstrated. It was used every few weeks for an automatic recharge of the batteries in order to optimize their service life. Many tests were done to establish the charging and discharging characteristics of the batteries and to estimate the energy efficiency of the storage system over a simulated 24-hour cycle.
- Automatic isolation and reconnection, islanded mode – these properties were tested in conjunction. Automatic isolation on an MV fault was demonstrated by simulation, as it was not permitted to test this with an evoked network fault. Automatic islanding detection and subsequent isolation was demonstrated successfully by testing.
- Black start – it was demonstrated repeatedly that a single inverter is able to black start the complete microgrid. A typical result is depicted in Figure 6.25. Within three (50 Hz) periods, the voltage has reached its normal value. After the standard synchronization time, the second inverter then connects to the network automatically and takes its share of the load.
- Harmonics – it was verified that the high 11th and 13th harmonic voltages are significantly reduced by the inverters. During the tests in islanded mode, it was found that the considerable rectifier loads in the microgrid caused high 3rd, 5th and 7th harmonic voltages. Therefore, additional active compensation has been added to the inverters, which reduced the harmonic levels in both grid-connected and islanded mode to values below the planned levels.
Figure 6.24 Typical example of a phase-to-phase short-circuit test
Figure 6.25 Black start: phase voltages (top) and phase currents (bottom) supplied to the microgrid at the instant of the black start
6.2.3.4 Conclusions – Lessons Learnt
- Technical – all technical systems used in the microgrid were developed on the basis of the architecture proposed in the More Microgrids project [7] and proved to be very appropriate for smooth operation in both grid-connected and islanded mode, as well as during the transitions between the two.
- Economic – the cost of a system as built in Bronsbergen is too high from the perspective of economic feasibility. In particular, the batteries are very costly and have a limited service life. This must also be weighed against the very high availability of the public utility system in the Netherlands. In countries or regions with poor standards of electric reliability, the economic argument could be different.
- Operational – the most important lessons learned are related to the way the operation of microgrids has to be introduced into the operational systems of a distribution network operator. These new technologies require additional education of staff on management, planning and shopfloor level, as well as the development of a whole new set of operational standards and procedures. This is an item which is recommended as an essential part of any subsequent demonstration project.
- Environmental – grid-connected storage is an excellent way to harness the power generated by the PV systems in the microgrid. This avoids the necessity of upgrading the MV/LV transformer to cope with the high power generation during summer days at low load.
- Societal – it has not been easy to generate interest for these activities with the tenants of the cottages in the holiday park, although the project is happening on their doorstep. We have been successful in reducing inconvenience to them because Liander had the opportunity to acquire one cottage next to the MV/LV transformer and use it as a system house. The only visible technical items were the battery containers, located in the cottage's garden, which were painted green to minimize their visibility.
1. Hatziargyriou, N., Asano, H., Iravani, R., and Marnay, Ch. (July/August 2007) Microgrids: An Overview of Ongoing Research, Development and Demonstration Projects. Nr. 4, IEEE Power&Energy Magazine, pp. 78–94, Vol. 5.
2. Kroposki, B., Lasseter, R.et al. (May–June 2008) Making microgrids work. Issue 3, Page(s): 40–53, IEEE Power and Energy Magazine, Vol. 6.
4. http://ec.europa.eu/research/energy/pdf/smartgrids_agenda_en.pdf.
5. JRC Report, “Smart Grid projects in Europe: lessons learned and current developments ”. EUR 24856 EN, 2011.
6. “MICROGRIDS: Large Scale Integration of Microgeneration to Low Voltage Grids ”, ENK5-CT-2002-00610. 2003–2005.
7. “MORE MICROGRIDS: “Advanced Architectures and Control Concepts for More Microgrids”, FP6, Contract no.: PL019864. 2006–2009.
8. Chatzivasiliadis, S.J., Hatziargyriou, N.D., and Dimeas, A.L. (20–24 July 2008) Development of an agent based intelligent control system of microgrids. IEEE Power and Energy Society General Meeting.
9. Dimeas, A.L. and Hatziargyriou, N.D. (8–12 Nov. 2009) Control Agents for Real Microgrids. Curitiba, Brazil: 15th International Conference on Intelligent System Applications to Power Systems, ISAP'09.
10. Hatziargyriou, Nikos. (5–7 December 2011) Intelligent Microgrid Control. Manchester: IEEE Innovative Smart Grid Technologies (ISGT) Europe 2011.
6.3 Overview of Microgrid Projects in the USA
In recent years, the USA has become a leader in microgrid demonstration and technology development. The Department of Defense's (DOD) flagship microgrid project called Smart Power Infrastructure Demonstration for Energy, Reliability and Security (SPIDERS) and the Department of Energy's (DOE) grants given to nine microgrid demonstration projects have generated significant activity in the space, while other efforts in standards (IEEE 1547), technology (CERTS) and software (DER-CAM) have filled in key developmental gaps in the microgrid sector. In the absence of a federal clean energy policy, most states have been pursuing some form of clean energy legislation, with some positive developments for microgrids as well. This summary outlines the main R&D programs and demonstration projects as well as key developments in standards, technology and software in the USA, followed by a description of nine RDSI projects and three additional projects (Maxwell Air Force Base, University of California, San Diego and the Aperture Center).
6.3.1 R&D Programs and Demonstration Projects
The two major R&D and demonstration programs going on currently in the USA are SPIDERS, co-run by DOE, DOD and Department of Homeland Security (DHS) and the Renewable and Distributed Systems Integration (RDSI) microgrid grants program, run by DOE. While the goal of the SPIDERS program is to address energy security and reliability concerns, the RDSI grants are primarily focused on increasing the use of distributed energy during peak load periods to prove the value of microgrids for utility load shedding.
The goal of SPIDERS is “to reduce the ‘unacceptably high risk’ of mission impact from an extended electric grid outage by developing the capability to maintain energy delivery for mission assurance.” SPIDERS will seek to demonstrate the following technologies at specific military base locations:
- cyber-security of electric grid – virtual secure enclave
- smart grid technologies and applications – advanced metering infrastructure, substation and distribution automation, two-way communications and control
- secure microgrid generation and distribution – islanding control system, seamless grid synchronization
- integration of distributed and intermittent renewable sources – PV, wind, solar, fuel cell, biofuels
- demand-side management – automated load shedding, smart sockets
- redundant backup power systems – batteries, vehicle to grid, other fuel sources
The timeline for the project rollout can be seen in Figure 6.26, with three project sites planned for Hickham Air Force Base (Hawaii), Fort Carson (Colorado) and Camp Smith (Hawaii) – see the map of Figure 6.27. The total three-year budget for the project is $39.5 million. The preliminary design for the Hickam base has been completed, while conceptual designs for Fort Carson and Camp Smith are in progress, with Requests for Information having been issued to dozens of potential industry partners. Once the three demonstrations have been completed, DOD hopes to create a template for implementation across the armed forces, as well as working with the National Institute of Standards and Technology (NIST) on technology transfer for the commercial sector and national grid cyber security. These military projects were preceded by a microgrid project at the Maxwell Air Force Base.
Figure 6.26 SPIDERS implementation plan [4]. Source: DOD 2011, contact: Jason Stamp, Sandia Labs. Sourced from DOD PPT: http://e2s2.ndia.org/schedule/Documents/2012%20Abstracts/Breakout%20Sessions/14191.pdf. Reproduced by permission of Jason Stamp
Figure 6.27 Map of DOE RDSI projects
The goal of DOE's RDSI project is to demonstrate at least 15% peak demand reduction on the distribution feeder or substation level through integrating DER, and demonstrate microgrids that can operate in both grid parallel and islanded modes. If these goals are met, then many co-benefits will be realized, including increased grid reliability, deferment of utility transmission and distribution (T&D) investment, increased customer energy efficiency and decreased carbon emissions. Nine projects were selected in 2008 as part of the RDSI project, which has a total DOE budget of $55 million, with the total value exceeding $100 million with participant cost share. A full outline of the projects, including title, location and technologies used, can be found in Table 6.2.
Table 6.2 U.S. DOE Renewable and Distributed Systems Integration (RDSI) project list
| Project lead and title | Location | Technologies/features |
| Chevron Energy Solutions – CERTS microgrid demonstration | Santa Rita Jail, CA | large-scale energy storage, PV, fuel cell |
| SDG&E– Beach Cities microgrid | Borrego Springs, CA | DR, storage, outage management system, automated distribution control, AMI |
| University of Hawaii – transmission congestion relief | Maui, HI | intermittency management system, DR, wind turbines, dynamic simulations modeling |
| University of Nevada Las Vegas –“Hybrid” Homes: dramatic residential demand reduction in the desert southwest | Las Vegas, NV | PV, advanced meters, in-home dashboard, automated DR, storage |
| ATK Space Systems – powering a defense company with renewables | Promontory, UT | hydro-turbines, compressed air storage, solar thermal, wind turbines, waste heat recovery system |
| City of Fort Collins – mixed distribution resources | Fort Collins, CO | PV, bio-fuel CHP, thermal storage, fuel cell, microturbines, PHEV, DR |
| Illinois Institute of Technology – the perfect power prototype | Chicago, IL | advanced meters, intelligent system controller, gas fired generators, DR controller, uninterruptable power supply, energy storage |
| Allegheny Power – WV super circuit demonstrating the reliability benefits of dynamic feeder reconfiguration | Morgantown, WV | biodiesel combustion engine, microturbine, PV, energy storage, advanced wireless communications, dynamic feeder reconfiguration |
| Con Ed – interoperability of DR resources | New York, NY | DR, PHEVs, fuel cell, combustion engines, intelligent islanding, dynamic reconfiguration and fault isolation |
6.3.1.1 Other Research Efforts
Given the strength of the research community among laboratories, universities and companies in the USA, a number of other research efforts in technology, software and standards have helped push the USA to the forefront of microgrid development.
The Consortium for Electric Reliability Technology Solutions (CERTS) runs a microgrid test bed facility in conjunction with American Electric Power in Groveport, OH, as well as a laboratory simulator at the University of Wisconsin, Madison. The consortium is currently focused on finding ways to accommodate intermittent distributed renewable energy sources within existing utility distribution systems and to find ways in which microgrids can seamlessly connect to and island from the grid. Currently, CERTS is adding multiple hardware units to its test bed facility, including:
- CERTS compatible conventional synchronous generator
- flexible energy management system for dispatch
- intelligent load shedding
- commercially available, stand-alone electricity storage device with CERTS controls
- PV emulator and inverter with CERTS controls.
CERTS technology has been applied in other microgrid projects around the USA, such as the Santa Rita Jail project led by Chevron Energy Solutions.
In the area of software development, the Distributed Energy Resources Customer Adoption Model (DER-CAM) has been developed by researchers at Lawrence Berkeley National Laboratory (LBNL) to predict and optimize the capacity, and minimize the cost of operating distributed generation and CHP for individual customer sites or microgrids. Based on specific site load (space heat, hot water, gas, cooling and electricity) and price information (electricity tariffs, fuel costs, operation and maintenance costs etc.), the model makes economic decisions on the distributed generation or CHP technologies that the user should adopt and how that technology should be operated. A schematic for DER-CAM can be seen in Figure 6.28. The model has been used internationally for about 10 years now.
Figure 6.28 DER-CAM functionality
Also in the area of software development, Energy Surety Micro-grids (ESM) is an assessment tool, with some similarities to DER-CAM and an eye towards assessing the possible application of microgrids at military bases. ESM uses a risk assessment methodology for the critical power delivery functions and needs of military bases, hospitals or communities. To assess the specific military applications, the US Army Engineer Research and Development Center (ERDC) has teamed up with Sandia National Laboratories to look at how microgrids can be implemented, not only at home bases, but also in field applications, such as forward base camps and tactical operation centers. So far, 12 bases across the USA have been evaluated, with more in the pipeline.
Finally, the USA has been a leader in common standards development for interconnection of DER to the grid, as well as islanding standards for microgrids. The development of these standards has streamlined business and safety operations for many projects and states trying to form regulations in these areas. In 2003, after five years of development, the IEEE 1547 Standard for Interconnecting Distributed Resources with Electric Power Systems was published with the goal of creating a unified technical requirement at a national level. In 2011, also after many years of drafting, the IEEE 1547.4 Guide for Design, Operation and Integration of Distributed Resources Island Systems with Electric Power Systems was published, covering microgrids and intentional islands. This standard is critical for the successful development of microgrids, and many state utility commissions will likely use it as principal guidance for any microgrid support policies they develop.
6.3.1.2 Policy Support
Although federal targets for renewable energy, distributed generation and microgrids are absent (Obama's administration has set a notional goal for 80% clean energy by 2035), federal policies have laid the groundwork for successful state policies in renewable energy and distributed generation. In 1978, the Public Utility Regulatory Policy Act (PURPA) requires that all electric utilities purchase all output of distributed generation projects and provide on-grid and backup services to all qualified distributed generation projects. The US Energy Policy Act of 2005 stipulated standard practice for net-metering and time-of-use metering. The Federal Energy Regulatory Commission (FERC) stipulated standards for interconnection of distributed energy generation projects (less than 20 MW) in 2006. Over the past decade, 44 states have established net-metering and interconnection policies, while 30 states have established renewable portfolio standards (RPS), although the strength of these net metering and RPS policies varies widely. A handful of states have specific carve-outs for distributed energy including Illinois, New Mexico and Arizona. Also, there are regional cap and trade programs running for the power sector in northeast USA (Regional Greenhouse Gas Initiative) and California (AB-32). In particular, California's cap and trade program may provide a promising environment for more development of CHP and microgrids. California municipal utilities have set tariffs for distributed renewable energy generators (not more than 3 MW) that are “strategically located and interconnected to the electrical transmission and distribution grid in a manner that optimizes the deliverability of electricity generated at the facility to load centers.” Under this law, any utility that purchases the output from qualifying generators must ensure that its tariff “reflects the value of every kilowatt hour of electricity generated on a time-of-delivery basis, and shall consider avoided costs for distribution and transmission system upgrades, whether the facility generates electricity in a manner that offsets peak demand on the distribution circuit, and all current and anticipated environmental and greenhouse gases reduction compliance costs.”
6.3.2 Project Summaries
6.3.2.1 Chevron Energy Solutions – Santa Rita Jail CERTS Microgrid Demonstration
Santa Rita Jail is the third-largest jail1 in California and the fifth largest in the USA. The jail houses up to 4500 inmates and is located in Dublin, California, about 75 km east of San Francisco (Figure 6.29). Due to a series of installed DER and efficiency measures at the jail, it is often referred to as the “Green Jail.” The aim of the microgrid project there is to demonstrate the first implementation of the CERTS microgrid technology, combined with large-scale energy storage, new and legacy renewable energy sources and a fuel cell. The goals as outlined by Alameda Country (the local county government in charge of the jail) are as follows:
- reduce peak electrical load and monthly demand charges
- store renewable and fuel cell energy overproduction
- shift electrical loads to off-peak hours
- improve grid reliability and reduce electrical voltage surges and spikes
- enable the jail to be a net-zero electrical facility during the most expensive summer peak hours
- expand the jail's onsite generation capacity to include three renewable energy sources: solar PV, wind turbines and solar water heaters.
Figure 6.29 Recent photo of Santa Rita Jail, with ground mounted tracking solar PV in the foreground and batteries and fuel cell directly behind
Over the past decade, the project has implemented various energy efficiency measures and installed a wide array of distributed energy technologies, which have slowly accumulated into a full microgrid. In the spring of 2002, the jail installed a 1.2 MW rated rooftop PV array, followed in 2006 by a 1 MW molten carbonate fuel cell (MCFC) with CHP capability. Most recently, with the aid of DOE and California Energy Commission (CEC) grant money, as well as funding and participation from industry partners Chevron Energy Solutions, Satcon Power Systems and Pacific Gas and Electric, the jail has gained full microgrid capabilities with the installation of a large 2 MW, 4 MWh lithium-iron-phosphate battery, an islanding switch and associated power electronic upgrades.
In addition to generation equipment, the jail has also implemented a series of building equipment retrofits to improve efficiency and reduce peak electricity demand. A T-8 lighting ballast retrofit completed in 2009 was estimated to save 225 kW from the peak power demand and 1.34 GWh of electricity annually. Second, the 2010 installation of induction lighting in day rooms will save 217 kW peak power and 1.55 GWh annually. These two measures represent a 15% savings in peak power at the jail. Also, a number of other efficiency improvements were implemented in the middle of the 1990s targeting HVAC systems, lighting, refrigeration and other end-uses, which altogether decreased peak demand by 912 kW. Among them, an upgraded chiller took an estimated 423 kW off the peak power demand. The jail also plans to install a roof-mounted solar-thermal system which, when operational, will provide 40% of its hot water needs.
Lawrence Berkeley National Laboratory (LBNL) has also been an active partner with the jail, using its DER-CAM model a number of times throughout the development of the microgrid, to analyze electricity and heat requirements and to develop plans for the jail to meet its needs at minimum cost. Also, battery chemistries were compared, operating schedules that minimized risk were developed and opportunities for participation in demand response and ancillary services markets are now being analyzed.
6.3.2.2 SDG&E – Borrego Springs Microgrid Technologies Used
Borrego Springs is a small residential community located 90 miles northeast of San Diego. The microgrid there can be described as a utility-scale microgrid with its primary partner being San Diego Gas and Electric (SDG&E) and its primary focus is on smart grid service delivery models (Figure 6.30). The goal of the project is to provide a proof-of-concept test as to how information technologies and distributed energy resources (solar PV and batteries primarily) can increase utility asset utilization and reliability. The community already had many rooftop solar PV systems installed and is a somewhat isolated area fed only by a single sub-transmission line. Islanding of the entire substation area is being explored.
Figure 6.30 Schematic of SDG&E Borrego Springs microgrid project [17]. Source: Tom Bialek, SDG&E, 2011. http://energy.gov/sites/prod/files/EAC%20Presentation%20-%20SGD%26E's%20Microgrid%20Activities%2010%202011%20Bialek.pdf. Reproduced by permission of Tom Bialek
The project's partners include Lockheed Martin, IBM, Advanced Energy Storage, Horizon Energy, Oracle, Motorola, Pacific Northwest National Laboratories and University of California, San Diego. DOE supported the project with $7.5 million of federal funding, with additional funding coming from SDG&E ($4.1 m), CEC ($2.8 m), and other partners ($0.8 m).
The total microgrid installed capacity will be about 4 MW, with the main technologies being two 1.8 MW diesel generators, a large 500 kW/1500 kWh battery at the substation, three smaller 50 kWh batteries, six 4 kW/8 kWh home energy storage units, about 700 kW of rooftop solar PV and 125 residential home area network systems. The project will also incorporate feeder automation system technologies (FAST), outage management systems and price driven load management.
6.3.2.3 University of Hawaii – Transmission Congestion Relief
Hawaii is an ideal site for microgrids with its high energy costs, heavy reliance on oil, significant reliability issues and abundant renewable energy resources (solar, wind, tide and wave). The University of Hawaii's microgrid project's main goal is to develop and demonstrate an integrated monitoring, communications, data base, applications, and decision support solution that aggregates distributed generation (DG), energy storage, and demand response technologies in a distribution system. The project will produce benefits for both the distribution and transmission systems, including reduced transmission system congestion, improved voltage regulation and power quality within distribution feeders, accommodation of the increase in distributed solar PV, better management of short-timescale intermittency from wind and solar energy, and provision for management of spinning reserve or load-following regulation. The Maui Electric Company (MECO) typically uses diesel-based generators for both conventional generation and reserves, but the growth in distributed generation – solar PV in particular – offers unique opportunities for microgrid applications (Figure 6.31).
Figure 6.31 Project integration for Maui Electric Company demonstration at Wailea substation. Source: Hawaii Natural Energy Institute of the University of Hawaii [2]

The project is under the leadership of the Hawaii Natural Energy Institute (HNEI) of the University of Hawaii. The project team includes Maui Electric Company Limited (MECO), Hawaiian Electric Company, Inc. (HECO), Sentech (a division of SRA International, Inc.), Silver Spring Networks (SSN), Alstom Grid, Maui Economic Development Board (MEDB), University of Hawaii-Maui College (UH-Maui College), and the County of Maui. The project was supported by $7.0 million in funding from DOE and $9.0 million from the industry partners. Key technology focuses for the project include home area networks, advanced metering infrastructure, distribution management systems and distribution monitoring, and battery energy storage systems. The project has two phases. In Phase 1, energy management architecture for achieving project objectives will be developed and validated. In Phase 2, these capabilities will be demonstrated at a MECO substation at Wailea on Maui.
6.3.2.4 University of Nevada Las Vegas –“Hybrid” Homes: Dramatic Residential Demand Reduction in the Desert Southwest
The RDSI project hosted by the University of Nevada Las Vegas (UNLV) is looking at dramatic demand reduction with highly energy-efficient homes that also use rooftop solar PV in a 185-unit housing development in northwest Las Vegas (Figure 6.32). The goal of the project is to decrease peak electrical demand for the new housing development by as much as 65% compared to basic codes. The homes, which are built to LEED platinum standards, utilize advanced metering technology, advanced wireless mesh network technology, Energy Star appliances, low-E windows, tankless water heaters and other smart grid and efficiency technologies. The project also incorporates battery storage at substations and small battery banks in several homes.
Figure 6.32 Rooftop solar PV systems that are a part of UNLVs RDSI energy efficiency homes project [2]
The homes' building partner, Pulte Homes, is working in conjunction with UNLV and Nevada Energy (local utility) on the project. They received $7.0 million in federal funding from DOE matched with $13.9 million in funds from the Pulte and Nevada Energy. For Nevada Energy, much of the funding came in the form of rebates through its Cool Share, Energy Plus and Zero Energy Home programs. Nevada Energy is also looking at dynamic pricing programs to make instantaneous power prices and cost incentives for demand reduction available to these homes.
6.3.2.5 ATK Space Systems – Powering a Defense Company with Renewables
ATK Space Systems is a large defense and aerospace manufacturing company in Magna, Utah, employing over 1500 people in 500–600 buildings (Figure 6.33). The main goal of the project was to develop and demonstrate a diverse system of renewable and storage technologies that are integrated into an intelligent automation system with two-way communications to the utility to produce an on-demand reduction of 15% of substation load.
Figure 6.33 Birdseye view of ATK Space Systems [2]
The main partners in the project include P&E Automation and Rocky Mountain Power (local utility). Funding includes $1.6 million from DOE and $2.0 million from industry partners. The peak demand of ATK Space Systems facilities is typically between 15–20 MW. The project already had 10 MW of on-site standby diesel generators for main grid event outages. This project's scope only includes a small portion of the company's total demand. Automated controls are expected to reduce the facility's electric demand by 3.4%, while battery storage and renewables will be dispatched during peak periods to avoid costs. The project will incorporate 100 kW of wind generation, 100 kW of waste heat generation and 1200 kWh of chemical-battery electrical storage.
6.3.2.6 City of Fort Collins – Mixed Distribution Resources
The Fort Collins Microgrid in Colorado is part of a larger project known as FortZED (Fort Collins Zero Energy District). The main goals are to develop and demonstrate a coordinated and integrated system of mixed distributed resources for the City of Fort Collins, reduce peak loads by 20–30% on multiple distribution feeders, increase the penetration of renewables and deliver improved efficiency and reliability to the grid and resource asset owners. The microgrid project is one of a kind as it involves multiple customers such as the New Belgium Brewery (Figure 6.34), InteGrid Laboratory, City of Fort Collins facilities, Larimer County facilities and Colorado State University, as well as various kinds of distributed energy generation technologies. Other technology partners in the project include Eaton, Advanced Energy and Brendle.
Figure 6.34 Rooftop solar PV installation on New Belgium Brewery
Technologies in the project include solar PV, CHP, microturbines, fuel cells, plug-in hybrid electric vehicles, thermal storage, load shedding and demand-side management. The peak demand of all customers is about 46 MW, while the combined distributed generation and load shedding capabilities is only 5 MW. The project has received $3.9 million in funding from DOE and $7.2 million from the various industry partners.
6.3.2.7 Illinois Institute of Technology: Perfect Power Prototype
There have been a number of drivers for the Illinois Institute of Technology (IIT) to construct the perfect power prototype (Figure 6.35). First, the occurrence of at least three power outages per year resulted in a series of teaching and research disruptions with an estimated cost of $500 000 annually. The campus was also facing growing demand for energy, and the need to add infrastructure to accommodate its growth, update costly old infrastructure, improve energy efficiency and reduce consumption. IIT, in collaboration with the Galvin Electricity Initiative (GEI) and other key partners, is leading an effort to develop and validate innovative smart grid technologies and demonstrate smart grid applications, community outreach and renewed policies for better serving the consumers. This microgrid is sponsored by $7 million of federal funds (DOE) and $5 million of industrial funds over five years. Its main purpose and objectives are to create a self-healing, learning and self-aware smart grid that identifies and isolates faults, reroutes power to accommodate load changes and generation and dispatches generation and reduces demand based on price signals, weather forecasts and grid disruptions.
Figure 6.35 Diagram of IIT perfect power prototype [18]. Reproduced by permission of Mohammad Shahidehpour
The IIT prototype will be the first of a kind of integrated microgrid system that provides for full islanding of the entire campus load, based on PJM2/ComEd market signals. Specific innovative technology applications include: high reliability distribution system, intelligent perfect power system controller, advanced ZigBee wireless technology, advanced distribution recovery systems, buried cable fault detection and mitigation.
The peak load of IIT's campus is around 10 MW. Their on-campus DER includes two 4 MW combined cycle gas units and a small wind turbine, with plans to add rooftop PV, as well as a 500 kWh battery. Total DER capacity would then be close to 9 MW, so the campus would be able to operate as an island most of the time, not importing any power from the grid. Full islanding capability has also been tested.
The campus is located near Comiskey Park, where the Chicago White Sox play, and IIT is involved in their load reduction program during baseball games, for which they receive significant payments. IIT invested $3 million in smart meters to be able to record how much load is being used in various buildings. Three levels of hierarchy are being implemented to control loads: a campus controller (being internally developed), building controllers (Siemens) and sub-building controllers (ZigBee). Around 20% of IIT's load can be shed with the potential to reduce peak load by up to 50% on demand, and achieve a 4000 t/a reduction in carbon emissions. IIT has put out a request for proposal for demand response for 25% of the campus's total load.
6.3.2.8 Allegheny Power – WV Super Circuit, Demonstrating the Reliability Benefits of Dynamic Feeder Reconfiguration
Located in Morgantown, West Virginia, the WV Super Circuit project seeks to demonstrate improved electricity distribution system performance, reliability and security of electricity delivery through the integration of distributed resources and advanced technologies (Figure 6.36). Partners in the project include the Allegheny Power (utility), Science Applications International Corporation, West Virginia University Advanced Power and Electricity Research Center, Intergraph, North Carolina State University, Augusta Systems, First Energy and Tollgrade Communications. The project received $4.0 million in funds from DOE, matched with $5.4 million from industry.
Figure 6.36 Schematic of Allegheny Power RDSI project service area and associated substations [2]
The microgrid load includes two commercial buildings with a combined load of about 200 kW for two tenants and distributed energy resources including 160 kW of natural gas internal combustion engine generators, 40 kW of solar PV and energy storage capable of providing about 24 kW for a two-hour period. A First Energy-controlled point of common coupling has an automatic switch to allow for intentional islanding of the buildings. Beyond the microgrid involving these two buildings, the project partners are also looking into the following technologies for improved grid operation: multi-agent grid management system, demand response and automated load control, low-cost distribution sensors, fault location and prediction and dynamic feeder reconfiguration.
6.3.2.9 ConEd – Interoperability of Demand Response Resources
This project run by the utility ConEd in New York City seeks to utilize a demand response command center to aggregate multiple DR resources at retail electric customer sites to supply critical services, under tariff-based and market-based programs, to the electric distribution company and to the regional transmission operator. Load reduction will be coordinated at 29 different telecom facilities and the ConEd headquarters into one “visualization platform”. Distributed diesel generator resources totaling 20 MW on 24 customer sites will be aggregated as well (Figure 6.37). A mapping platform shows operators the status of different grid resources (customer distributed generation and demand response), using different colors to depict different operating status conditions. A key policy issue for this project will be how to price these demand response and distributed generation aggregation activities.
Figure 6.37 Numbers of customer site located throughout New York City for the ConEd RDSI project [2]
The project received $6.8 million in funding from DOE, matched with $6 million in funds from industry and $1 million from the New York State Energy Research and Development Authority. Partners include Verizon, Infotility and Innoventive Power.
6.3.2.10 Maxwell Air Force Base (A Military Microgrid)
The Maxwell AFB microgrid is a research and development project to validate the basic functionality of autonomous engine controls based on the CERTS droop control concept. It does this by modifying the controls of existing diesel gensets, and operating those with new generation that is located some distance away from the existing gensets but on the same distribution feeder. The goal is to determine if these generators can share the loads and maintain stability in an islanded mode.
The specifics of the project include two 600 kW diesel backup gensets that are located in one building and installing a new CERTS-based 100 kW genset in a different building some distance from the first. The existing feeder connecting these two buildings will be sectionalized from the other loads by installing switchgear in the appropriate locations. This switchgear will isolate these two buildings from other loads on the feeder and create an experimental microgrid with two building loads and three generators.
Successfully demonstrating the stability of the controls will allow expansion of this microgrid to include more loads and additional generators that will maintain a stable microgrid, even in the absence of a central command and control architecture common to most microgrids today.
The ability to modify existing generators while adding new gensets with the CERTS droop functionality is an important milestone in the future deployment of microgrids, because a vast majority of existing buildings with mission-critical functions already have legacy backup gensets that still have ample operational life left in them. Also, integration of new gensets with CERTS controls and renewable generation sources with inverters that have similar functionality can be readily integrated into such microgrids.
6.3.2.11 UCSD Project (A Large Campus Microgrid)
The UCSD microgrid project supplies electricity, heating and cooling for a 450 hectare campus with a daily population of 45 000 (Figure 6.38). The main two motivations for constructing the project are as follows:
- After deregulation in California, the campus was able to purchase gas at an attractive rate to generate power by itself. For example, the CHP plant that they built had a five-year capital cost payback period based on avoided gas purchase costs.
- There is an existing campus steam distribution system for UCSD to have the ability to use steam to drive chilled water for cooling as well as hot water and heating.
Figure 6.38 Energy flow through UCSD microgrid [1]. Sourced from http://synergy.ucsd.edu/files/Agarwal_DATE2011_UnderstandingMicroGrid.pdf. Reproduced by permission of Yuvaj Agarwal
The UCSD microgrid consists of two 13.5 MW gas turbines, one 3 MW steam turbine and a 1.2 MW solar-cell installation that together supply 85% of campus electricity needs, 95% of its heating and 95% of its cooling. The turbines produce 75% less emissions of criteria pollutants than a conventional gas power plant. For HVAC, it uses a 40 000 ton/hour, 3.8 million-gallon capacity thermal energy storage bank, plus three chillers driven by steam turbines and five chillers driven by electricity. A 2.8 MW molten carbonate fuel cell is running on waste methane, which is sponsored by California's self-generation incentive program funds and takes advantage of a 30% federal investment tax credit. The campus is connected to SDG&E by a single 69 kV substation. The UCSD uses a “straight SCADA system” for the building systems and energy supply to ensure their communication with each other. UCSD is installing a new high-end Paladin master controller, which will control all generation, storage and loads with hourly computing to optimize operating conditions. It can receive as many as 260 000 data inputs/second. To support Paladin, UCSD will use VPower software to process market-price signals, weather forecasts and the availability of resources. At the UCSD campus, about 200 power meters, on the main lines and at buildings' main circuit breakers, track use minute by minute. Lastly, DOE has just given USCD a grant to model the effects on the local distribution system from the ramping up and down of the solar PV system's output.
6.3.2.12 Aperture Center Project (A Green Field Commercial Building Microgrid)
The Aperture Center in Mesa del Sol, Albuquerque, New Mexico, will be the test site for a commercial microgrid. The project is a collaborative effort between the USA and Japan. It is being carried out by NEDO (see Section 6.4), along with the State of New Mexico, Mesa del Sol, Public Service Company of New Mexico, Sandia and Los Alamos National Lab and Los Alamos County.
This demonstration is bringing Japanese technology to demonstrate how to integrate multiple generation sources including renewable energy resources along with multiple storage sources, and how they can be optimized to interact with the building load. A number of Japanese companies are participating in the project, including Toshiba, Sharp, Fuji Electric, Tokyo Gas and Mitsubishi. Each of the Japanese companies has specific research that they want to do in this project. The Japanese have funneled about $30 million, statewide, into many smart grid projects in New Mexico, including this project at the Aperture Center. The local utility company is only involved in order to ensure that it interconnects and operates safely within the distribution grid.
The system comprises a 50 kW solar PV system (Figure 6.39) mounted on a shade structure over a parking lot and utility yard, currently under construction, that will contain an 80 kW fuel cell, a 240 kW natural gas-powered generator (Figure 6.40), a lead-acid storage battery power system and hot and cold thermal storage. All parts will be interconnected through a control room and building management system in the Aperture Center. The project is on schedule to be up and running in mid to late spring of 2012.
Figure 6.39 Natural gas generator at the Aperture Center microgrid

Figure 6.40 Solar PV array at the Aperture Center microgrid
1. Agarwal, Y., Weng, T., Gupta, R.K. 2011. “Understanding the Role of Buildings in a Smart Microgrid,” http://synergy.ucsd.edu/files/Agarwal_DATE2011_UnderstandingMicroGrid.pdf.
2. Bossart, S. (2009) “Renewable and Distributed Systems Integration Demonstration Projects.”EPRI Smart Grid Demonstration Advisory Meeting. http://www.smartgrid.epri.com/doc/15%20DOE%20RDSI%20Project%20Update.pdf.
3. DeForest, N., Lai, J., Stadler, M., Mendes, G., Marnay, C., and Donadee, J. (2012) Integration and operation of a microgrid at Santa Rita Jail, Lawrence Berkeley National Laboratory (LBNL-4850E).
4. DOD (Department of Defense) (2011) “Smart Power Infrastructure Demonstration for Energy Reliability and Security (SPIDERS).”http://www.ct-si.org/events/APCE2011/sld/pdf/89.pdf.
5. DSIRE (Database of State Incentives for Renewables and Efficiency) (2011) http://www.dsireusa.org/.
6. General Services Agency, County of Alameda (2012) “Alameda County Santa Rita Jail: Achievements in Energy and Water Efficiency.”http://www.acgov.org/pdf/GSASmartGRIDProject.pdf.
7. Hatziargyriou, N., Asano, H., Iravani, R., and Marnay, C. (2007) Microgrids – an overview of ongoing research, development, and demonstration projects. IEEE Power & Energy Magazine, July/August 2007, pp. 78–94.
8. IEEE (Institute of Electrical and Electronic Engineers) (2003) “Standard for Interconnecting Distributed Resources with Electric Power Systems.”
9. LBNL (Lawrence Berkeley National Laboratory) (2003) Integration of Distributed Energy Resources: the CERTS Microgrid Concept. Prepared for California Energy Commission. http://certs.lbl.gov/pdf/50829.pdf.
10. Lidula, N.W.A. and Rajapakse, A.D. (2011) Microgrids research: a review of experimental microgrids and test systems. Renewable and Sustainable Energy Reviews, 15, 186–200.
11. Marnay, C., Asano, H., Papathanassiou, S., and Strbac, G. (2008) Policymaking for Microgrids: Economic and Regulatory Issues of Microgrid Implementation. IEEE Power and Energy Magazine, May/June 2008, pp. 66–77.
12. Marnay, C., DeForest, N., Stadler, M.et al. (2011) A Green Prison: Santa Rita Jail Creeps Towards Zero Net Energy, Lawrence Berkeley National Laboratory, LBNL-4497E.
13. Navigant Consulting (2006) “Microgrids Research Assessment – Phase 2.”http://der.lbl.gov/sites/der.lbl.gov/files/montreal_navigantmicrogridsfinalreport.pdf.
14. UCSD Sustainability Solutions Institute (2010) “Smart power generation at UCSD.”http://ssi.ucsd.edu/index.php?option=com_content&view=article&id=416:smart-power-generation-at-ucsd-november-1-2010&catid=8:newsflash&Itemid=20.
15. Ustun, T., Ozansoy, C., and Zayegh, A. (2011) Recent developments in microgrids and example cases around the world-A review. Renewable and Sustainable Energy Reviews, 15, 4030–4040.
16. Young Morris, G., Abbey, C., Joos, G., and Marnay, C. (2011) A Framework for the Evaluation of the Cost and Benefits of Microgrids, Lawrence Berkeley National Laboratory (LBNL-5025E).
17. Bialek, T. (2011) “SDG&E's Microgrid Activities,” DOE Electricity Advisory Committee. http://energy.gov/sites/prod/files/EAC%20Presentation%20-%20SGD%26E's%20Microgrid%20Activities%2010%202011%20Bialek.pdf.
18. Kelly, J., Meiners, M., and Rouse, G. (2007) “IIT Perfect Power Prototype: Final Report,” Galvin Electricity Initiative and Illinois Institute of Technology. http://www.galvinpower.org/sites/default/files/documents/IIT_Perfect_Power_Prototype.pdf.
6.4 Overview of Japanese Microgrid Projects
The New Energy and Industrial Technology Development Organization (NEDO) is Japan's largest public R&D management organization for promoting the development of advanced industrial, environmental, new energy and energy conservation technologies. One of the important objectives of NEDO's R&D is solving problems that arise when distributed and renewable resources are connected to power grids. These issues arise because the power output from most renewable energy resources fluctuates with weather conditions, and connecting them to traditional power grids may create power quality issues. Therefore, the development of energy management systems, energy storage applications and forecasting methods is important for resolving connection issues. NEDO is promoting several grid connection related projects, as shown in Figure 6.41. In those projects, two microgrid-related projects are involved. After the year 2010, NEDO started several international smart community projects shown in Figure 6.42. One of those projects, the New Mexico smart grid project, includes two distribution level microgrids and two customer level microgrids.
Figure 6.41 NEDO's grid-connection system projects
Figure 6.42 NEDO's international smart community projects
6.4.1 Regional Power Grids Project
The Demonstrative Project of Regional Power Grids with Various New Energies, undertaken from FY2003–FY2007, is one of the most notable projects in the history of NEDO. This project encompasses three related sub-projects, one of which was conducted at the site of The 2005 World Exposition, Aichi, Japan.
6.4.1.1 Aichi Micro Grid Project
In the Aichi project, a power supply system utilizing fuel cells, photovoltaic cells and a battery system, all equipped with inverters, was constructed. A diagram of the supply system for the project is shown in Figure 6.43.
Figure 6.43 Diagram of the Aichi project
The primary power generation sources for this microgrid system were the fuel cells and the PV systems. The fuel cells included two molten carbonate fuel cells (MCFCs) with capacities of 270 kW and 300 kW, one 25 kW solid oxide fuel cell (SOFC) and four 200 kW phosphoric acid fuel cells (PAFCs). City gas was the primary fuel for the fuel cells. However, some of the fuel for the MCFCs was supplied by a methane fermentation system and a gasification system. The total capacity of the installed PV systems was 330 kW and multi-crystalline silicon, amorphous silicon and single crystalline silicon bifacial cells were used. Also, a sodium-sulfur (NaS) battery was used to store energy within the supply system and it played an important role in balancing supply and demand, as shown in Figure 6.44.
Figure 6.44 Typical daily operation of the Aichi microgrid
This demonstrative power plant (Figure 6.45) was installed at the site of the 2005 World Exposition, Aichi, Japan (EXPO 2005) and operated from December 2004 to September 2005. During the demonstration period, a total of 3 716 MWh of electricity was supplied by the power plant to two major pavilions. After EXPO 2005, the power plant was relocated to a site in Tokoname City, near the Chubu International Airport (Figure 6.46), and demonstrative operation was restarted in August 2006 and concluded in December 2007.
Figure 6.45 Microgrid system installed at the EXPO site
Figure 6.46 Microgrid system relocated near Chubu international airport
In the Aichi sub-project, since all of the power resources were inverter-based, the target for power imbalances was set to 3% per 30 minute interval. This target was almost achieved by the time the mid-term evaluation of the project was conducted.
During FY2005, power imbalances were reduced to less than 8% per five minute interval in the Kyotango project. By the end of the project, power imbalances were reduced to less than 3% per five minute interval.
In September 2007, independent operation was tested again at the Aichi site, for one day, under limited demand condition. In this case, a sodium-sulfur battery was used to control frequency and voltage, instead of a PAFC. By using this battery, better power quality was achieved relative to the first test conducted in 2005.
6.4.1.2 Kyotango Virtual Microgrid
The system installed in Kyotango was not technically a microgrid because each energy supply facility and demand site was connected to a utility grid and was only integrated by a control system. This energy supply system, as shown in Figure 6.47, was, more accurately, a “virtual microgrid.” This concept is very useful in the area where grid system is fully deregulated.
Figure 6.47 Diagram of Kyotango project
The main facility of the system (Figure 6.48) is a biogas plant. Gas engines with a total capacity of 400 kW were installed in the plant, together with a 250 kW MCFC and a 100 kW lead-acid battery. In remote locations, two PV systems and a 50 kW wind turbine were also installed. The power generation equipment and end user demand were managed by remote monitoring and control. One of the interesting features of the system is that it was not managed. by a high-speed, state-of-the-art information network system, but through standard ISDN or ADSL ISP connections to the internet, which were the only connection options available in that rural area of Japan. Operation of the Kyotango Project system commenced in the middle of FY2005, and concluded in March 2008. After conclusion of the project, the biogas plant was transferred to Kyotango city and operated as regional refuse dump.
Figure 6.48 Kyotango biogas plant
6.4.1.3 Hachinohe Microgrid
One of the unique facets of the microgrid system constructed in the Hachinohe Project was a private distribution line measuring more than 5 km. A diagram of the complete system, from the sewage plant to the city hall, is shown in Figure 6.49. The private distribution line was constructed to transmit electricity, primarily generated by a gas engine. Three 170 kW gas engines and a 100 kW PV system were installed at a sewage plant. A 50 kW inverter (Figure 6.50) for the PV system compensated for demand imbalances between the three phases. Because thermal energy was in short supply and it was necessary to safeguard the microorganisms that produced digestion gas in the sewage plant, a wood waste steam boiler was also installed.
Figure 6.49 Schematic diagram of the Hachinohe project
Figure 6.50 The Hachinohe project
Between the sewage plant and city office, four schools and a water supply authority office were connected to the private distribution line. At the school sites, renewable energy resources were used to create a power supply that fluctuates according to weather conditions in order to verify the microgrid control system's capabilities to match supply and demand. Operation of the Kyotango Project system commenced in the middle of FY2005 and concluded in March 2008. After the finish of the project, gas engine generators were used as private generators by Hachinohe city and generated energy was sent to the electricity to city office using a private distribution line.
In the Hachinohe project, the control system used to balance supply and demand had three aspects: weekly supply and demand planning, economic dispatch control once every three minutes and second-by-second power flow control at interconnection points. The control target was a power imbalance of less than 3% for moving average six-minute intervals. From October to November 2006, a margin of error rate of less than 3% was achieved during 99.99% of the system's operational time.
In the Hachinohe project, completely independent operation was tested for one week in November 2007. In the Hachinohe system, the power imbalance between the three phases was a serious problem, so a new PV inverter that could compensate for the imbalances between the three phases was installed and operated (Figure 6.51). Power quality during independent operation was very stable, and voltage (6600 V ±5%) and frequency (50 Hz ±0.3 Hz) could be maintained within operating standards. Electricity consumed in the City Hall's main office building (Figure 6.52) was supplied only by the microgrid. No one could tell the difference between electricity from the microgrid and electricity from the utility.
Figure 6.51 PV inverter to compensate for imbalances between the three phases
Figure 6.52 City Hall lights illuminated with power supplied solely by the microgrid
6.4.2 Network Systems Technology Projects
In the Demonstrative Project on New Power Network Systems (FY2004–FY2007), network technologies for future distribution systems were developed. This project included two experimental sub-projects (and one research sub-project). The first experimental sub-project was the “Demonstrative Project on Power Network Technology.” In this project, equipment that can control the voltage and power flow to distribution feeders was developed and improved.
The second sub-project was the “Demonstrative Project on Power Supply Systems by Service Level.” For this project, a test facility was constructed in Sendai City. Through this test facility, electricity of various quality levels was supplied to consumers to meet different power quality requirements. This facility was usually considered as a kind of microgrid. Construction of the project's test facility has been completed and demonstrative operations were commenced in November 2006 and concluded in March 2008.
6.4.2.1 Demonstrative Project on Power Supply Systems by Service Level
Grid technology has the potential to create value for consumers by supplying appropriate energy service levels. This is the subject being evaluated in the Demonstrative Project on Power Supply Systems by Service Level. In this project, the electricity supply system shown in Figure 6.53 was constructed in Sendai City. In this system, two 350 kW gas engine generators, one 250 kW MCFC and various types of compensating equipment were installed. The compensating equipment included an integrated power quality backup system that supplied high-quality power to “A” class consumers and “B1” class consumers, for whom interruptions and voltage drops were compensated by a UPS backup system. For “A” consumers, the wave pattern was guaranteed, whereas for “B1” consumers it was not. In the case of “B2” and “B3” class consumers, only short-term voltage drops were compensated for by a series compensator.
Figure 6.53 Schematic diagram of the Sendai project
The power supply system's compensators and distribution generators are shown in Figure 6.54. The equipment was tested using dummy loads in FY2006. In FY2007, the equipment was connected to meet actual demand, such as for a university or the Sendai City facility, and demonstrative operation was commenced. Moreover, back-to-back (BTB) equipment was added to the system and then applied to create an artificial voltage drop for testing the function of the compensating equipment.
Figure 6.54 Sendai project's compensating equipment and generators
In the Demonstrative Project on Power Network Technology, technologies evaluated in this project were thought to contribute to better voltage management. Through digital simulations and experiments using model distribution networks, the effectiveness of those technologies to control voltages on distribution lines when many distributed generators like PV systems were connected was evaluated. By dispersing the equipment on the distribution line, centralized control of the equipment resulted in better operation than when the equipment was controlled separately. However, one of the problems was the time it took to calculate the optimal centralized control solution. It was found that a slow response could cause voltage fluctuations if a lot of equipment was installed and the optimization interval became longer.
In the Sendai project, technologies related to power quality management worked well throughout the project period. In particular, the BTB inverter (Figure 6.55) was very effective for evaluating the operation of the system. By using a BTB inverter, artificial voltage sags could be generated and the effectiveness of compensating equipment could be evaluated. Throughout the project period, some natural voltage sags from utility networks were also experienced. The artificial and natural voltage sags allowed the effectiveness of the high-quality power supply service to be demonstrated.
Figure 6.55 BTB inverter used in Sendai project
In this project, an economic evaluation of cost effectiveness were being undertaken by a research company in cooperation with the groups that carried out the sub-projects in Akagi and Sendai. The final results were reported by the middle of FY2008.
6.4.3 Demonstration Project in New Mexico
NEDO ran microgrid-related demonstration projects in New Mexico, USA. In this project, NEDO prepared two demonstration sites: in Los Alamos (Figure 6.56) and Albuquerque.
Figure 6.56 View of Los Alamos County
6.4.3.1 Los Alamos County Project
In Los Alamos county, there is the famous Los Alamos National Laboratory (LANL), which is situated on the plateau known as the mesa at an altitude of almost 2200 m, and it is within a residential area of 20 000 people. It has a dry climate, but it has also a lot of thunder storms in the summertime. Electricity is supplied by a county-owned electricity utility, and its distribution network feeds the residential area by two underground cables which are connected to some feeders using overhead lines. By changing connections using switchgear, the demand on each underground cable can be changed.
On one of those feeders, as shown in Figure 6.57, NEDO has installed a 1 MW PV system and the US authorities have installed a second 1 MW PV system. Also, Japan installed a battery storage system of over 1 MW. Using this combination, NEDO will demonstrate reduction of power fluctuation due to intermittent PV production.
Figure 6.57 Microgrid sytem in Los Alamos
At the Los Alamos demonstration site, NEDO plans to test demand response by introducing a special time of use (TOU) menu. In this case, the energy management system sends a price signal to each smart meter, in order to measure load elasticity to price. Also, using this price signal, NEDO will demonstrate a high specification home energy management system (HEMS) in the demonstration house. This HEMS involves electricity price and PV generation forecasting, based on weather forecasts. This HEMS also calculates the optimal scheduling of the battery storage operation. NEDO aimed to demonstrate that such an intelligent HEMS would bring the largest demand response.
6.4.3.2 Albuquerque Project
Albuquerque is the largest city in New Mexico. Its population is about 750 000, and the altitude is almost a mile above sea level. The sun shines for about 300 days a year, and there are thunderstorms on many summer evenings.
In Albuquerque, the Public Service of New Mexico (PNM) supplies electricity. In the southern area around the Albuquerque Airport, there is a new development area named Mesa Del Sol, where the second demonstration area is located. In the central area of Mesa Del Sol, there is a new town center building (Figure 6.58), which is the main site for NEDO's demonstration.
Figure 6.58 Town center building
By introducing a gas engine co-generation system, a fuel cell, a battery storage system and thermal storage (using ice), this building can supply ancillary services to the grid distribution company. On the grid, there is a 500 MW PV system (Figure 6.59). Several distributed generators and storage elements work as absorbing equipment to accommodate the fluctuation of the PV by receiving a signal from the EMS. Also, this building can operate independently from the grid. Throughout the project, NEDO has demonstrated that independent operation can provide a high reliability supply for such a building.
Figure 6.59 Demonstration system in Albuquerque
6.5 Overview of Microgrid Projects in China
By the end of 2012, 16 microgrids had been installed in various parts of China, as shown in Figure 6.60. These microgrids may be divided into three groups according to their installation sites:
- 4 microgrids installed on islands along the east and south coast of China
- 8 microgrids installed at industrial, commercial or residential sites
- 4 microgrids installed in remote areas
Figure 6.60 Location of microgrids installed in China
6.5.1 Microgrids on Islands
Islands have complex energy supply problems due to their unique geographical locations and natural environment. At present, most islands in China are supplied by diesel generators, with adverse effects on supply reliability and environmental pollution, including in surrounding waters. The use of submarine cables is mostly not economical. Islands have abundant renewable energy resources, mainly solar, wind and biomass, making them ideal sites to employ microgrid technologies.
The operating microgrid projects on islands include the MW-level multi-energy microgrid system at Dong'ao island and the wind/PV/diesel and seawater desalination comprehensive demonstration microgrids at Dongfushan island. Also, a number of microgrids on islands are under construction or in planning, such as the stand-alone microgrid project at Nanji island, the new energy demonstration microgrid at Wanshan islands, Zhuhai, BYD microgrids, the grid-connected microgrid demonstration project on Luxi island and the 500 kW ocean energy stand-alone in Qingdao. These microgrids can be divided into islanded and grid-connected systems based on their operation modes. The microgrids at Dong'ao island and Luxi island are typical grid-connected systems, while the microgrids at Nanji island and Dongfushan are off-grid systems. In the following sections selected microgrids in operation are briefly described.
6.5.1.1 MW-Scale Microgrid Installed at Dong'ao Island
Dong'ao Island is located at the center of the Wanshan Islands, Zhuhai City, with an area of 4.62 km2 and a population of over 600 [1]. Despite the abundant solar energy, wind energy, biomass energy and other renewable energy resources, the power supply used to be a bottleneck to the island's economic development and ecological preservation. In 2010, the first MW-scale microgrid with multi-energy technologies was built (Figure 6.61) and put into successful operation by the Guangzhou Institute of Energy, Chinese Academy of Science and China (Zhuhai) Xing-ye Solar Technology Holdings Co. Ltd. Its configuration includes a 1000 kW solar PV, a 50 KW wind generation system, a 1220 kW diesel power generator and a 2000 kVAh battery bank [2,3]. In addition, a control unit with a bidirectional inverter and a monitoring unit equipped with GPRS wireless communication devices is used to manage the microgrid operation. In the future, the microgrid may be extended by adding various other energy resources, such as tide and wave energy generation systems.
Figure 6.61 DER at Dong'ao Island's microgrid
6.5.1.2 Stand-Alone Microgrid at Nanji Island
The stand-alone microgrid at Nanji Island, in Zhejiang, is another microgrid demonstration project. Building started in June 2012, and it is planned to be put into operation by the end of 2013. The State Grid Corporation of China supports the project with a total investment of ¥150 million. The Nanji microgrid consists of 10 sets of 100 kW wind generators, 545 kW of PV, 30 kW of marine power generation, 300 kW of storage batteries and a 1600 kW standby diesel generator. The project will also replace all internal combustion engine vehicles on the island with electric vehicles (EV). The battery system also takes advantage of the EVs' batteries which will use its stored energy to supply electricity to the system reducing the operating time of the diesel generator, making the best use of excess renewable energy [4–6]. There are about 2400 people living on the island.
6.5.1.3 Microgrid at Dongfushan Island
The total installed capacity of the microgrid at Zhejiang, Eastern Fushan island is 300 kW. This is a hybrid wind/PV/diesel and seawater desalination system, which includes seven 30 kW wind turbines, a 100 kWp PV generation system and a set of 50 t/d seawater desalination systems (Figures 6.62–6.64). The system is also equipped with batteries. The microgrid uses hybrid AC and DC buses [4]. The operating strategy aims to maximize the use of renewable energy and by reducing the diesel power and by extending the battery service life, taking into account their characteristics. At present, it is the largest off-grid operating microgrid system in China [2].
Figure 6.62 Schematic diagram of the Dongfushan microgrid
Figure 6.63 Wind power generation system [13]
Figure 6.64 The 100 KWp PV generation system and energy storage system at Dongfushan Island [13]
6.5.2 Microgrids in Industrial, Commercial and Residential Areas
These projects have been installed in different places in China, typically in intensely industrial, prosperously commercial and densely populated areas, such as industrial parks, university campuses, commercial or residential buildings. Their purpose is to provide safe, reliable and stable power supply to the loads, thus improving the power quality. Most of these projects are connected at 10 kV MV distribution networks and their capacity varies from hundreds of kW to 10 MW.
Among these projects is the Sino-Singapore Tianjin Eco-city smart grid demonstration project, which is China's first smart grid demonstration project, and the microgrid system in Nanjing Power Supply Company which can achieve smooth transition between grid-connected and islanded mode of operation, plus a typical village microgrid demonstration project that has been developed in Yudaokou, Chengde. In addition to these projects, microgrids in industrial, commercial and residential areas include Xin Ao (Langfang) future energy Eco-city microgrid demonstration project, the 2 MW hydroenergy/PV complementary microgrid demonstration project in Batang, Yushu, and the Anyang microgrid demonstration project.
6.5.2.1 Sino-Singapore Tianjin Eco-City Smart Grid Demonstration Project
The Sino-Singapore Tianjin Eco-city smart grid demonstration project comprises distributed energy resources of 6 kW of wind power and 30 kW of PVs, energy storage of four 15 kW battery banks and 15 kW lighting and electric car charging pile loads to form a low-voltage AC microgrid [2,4] (Figure 6.65). Based on the overall planning requirements of the Sino-Singapore Tianjin Eco-city, the proportion of renewable energy used in the project area will exceed 20%. After its completion, the total installed capacity of the microgrid will reach 175 MW, and it is expected that the annual generation capacity will be about 390 million kWh to meet the electricity demand of about 130 000 families [7].
Figure 6.65 Microgrids at Sino-Singapore Eco-city in Tianjin [7]
6.5.2.2 Wind/PV Microgrid System at Nanjing Power Supply Company [2,4]
The wind/PV microgrid designed by Zhejiang Electric Power Test Research Institute in the Nanjing Power Supply Company, is one of the first microgrid projects to be put into operation in China. The goal of the project is to study the coordinated and optimal control technologies when several DER (PV, wind power and batteries) are connected to the local grid. The microgrid includes a 50 kW solar PV, 15 kW wind generation (two wind turbines of 8 kW and 7 kW, respectively) and a 300 Ah battery bank (Figures 6.66 and 6.67). Using intelligent control of the charging/discharging process of the battery systems, this system can smooth out the distributed generation (DG) power output variations caused by fluctuating solar radiation and wind speed and is able to operate in both, grid-connected and islanded modes. In grid-connected mode, the system can control the power flow at point of common coupling (PCC) by controlling the charging/discharging of batteries, while in islanded mode, the battery banks supply the main power. Static switches are used for the seamless transition between the two modes.
Figure 6.66 Microgrid at the Nanjing Power Supply Company
Figure 6.67 Wind/PV microgrid system at the Nanjing Power Supply Company [13]
6.5.2.3 Microgrid in Yudaokou, Chengde [8]
This is a village microgrid of 110 kW capacity. It contains 60 kW wind power generation, 50 kW PV and 80 kW (128 kWh) storage and comprises four sets of household wind/PV/battery microgrid. After completion, it will be able to provide local farmers with reliable power and, at the same time, it will offer energy conservation and environmental protection. It is considered to be of great significance for promoting clean energy and efficient utilization leading to the new rural electrification system.
6.5.2.4 Other Microgrids in Industrial, Commercial and Resident Areas
The 2 MW hydroelectric/PV complementary microgrid in Batang, Yushu, Qinhai province, which came into operation in December 2011, is the first MW level hydroelectric/PV power station in China. It consists of a 2 MW PV generation system, a 12.8 MW hydroelectric system and an energy storage system of 15.2 MWh. More than 8700 PV modules and more than 8200 batteries are installed in this microgrid. It is expected that its average annual production capacity will reach 2.8 million kWh in its 25-year lifetime, so the total generating capacity will reach 70 million kWh [4,9].
The Anyang microgrid demonstration power station project belongs to the Anyang city's “3000 PV project”. Four sites with a total capacity of 75 kW have been selected for this project, an administrative office (45 kW), a school (20 kW) and two peasant households (2 × 5 kW) [10].
The distributed PV generation and microgrid control project in Henan College of Finance and Taxation, which was completed in December 2010, includes a 350 kW PV system, a 200 kVA/200 kWh storage system and a control system. The PV generation system is located on the roofs of seven dormitories to meet the demands of dormitories and canteens [2,4].
6.5.3 Microgrids in Remote Areas
China covers a vast geographic area, and its population lives mostly in the coastal areas and middle or eastern areas inland. Some areas, such as Tibet, Qinghai, Sichuan, Yunnan, Xinjiang, Inner Mongolia and other western and frontier places are off the power grid, with 1.2 million households and 5 million people without electricity. Grid expansion to these areas faces several difficulties, such as huge construction investments and high operational costs. The installation of microgrid projects based on local renewable energy sources, such as solar and wind power, will not only make full use of the unique natural advantages and improve energy efficiency, but can also provide local residents with an electrified way of life. Such remote area microgrids are the New Energy City Demonstration Project in Turpan, a microgrid with wind/PV/battery in Old Barag Banner and Taiping Forestry Center, and a microgrid with PV generation in Ali area of Tibet.
6.5.3.1 Microgrid of New Energy City Demonstration Project in Turpan [2,4]
Turpan is an ideal place for the development of renewable energy in China because of its unique natural conditions. It is located in Xinjiang province with abundant solar and wind resources. The first construction phase of a project called “Microgrid of New Energy City Demonstration Project in Turpan” has been completed in 2012 [11]. Partners include the National Energy Administration, the National Development and Reform Committee and the State Electricity Regulatory Commission. The project consists of an integrated PV project (a rooftop PV power station), which uses the 750 000 m2 rooftop to install 13.4 MW PV array, forming the Building Integrated Photovoltaic Project. The project consists of 57 000 polysilicon 235 W PV modules, 735 small-sized inverters, a monitoring system and related accessories. The smart microgrid project includes a 10 kV substation, 380 V power distribution network, 1 MWh storage system, electric bus charging station, monitoring control center for the microgrid, ancillary works and so on.
6.5.3.2 Other Microgrids in Remote Areas
The microgrid at Old Barag Banner is a typical grid-connected microgrid. The system includes 150 kWp PV power generation, 100 kW wind power generation, and a 50 kW × 2 h lithium-ion battery system. The microgrid at Taiping Forest Center is an off-grid microgrid with 100 kW wind power, 250 kWp PV and a 200 kW × 4 h battery system [2]. The PV microgrid at Ali has a total installed capacity of 10 MW and its design life is 25 years. It is equipped with presently the largest energy storage system in the world of 10.64 MWh. Together with an existing 6.4 MW hydropower and 10 MW diesel generator, they form a stand-alone PV/hydropower/diesel microgrid [12].
For further information, see [14–17].
1. http://www.zhnews.net/html/20110516/073516,295032.html. “The microgrid at Dongao Island have product 120 000 kWH electricity”.
2. Zhang, Jiajun and Zhao Dongmei (Sep. 2012) “Overview of Micro-grid experiment and demonstration projects at home and abroad”. 28th academic annual conference.
3. http://www.gd.chinanews.com/2010/2010-12-28/2/79074.shtml. “China'First MG level intelligent microgrid based on island built in Zhuhai”.
4. http://news.byf.com/html/20121212/154422.shtml. “Overview of Microgrids in China”.
5. http://www.stdaily.com/kjrb/content/2012-06/06/content_477760.htm. “National 863 Plan” Project–Microgrid in Nanji island is put into construction.
6. http://www.sgcc.com.cn/ztzl/newzndw/sdsf/06/274841.shtml. “The effect of microgrid is not micro—Explore the future dream of Nanji Island.”
7. http://www.tianjinwe.com/tianjin/tjwy/201110/t20111026_4466096.html. “Explore The Sino-Singapore Tianjin Eco-city comprehensive smart grid demonstration project”.
8. http://www.ceeia.com/News_View.aspx?newsid=39467&classid=81. “Microgird provides a new way for integrating new energy into grid”.
9. http://www.stdaily.com/kjrb/content/2012-01/06/content_410839.htm. “The Hydroelectric/PV complementary power station in Yushu is put into use successfully”.
10. http://zs.cctv.com/anyang/news_209474.html. “The 45kW Anyang microgrid demonstration power station is put into grid-connected operation successfully”.
11. http://www.xjbs.com.cn/news/2012-11/10/cms1484505article.shtml?nodes=_365_.
12. http://www.windosi.com/news/414733.html. “World's highest 10 MW-level photovoltaic power station is put into operation”.
13. http://wenku.baidu.com/view/99cbfcd95022aaea998f0f85.html.
14. http://www.sgcc.com.cn/xwzx/gsyw/yxfc/11/284269.shtml, “The first mrciogird of Shandong will be built in Qindao”.
15. http://news.sina.com.cn/o/2012-08-28/152225052783.shtml. “China Southern Power Grid will built microgrid project in Xisha Islands”.
16. http://www.wenzhou.gov.cn/art/2012/12/26/art_3907_249918.html. “The system of Luxi microgrid is being built”.
17. http://www.zhnews.net/html/20110928/081327,324712.html.
6.6 An Off-Grid Microgrid in Chile
6.6.1 Project Description
The ESUSCON rural electrification project (Electrificación Sustentable Cóndor, or Condor Sustainable Electrification Project, in English) is an initiative from the Energy Center, Faculty of Physical and Mathematical Sciences, Universidad de Chile, and a local mining company, focused on developing a microgrid in the locality of Huatacondo, Tarapacá region, Chile.
The Huatacondo's electricity network is isolated from the interconnected system. Electricity supply was limited to only 10 hours a day using a diesel generator. The developed microgrid takes advantage of the area's distributed renewable resources, providing 24-hour electricity service. Because the village experienced problems with its water supply system, a management solution was also included in the microgrid. Also, a demand-side option to compensate the generation fluctuations due to the renewable sources was considered. The system is composed of two PV systems (Figure 6.68), a wind turbine, the existing village diesel generator unit (typical in isolated locations), an energy storage system (ESS) composed of a lead-acid battery bank (LABB) connected to the grid through a bidirectional inverter, a water pump and a demand side management (DSM) (loads). Figure 6.69 shows the power schematic of this microgrid.
Figure 6.68 The Huatacondo microgrid
Figure 6.69 Renewable-based microgrid: Power schematic. Reproduced by permission of the IEEE
These elements are controlled by a central energy management system (EMS) that provides signals for optimizing their operation according to load and resource forecasts, in order to minimize the consumption of diesel and to keep the power quality indicators close to optimal values. Also, it includes a demand-side management system, which sends to the customer visual information about recommended daily load profiles according to forecast resource availability; actual consumption data is then recorded and sent back to the EMS through smart metering [2].
The main goals of the EMS are
- minimize the use of diesel
- deliver active generation setpoints for the diesel generator, the ESS inverter and the PV plant
- turn on and off the water pump in order to keep the elevated water tank level within predefined limits
- send signals to consumers promoting behavior changes.
In field implementation, the diesel generator and the ESS inverter have two configurable droop curves to follow the setpoints. Q–V and P–f droop curves are normally configured for typical operation states that change when receiving adequate signals from the EMS.
When the EMS turns on the diesel generator, it is convenient to start the LABB charging. In that case, the diesel generator is configured to work in synchronous mode (with infinite slope in both curves, takes all the variations between generation and load, following the rated values of 380 Vl-l at 50 Hz, and the ESS inverter curves are configured to follow the charging profile of the batteries.
When the diesel generator is turned off, the droop curves of the ESS inverter change to those for a master operation mode, with a very low droop characteristic.
6.6.1.1 Technological Features
The communications infrastructure is devoted to acquiring field data for optimizing the operation of the system. Thus, a SCADA and several measurement devices were installed at Huatacondo village (Figure 6.70). This SCADA has the following capabilities:
- electrical variable measurements for all generation units
- some electrical measurements in the grid and control capabilities (connection/disconnection of low voltage network feeders)
- energy consumption measurement of the electrical loads in the network
- power control of the energy storage system inverter and diesel generator
- grid connection control for all generation units and the water pump consumption
- sun tracking control for the principal PV plant
- wireless communication with the interfaces of the demand-side management system
Figure 6.70 Communications infrastructure. Reproduced by permission of the IEEE
6.6.2 Demand-Side Management
Online signals are sent to consumers in order to modify their consumption behaviours, leaving daily energy constant. This modification is modeled by shifting coefficients S L(t) that are provided by the EMS.
The application of the DSM, relies on an interface that consists of a 24 hour clock that assigns a specific color, describing the energy availability, for each hour. For instance, red means basic energy consumption, green complete energy availability and yellow is a warning state. The DSM interface is shown in Figure 6.71.
Figure 6.71 DSM interface. Reproduced by permission of the IEEE
6.6.2.1 Other Developments
- Bird protective device: In Huatacondo there is the continuous presence of the Andean condor, Vultur gryphus. In order to avoid the possible collision of this bird with the wind power turbine it was necessary to design a special protective cage, which is assembled onto the turbine nacelle. This protective device looks very similar to those used for common fan applications ensuring (Figure 6.72 left).
- PV sensorless automatic tracking system for sun model improvements: a single-axis tracking system was developed for this microgrid, the main advantage being that this system avoids local control, and instead setpoints are defined by the microgrid EMS. In Huatacondo, given the high radiation values, the PV plant capacity factor may increase to 5%, with the tracking system implementation (Figure 6.72 right).
Figure 6.72 Bird protective device (left), comparison between PV panel without (continuous line) and with solar tracking system (dotted line)
6.6.2.2 Identified Positive Impacts
A survey of perceptions of the impact of the Huatacondo project at the community level was conducted, covering 95% of the households in August 2011, almost a year after commissioning was completed.
The results of the survey indicate that the microgrid has high acceptance within the community.
- 57.5% considered the microgrid to have no effect on the fauna, while 42.5% expressed concern about possible collisions between the condors that regularly fly in the area and the wind turbine.
- 92.5% stated that the project does not affect the vegetation, since the installation of the equipment is far from the area of farms, crops and native vegetation.
- 82.5% reported a positive effect on the landscape, because the project brings modernity and technological innovation, 12.5% stated that the project does not affect the local landscape, while 5% considered the project to have negative effects on the landscape.
- Most of the people said that it is now possible to undertake new economic activities or to enhance the existing ones. Specifically, 27% believed that the project is beneficial for the development of tourism and associated services; 23% said that it will benefit agriculture through irrigation technology; 18% suggested that the project would benefit construction activities now that the daily period in which they can use electric tools has been extended. Finally, the remaining 32% felt that there could be a negative impact on agricultural development, because farmers might neglect their farms and crops while pursuing other activities that are now possible.
- no equipment failures over the 2010–2011 period
- high level of commitment of the community for maintenance activities and demand response programs
- high level of interest shown by the people in charge of maintenance and operation activities, demonstrated by low rotation in the membership of the maintenance team
- no accidents involving people or animals
- diesel consumption reduced by 50% when compared with the previous operation scheme
- improved reliability levels
- higher power quality
Notes
1. While the definitions are blurred, in general in the US, jails house prisoners awaiting trial or otherwise involved in the justice system, while prisons house convicted criminals.
2. PJM is the regional transmission organization (RTO) that Illinois is a part of.
1. Alvial-Palavicino, C., Garrido-Echeverría, N., Jiménez-Estévez, G., Reyes, L., and Palma-Behnke, L. (2011) A methodology for community engagement in the introduction of renewable based smart microgrid. Energy for Sustainable Development, 15 (3), (SI), 314–323.
2. Palma-Behnke, R., Reyes-Chamorro, L., and Jimenez-Estevez, G. (2012) Smart solutions for isolated locations. IEEE PES General Meeting.
3. http://synergy.ucsd.edu/files/Agarwal_DATE2011_UnderstandingMicroGrid.pdf.