Failure of a Node
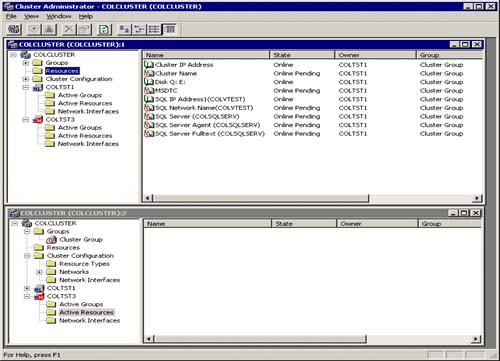
As you can see in Figure 5.24 one of the nodes in the SQL cluster has failed (COLTST3 in this case). As you can also see in Cluster Administrator, the COLTST3 node item group has a “red X” on it to indicate this failure. Also note that the state of the resources on COLTST1 are “Online Pending”! In other words, these resources are in the middle of failing over to this node. As they come up successfully, the “Online Pending” turns to “Online.”
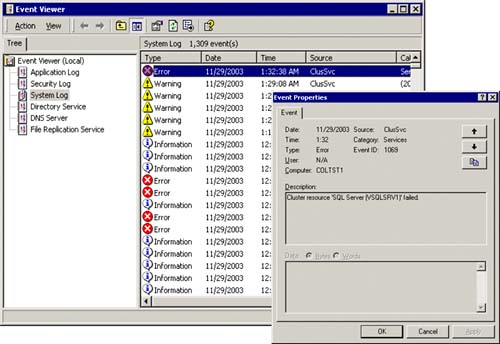
In addition, the failure of a node (for any reason) is also written to the system event log.
Figure 5.25 shows the event ID 1069 “Cluster resource 'SQL WERVER (VSQLSRV1)' failed” indicating that there was a cluster resource failure. You would then want to backtrack all of the system events that lead up to this failure.
Figure 5.25. System Event Log and Event details for the failed cluster resource.
In this particular case, I intentionally initiated a failure of the SQL Server instance (VSQLSRV1) via the cluster administrator. SQL clustering did the right thing by failing over to the other node. This also served to verify that SQL clustering is working properly. The Client Test Program for a SQL cluster section later on in this chapter shows you how this failure scenario might look from the client application's point of view.
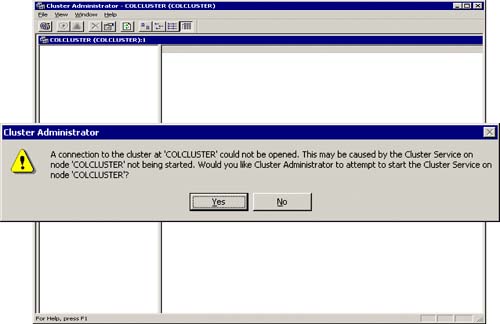
If the cluster itself doesn't come up due to the shared disk not being available, the cluster service not being started, or any number of other reasons, the Cluster Administrator will not function either. Figure 5.26 shows the Cluster Administrator and the error message it generates when it cannot connect to the cluster.
The SQL resources that are now managed by the cluster can also be adjusted to better serve your needs. Figure 5.27 shows the properties of the primary SQL resources in SQL clustering (SQL Server, SQL Server Agent, and Distributed Transaction Coordinator). In particular, you can modify the poll intervals from the possible owners of the resource. In this case, COLTST1 and COLTST3 are the possible owners of these SQL resources.
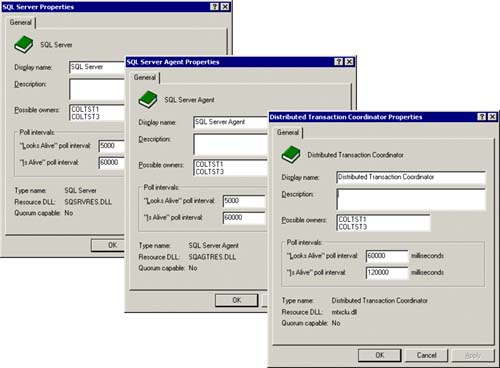
The “Looks Alive” polling interval for the SQL Server resource defaults to 5000 milliseconds (SQL Server and SQL Server Agent). This is the frequency of the polling by cluster services of SQL Server to see if it appears to be alive. If it has failed for any reason (like it is not available from the network any more), it would not appear to be alive and a fail-over would be automatically initiated. The default “Looks Alive” polling interval for the Distributed Transaction Coordinator resource is 60,000 milliseconds since it is not as critical as the server itself.
The “Is Alive” polling interval reflects how often you want Cluster Service to actually check that the resource is “active.” This can usually be a much longer interval time than the Look Alive interval. These defaults are fine to start with, but as you define your service level agreements more precisely, you might want to adjust these polling intervals.
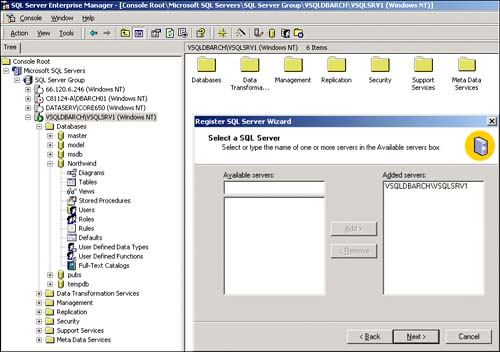
Congratulations! You are now up and running with your SQL Server cluster intact and should now be able to start achieving significantly higher availability for your end-users. As you can see in Figure 5.28, it is very easy to register this new virtual SQL Server (VSQLDBARCHVSQLSRV1) within SQL Server Enterprise Manager and completely manage it as you would any other SQL Server instance.