
Structuring large models with MONO: Notations, templates, and case studies
Harald Störrle QAware GmbH, München, Germany
Abstract
Context: With increasing size, modeling projects have a growing need for an internal structure, much like the directory structure coding projects use to store source code and other resources. An ill-fitting model structure can lead to increased effort, reduced quality, and decreased benefit derived from modeling. Examples for useful model structures and guidelines on how to create them are scarce, at best.
Goal: We aspire to improve the practice of model structuring by providing templates and best practices based on practical experience. We want to foster documenting and sharing model structures by providing a visual notation to define such structures.
Method: We analyze two very different modeling projects, one from industry and one from academia. By representing extremely different settings in terms of tooling, language, audience, and mindset, they represent a large portion of the space of modeling. We define a notation that allows to capture the outlines of both models, thus arguing for its high generality and expressiveness.
Results: We develop the Model Outline NOtation (MONO) to describe generic model structures. We extract proven and effective model structuring templates and practices from two case studies.
Conclusions: Providing an adequate structure to models is important, but little guidance exists currently. Based on two case studies, we aspire to fill this gap, providing both templates and a notation to document and share more model outlines.
Keywords
large-scale modeling; model structure; model outline; model type; model modularity; diagram type; ADONIS; BPM; Matlab/Simulink; MagicDraw; UML; MONO
7.1 Introduction
Conceptual models can be considered knowledge bases [25,26]. As such, they represent financial and intellectual investment, sometimes at a considerable scale. Such investment can be worthwhile through two mechanisms. Firstly, building up the knowledge base is valuable in and by itself already, because making knowledge explicit forces the modelers to clarify tenuous assumptions: building a model amounts to learning about the domain being modeled. Secondly, the artifacts holding a conceptual model allow persisting and distributing the knowledge they represent more easily. Of course, being able to retrieve knowledge from a model effectively is essential. For small and medium models, full-text search and manually browsing a model is sufficient: it is fast, simple, and effective, and it needs no specific tool support. As models grow, however, this approach becomes inadequate. Rising up to this challenge, many approaches for advanced model querying have been proposed over the last decades (e.g., [3,33,34]; see [21] for a recent comprehensive account of the field). These approaches are often limited with respect to expressive power, general applicability, tool availability, and not least quality of user experience [1]. None of them has been widely adopted. A more pragmatic solution is to create a tree-like model outline with defined structures and names for the diagrams, model elements, and submodels. This approach to structuring knowledge is already widely used for directory structures on any conventional hierarchical file system.
There are indications that applying guidelines improves model quality [18], so it is no wonder there are several guidelines for modeling for different modeling languages like UML [15], UML-RT [8], BPMN and similar languages [6], and Matlab/Simulink [13]. There are also guidelines on various other aspects of modeling, including diagram size and layout [12,23,30], naming model elements [10], and model syntax and style [4]. Finally, the spectrum of guidelines ranges from very low-level detailed guides like the guidelines from dSpace or the MAAB up to very high-level, almost philosophical accounts such as [22]. However, apart from [31], no guidelines are readily available for structuring models. There are guidelines for setting up directory structures for coding projects, though, such as the Maven guidelines1 or the various Common Java Practices,2 underlining the need for this type of guideline, and highlighting the gap that is there for modeling – the gap we aspire to fill with this chapter.
To this end, we report two case studies, one from industry and one from academia, about outline structures for large models. In order to be able to describe the model outlines precisely and succinctly, we introduce the Model Outline NOtation (MONO). First, however, we elaborate what we mean by model size and modeling in the large, and we analyze the requirements for effective structures for large models.
7.2 Modeling in the large
Handling “Big Data” is very different from handling smaller amounts of data, and large models are very different from small models along several dimensions:
- • Volume: First of all, large models are made up of a large number of model elements and their relationships. A larger model means more work, more modelers, and more time spent modeling.
- • Views: Second, large models often have many diagrams. Note that this depends on the context: in a BPM or Matlab setting, “model” and “diagram” are synonymous terms, and every model element belongs to exactly one diagram. In a UML setting, however, there may be any number of diagrams portraying any set of model elements. Thus, model elements may belong to any number of diagrams. Again, more diagrams means more work.
- • Visibility: Third, large models have a large audience. Modelers create it, domain experts review it, developers consult it to inform their implementation, and so on. These people differ in their intents and backgrounds, and not catering for all of them reduces the value of the model, endangering the investment a model represents. Thus, a large size of the audience implies a higher demand for consistency and finish than for smaller models. Also, large audiences often go hand in hand with geographical distribution, which increases effort all by itself.
- • Variation: Fourth, the amount of change applied to a model reflects the amount of learning and evolution that took place during the model's lifetime. Larger amounts of change corresponds to greater intellectual and financial investment.
As a corollary, the greater an investment is, the longer it takes to recoup that investment. Longer amortization durations invite external changes to become effective, e.g., changes of the tooling and modeling language, evolution of the original and the intent underlying the model, and the overall project context. This drift adds to the natural erosion of the orderliness of models over time (“model decay”), representing a potential threat to the value of a model.
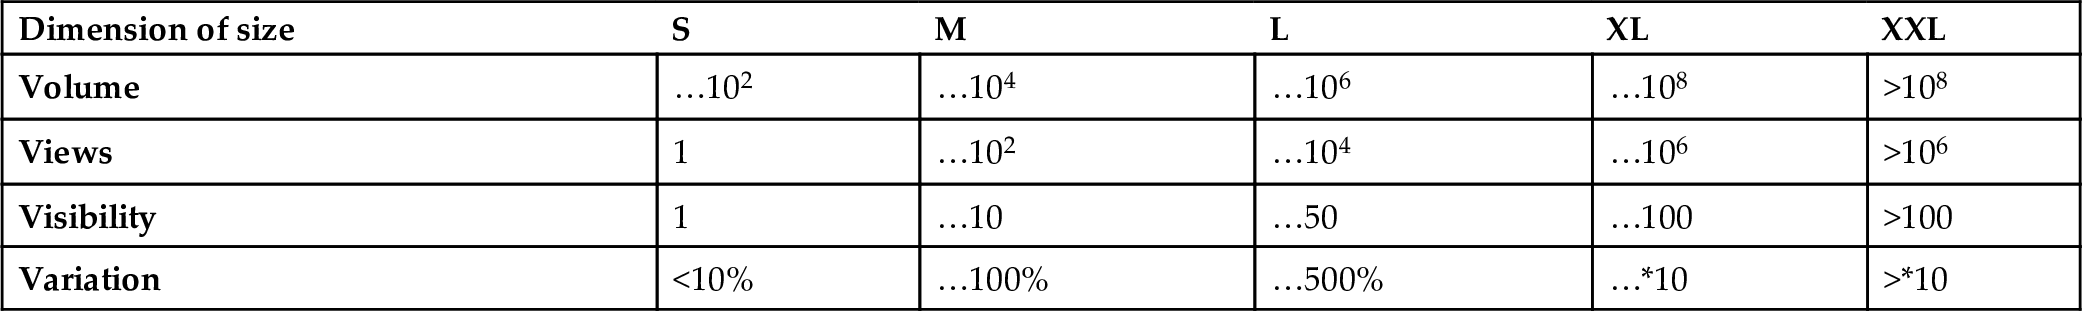
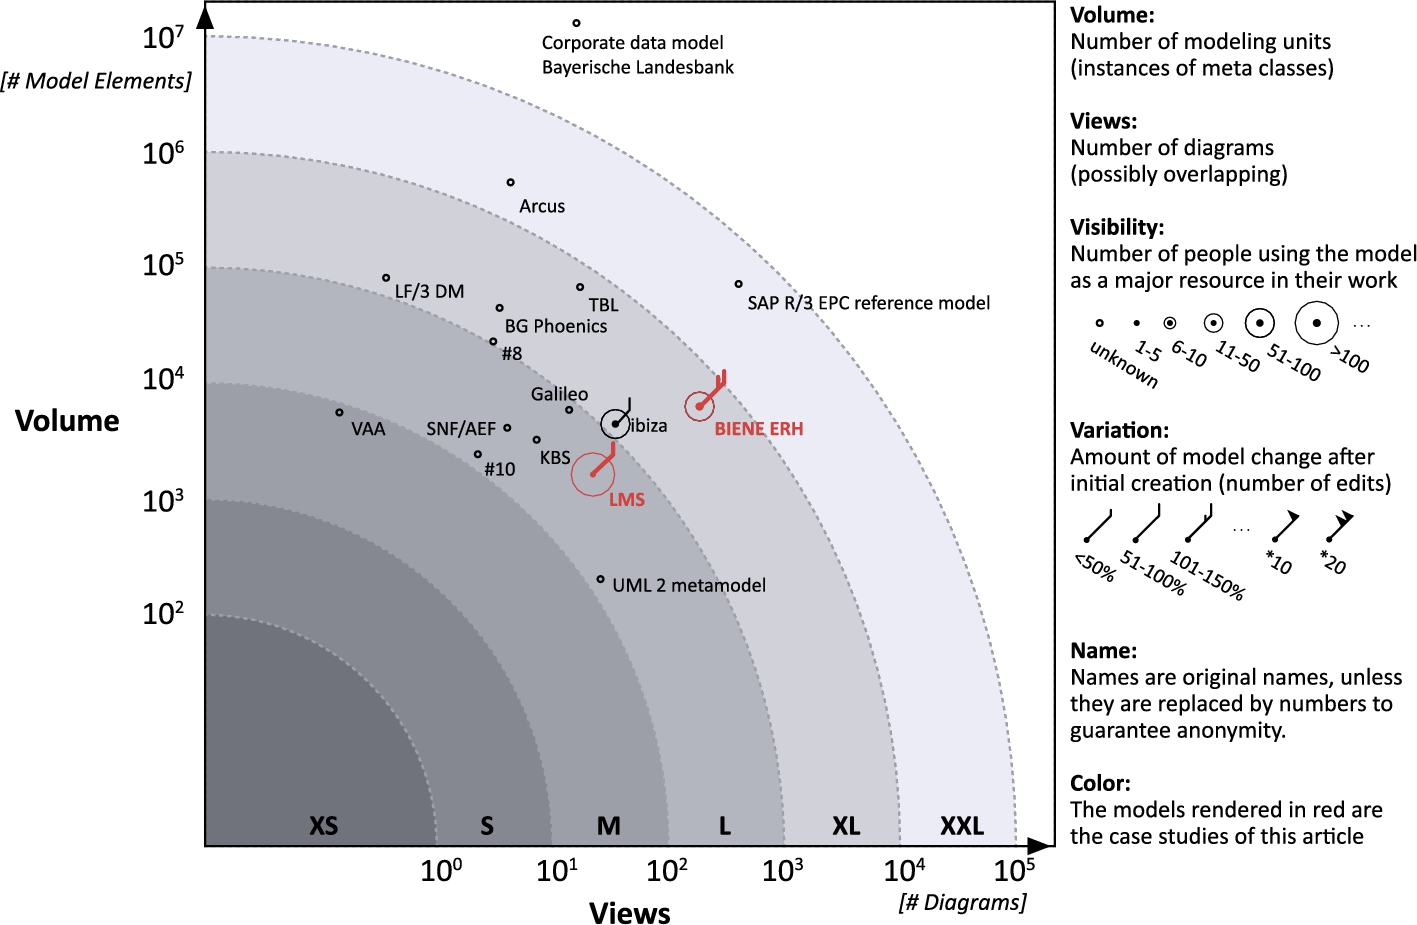
All of these characteristics represent important aspects of model size that are significantly different for large models than they are for small models. Table 7.1 documents what amounts to small or large models in these dimensions. These dimensions are relatively easy to measure, if access to the projects and its artifacts is available. In 2006 we conducted a survey on large models [29]. The results are summarized in Fig. 7.1, which shows the views and the volume as x- and y-positions, respectively. Where data are available, we have also charted the visibility as the circle size, and the variation as a flag inspired by wind strength representations on marine weather charts. Two of these are the case studies presented in Sections 7.5 and 7.6.
Table 7.1
Dimensions of model size: The magnitude of the majority of the metrics determines the overall size of a model.
| Dimension of size | S | M | L | XL | XXL |
|---|---|---|---|---|---|
| Volume | …102 | …104 | …106 | …108 | >108 |
| Views | 1 | …102 | …104 | …106 | >106 |
| Visibility | 1 | …10 | …50 | …100 | >100 |
| Variation | <10% | …100% | …500% | …⁎10 | >⁎10 |
7.3 Structuring big models
7.3.1 The need for structuring big models
Given the characteristics of large models discussed in the previous section, it is clear that many model creation and management tasks of large models are difficult in comparison to small models. This extends to the most basic activities associated to modeling: adding and retrieving knowledge to/from the knowledge base that is a model. For a small model, it is easy to see, literally, whether a certain fact is contained in the model, or not. It is just as easy to add a new nugget of knowledge in a way that it can be found again. For large models, that does not work.
Large volume means that a simple full-text search often yields too many false positives to be effective, and many views means that there are too many diagrams to be able to browse the model manually with reasonable effort. There have been many approaches to provide powerful search facilities on models that are suitable for large audiences [21,33], though their usability is still a problem largely unaddressed [1]. Therefore, high visibility means that there are many model users for whom more advanced search facilities are not accessible (cf. “End-user Modelers”, [2]). Employing external documentation to guide knowledge discovery is not an economically viable option in the face of frequent variation, and keeping discovery documentation in sync with the model implies substantial effort.
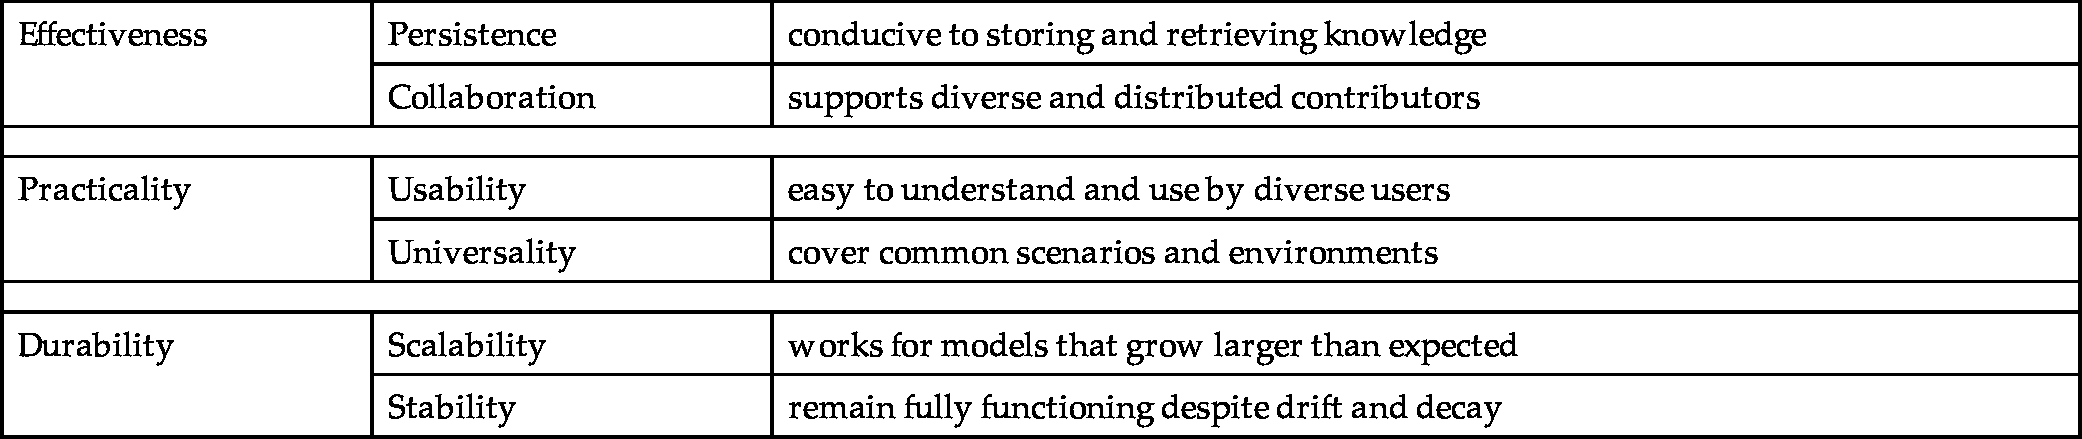
Similar problems arise for other, more advanced model management activities. So, clearly, there is a need to organize large models in a way to accommodate the effect of large size. We identify the following requirements for an approach to address these issues (see Table 7.2 for a summary):
- • Persistence: Clearly, the solution must provide a way to easily store and retrieve knowledge in large models. As a consequence, it should reduce the number of misplaced model elements, and thereby reduce the density of model clones [32,24].
- • Collaboration: Next, it must support the collaboration of diverse and distributed teams, with differing intents and capabilities.
- • Usability: Modeling is difficult in itself. Any solution to structuring a model should make modeling easier, not more difficult. As most modelers are experts in the respective domain that is being modeled rather than in conceptual modeling, the solution must be very simple to understand and apply. Complex features are not widely accepted.
- • Universality: It should be applicable in a wide range of contexts in terms of application scenarios, modeling languages, methodologies, and modeling tools. Tool-specific features are of limited use.
- • Scalability: The solution must scale up to large models, that is, hundreds and thousands of diagrams and model elements. As a rule of thumb, if a model persists, it grows an order of magnitude beyond what is initially expected.
- • Stability: Finally, large models can have a long enough lifetime for the environment to evolve beyond what could be imagined at the time of kick-off. A successful structuring solution must remain fully functioning despite evolution, drift, model decay, and growth.
Table 7.2
Requirements for solutions to structuring large-scale models.
| Effectiveness | Persistence | conducive to storing and retrieving knowledge |
| Collaboration | supports diverse and distributed contributors | |
| Practicality | Usability | easy to understand and use by diverse users |
| Universality | cover common scenarios and environments | |
| Durability | Scalability | works for models that grow larger than expected |
| Stability | remain fully functioning despite drift and decay | |
7.3.2 Means for structuring big models
The problem of structuring large models is similar to the need of large organizations to organize large corporate file shares. There, standardized directory structures are commonly found. This is a simple, universally applicable, and globally used solution.
We observe that all modeling tools and languages have some kind of grouping mechanism similar to file directories. Such model grouping mechanisms can be used to create an aggregation hierarchy similar to directory trees. We argue that such a solution addresses the requirements listed above in a particularly cost-effective way.
- ✔ Effectiveness: Obviously, the solution works for storing and retrieving electronic files (Persistence), and it works for thousands of people collaborating in large corporations (Collaboration). We see no reason why it should not work for model elements and diagrams.
- ✔ Practicality: Clearly, directory trees are readily understood and applied by very many people (Usability). It does not use any complex features or advanced tooling, and is thus generally applicable (Universality).
- ✔ Durability: Aggregation structures apparently scale up to very large structures (Scalability) and seem to be stable under decades of drift, decay, and growth (Stability).
In modeling languages and tools, different kinds of aggregation hierarchies have been proposed. First, there are static structures, like the aggregation tree readily found in modeling tools for UML, EPCs, or BPMN (see Fig. 7.3 for an example). Some modeling languages even have specific model elements for structuring models, e.g., Package3 in UML, or the model groups of ADONIS. Second, many tools offer dynamic grouping, e.g., views or collections that are computed based on filters or queries. Changing the underlying model can be reflected automatically in updated views. Also, views can overlap, which is clearly an advantage over static structures. However, dynamic views are strongly dependent on tools and require extra facilities for sharing and persistence. This approach is thus vulnerable to drift and evolution. Third, naming conventions can be used to establish groups of model elements or submodels. This structuring mechanism has the disadvantage that it is difficult and error-prone to change or extend naming conventions once in place. However, they can be used in addition to static (or dynamic) model structures to establish additional relationships or structures.
In summary, we believe that static aggregation structures are the best solution to organize big models. In the next section, we define the basic terminology for model structuring, provide examples, and show how model structures can be described visually.
7.4 Describing and specifying model structures
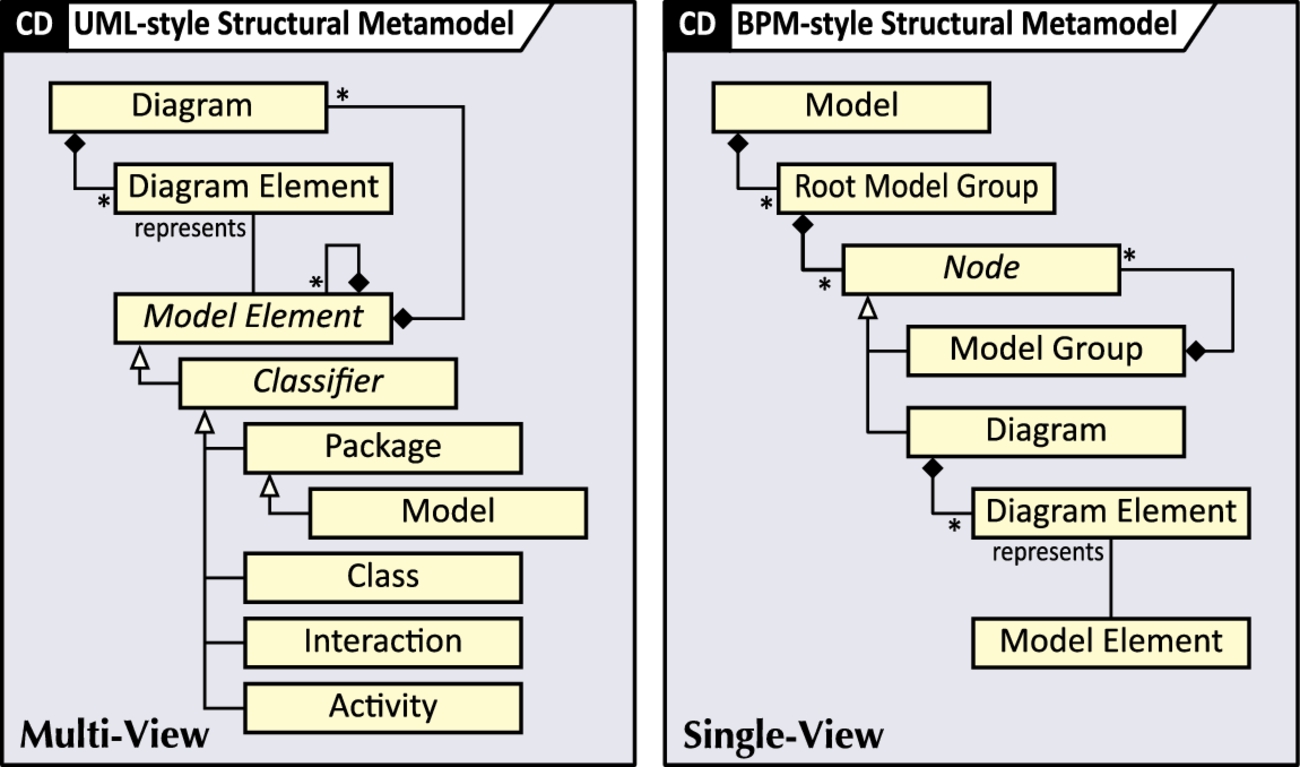
From our point of view, models are trees with three kinds of nodes: diagrams, model elements, and submodels. A model, then, is an individual root unit into which other model elements, diagrams, or submodels are nested. There are two major paradigms how such trees can be organized.
On the one hand, there is the multiview paradigm typically found in software engineering, and exemplified by UML with model elements that act as containers and may be nested recursively to form a containment tree. Diagrams and their elements appear only as the leaves of this tree, and there is an n-to-1 element between model elements and diagram elements. That is to say, model elements may occur in no diagrams, or in several diagrams. For instance, in UML, the top-level root unit is a Package into which more Classifiers like Package, Class, Activity, or Interaction are nested recursively.
On the other hand, there is the single-view paradigm, which is commonly found in BPM or Matlab/Simulink contexts. For instance, ADONIS offers Root model groups and Model groups as tool facilities outside the language proper to define the containment structure with diagrams at the leaves of this tree. The model elements proper are contained in the diagram, not in the structural containment tree as such. In particular, diagrams and model elements are not nested recursively. Fig. 7.2 summarizes and juxtaposes the multi- and single-view model structure paradigms.
If a model does not have any nested submodels we call it a simple model, and its type is solely determined by the kinds and numbers of model elements and diagrams contained in the model, along with any constraints and restrictions applied to them. A model with nested model elements is called a compound model. Its type is determined not just by the model elements and diagrams it contains, but also by the submodels, and possibly by their multiplicity. As a consequence, the structure of a model is a tree where each inner node carries an (implicit) type.
Consider a simple class diagram describing the concepts of an application domain (we will use this as our running example). In a UML context, we would probably describe each concept as a Class with Attributes and Operations, connected by Associations and Generalizations (“inheritance”). One would likely create a class diagram and join the elements and the diagram together in a Package which might carry a name like Information model. In UML, Operations and Attributes of Classes are model elements in their own right, but nested inside the Class. Also, Operations and Attributes may contain other model elements like Parameters and Visibilities, and so on. In fact, whole Classes may be nested inside other Classes. In a modeling guideline, we would want to specify this constellation exactly, along with any naming conventions, multiplicity constraints, and other side conditions. Clearly, using prose is not a very convenient tool even for the simplest, most traditional flat type of model.
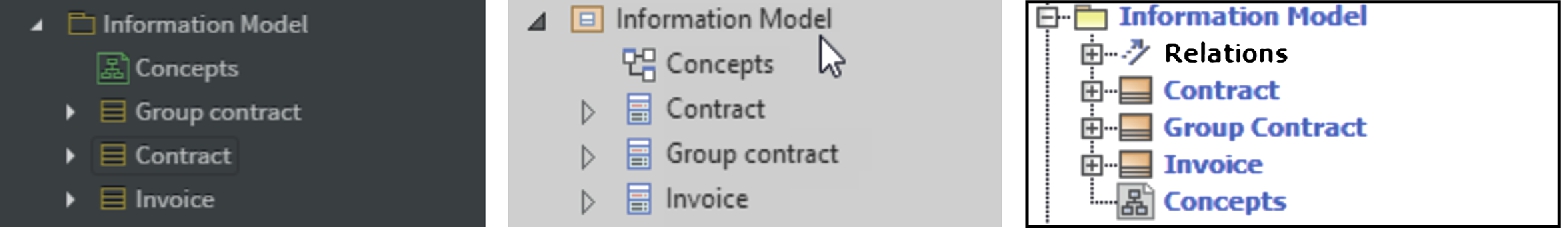
Alternatively, one might actually model the desired structure in a modeling tool and capture the resulting model structure. Fig. 7.3 shows the aggregation trees from three popular UML tools, i.e., MagicDraw UML, StarUML, and Enterprise Architect.4 While this is a straightforward way to create templates in a given setting, it comes with several disadvantages. First, actually creating model structures first means considerable effort and creates tool-specific artifacts. For instance, consider the different handling of Associations by the three tools in Fig. 7.3: MagicDraw groups them in a virtual node “Relations,” while StarUML and Enterprise Architect hide them altogether. Enterprise Architect also hides the Generalization. Secondly, model outlines created this way are only examples, not generic specifications. Any variation points and constraints would still have to be described in prose, adding more effort.
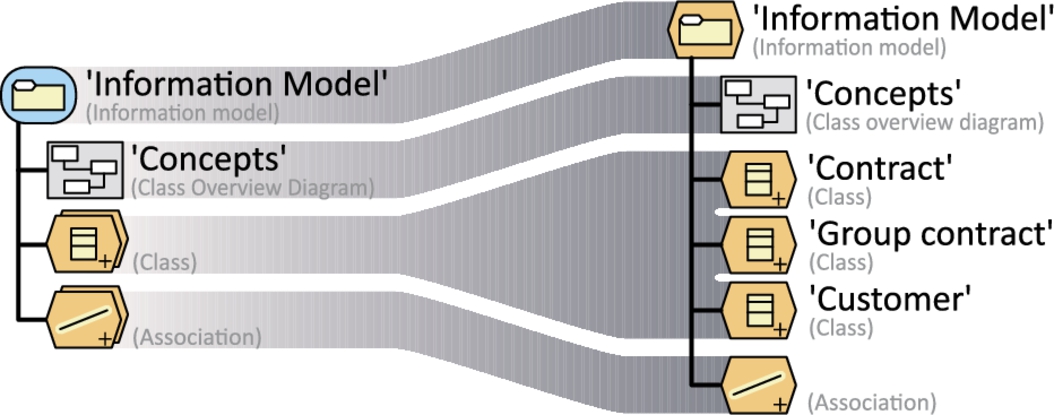
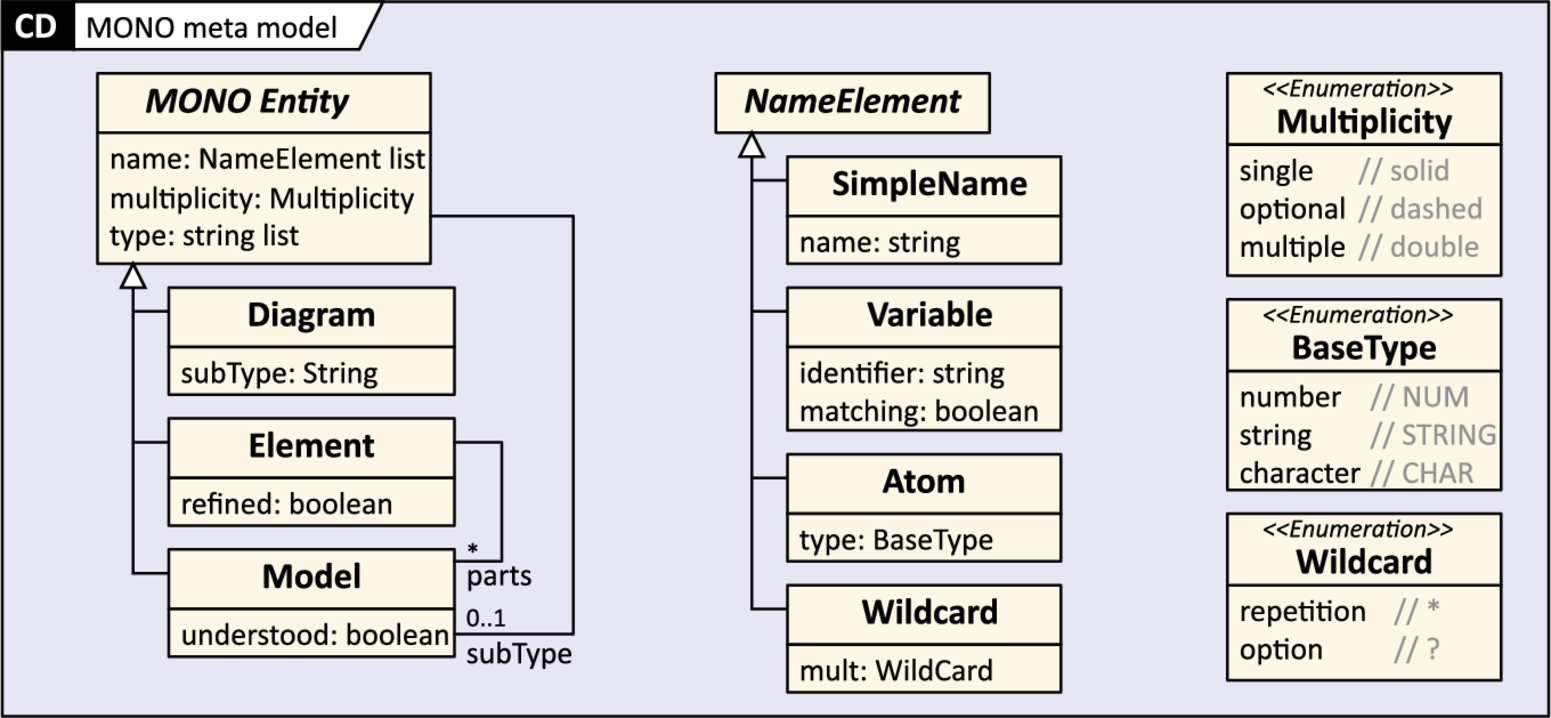
In order to allow for tool-independent, generic descriptions of model structures with less overhead, we propose MONO (Model Outline NOtation), a visual notation to describe model outlines. The notation is straightforward and can easily be emulated with any drawing tool. Fig. 7.4 shows our running example model outline Information model. On the left of Fig. 7.4, we show a one-to-one translation of the model outlines shown in Fig. 7.3. On the right, we present a more abstract specification of this model structure. Fig. 7.6 defines the MONO metamodel.
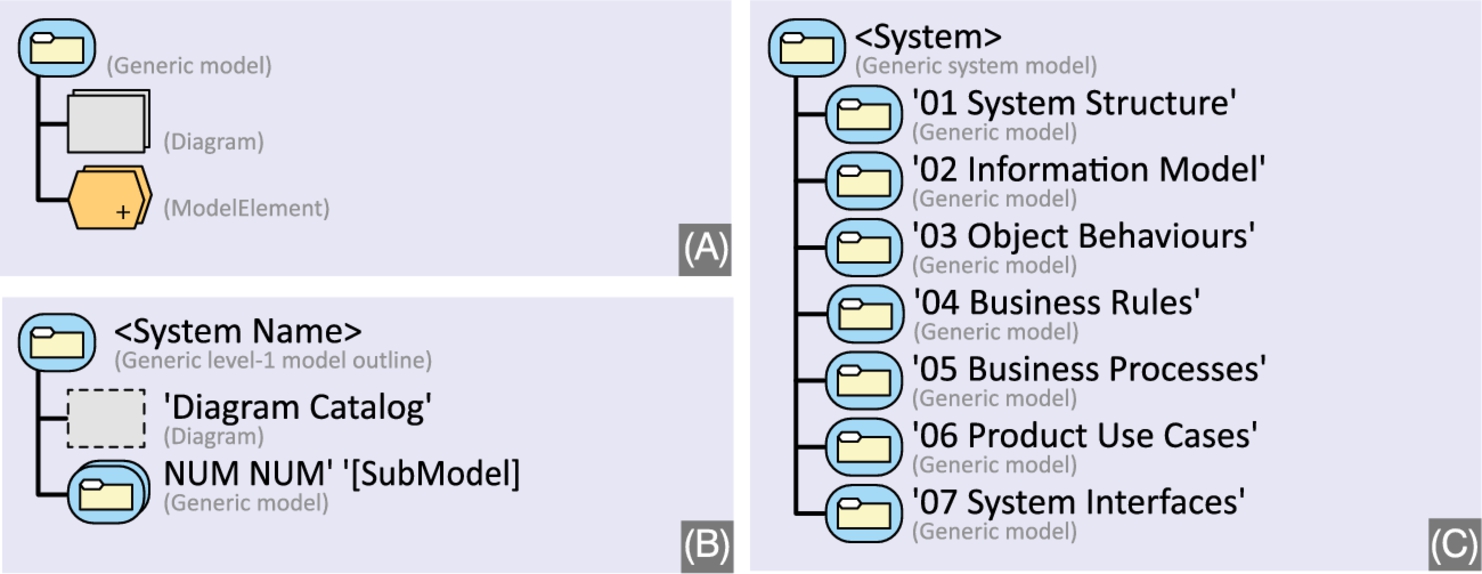
MONO distinguishes three kinds of entities, i.e., models, diagrams, and model elements, represented by graphemes with different color and shape, where gray rectangles represent diagrams, amber hexagons represent model elements, and blue roundtangles represent (sub)models. Entities may be further differentiated into subtypes by nesting an icon. Entities may be equipped with a name and/or type annotation, e.g., a specific name or type, but more complex expressions are also possible (see below). Stacking two entity icons expresses multiplicity; refinement by entities of the same kind is indicated by the plus sign in the bottom right corner. Lists of entities that are understood or defined elsewhere are represented by a named entity icon with three dots. The names of elements can be specified using a combination of constant strings in single quotes, character classes as all caps, named variables in brackets, and some regular expression-like multiplicities. Additionally, white spaces and round brackets can be used for legibility. Fig. 7.5 summarizes the elements of our notation.
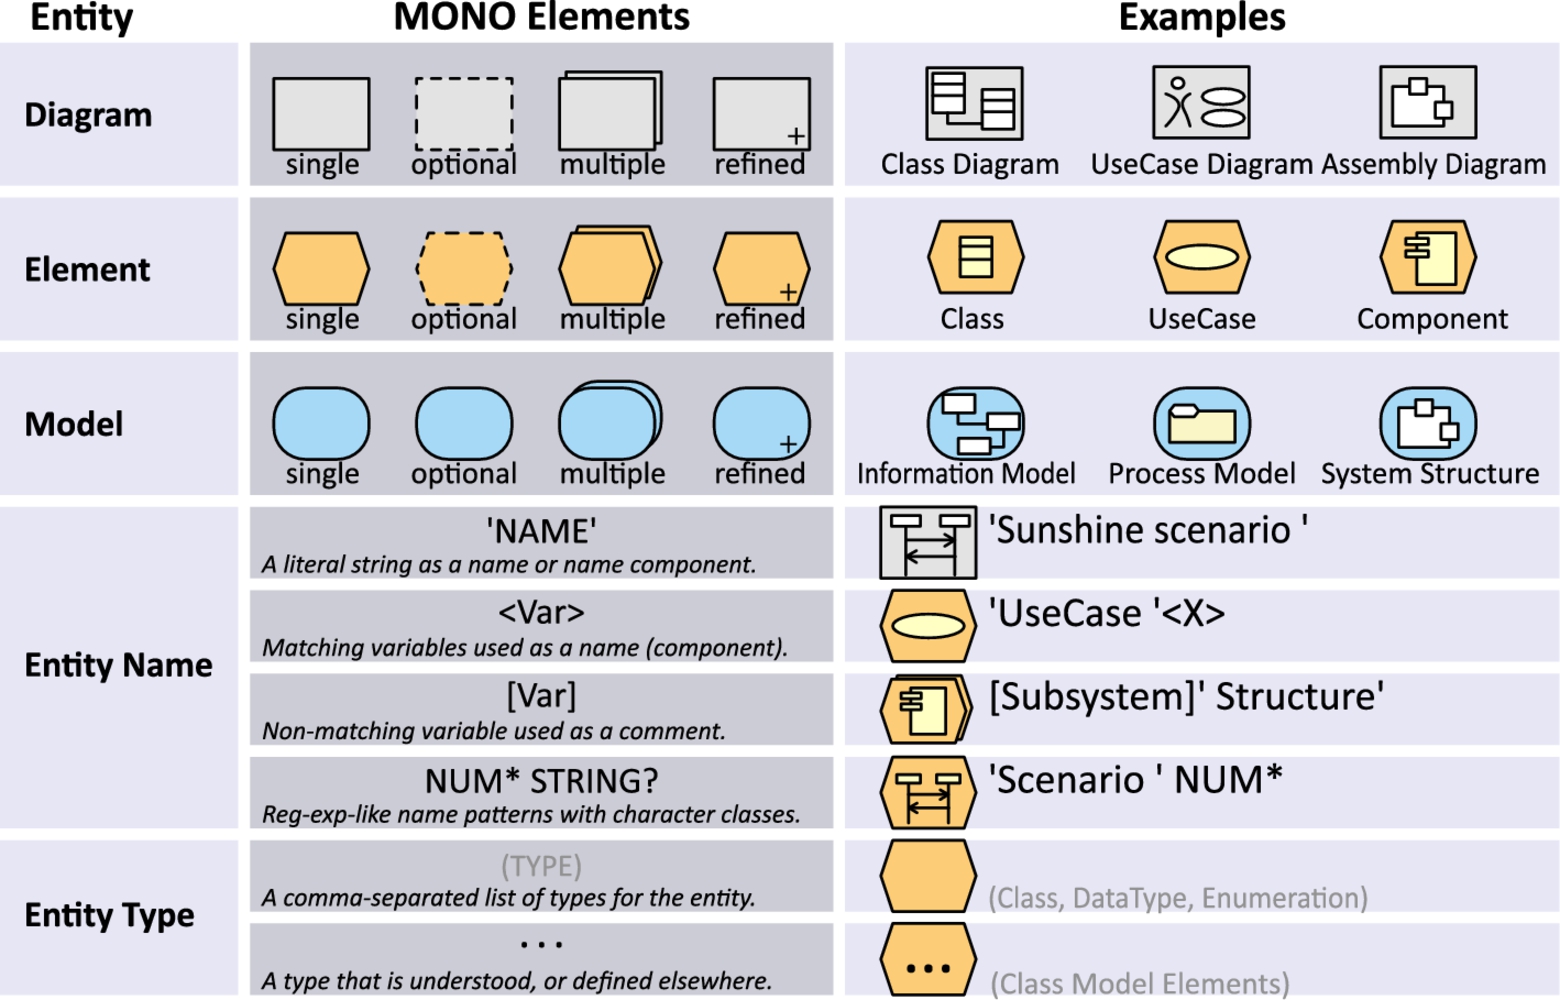
Elements may be further differentiated into subtypes by nesting an icon. For instance, different types of diagrams may be distinguished by the icon in the gray box. If the icon is filled white it is just a visual identifier that serves to distinguish one element from another. If the icon is yellow (light gray in print version), however, it refers to a particular model element. When used with a model entity, it indicates the type of model element used as the container. For instance, the Process model in Fig. 7.5 is nested inside a Package element. Conversely, the System structure model type does not indicate what kind of model element it is nested into. In this case, the container is also a Package, though, as this is the default. For added clarity, we suggest to also provide an explicit type annotation below the naming constraint. This may refer to an existing type of model element or diagram, or a user-defined one, including names of submodels. Instead of providing a single type, comma-separated lists may be used.
With this notation, we can now express more complex model outlines effectively. Fig. 7.7 demonstrates how MONO can be used to define recursive model structures, allowing for reuse and succinct declarations. Outline (A) defines the most generic model structure: a package with any number and any kind of diagram and model element, with no naming restrictions. Outline (B) defines a top-level structure where the root is a Package containing an optional diagram named Diagram catalog, and any number of generic submodels as defined by (A). The names of the submodels are made up of two numeric characters, a space, and an arbitrary, meaningful name for a submodel. Outline (C) defines a first-level model outline with concrete names. Observe that outline (C) satisfies the constraints imposed by outline (B). So, instances of outline (C) are also instances of outline (B), but not the other way around.
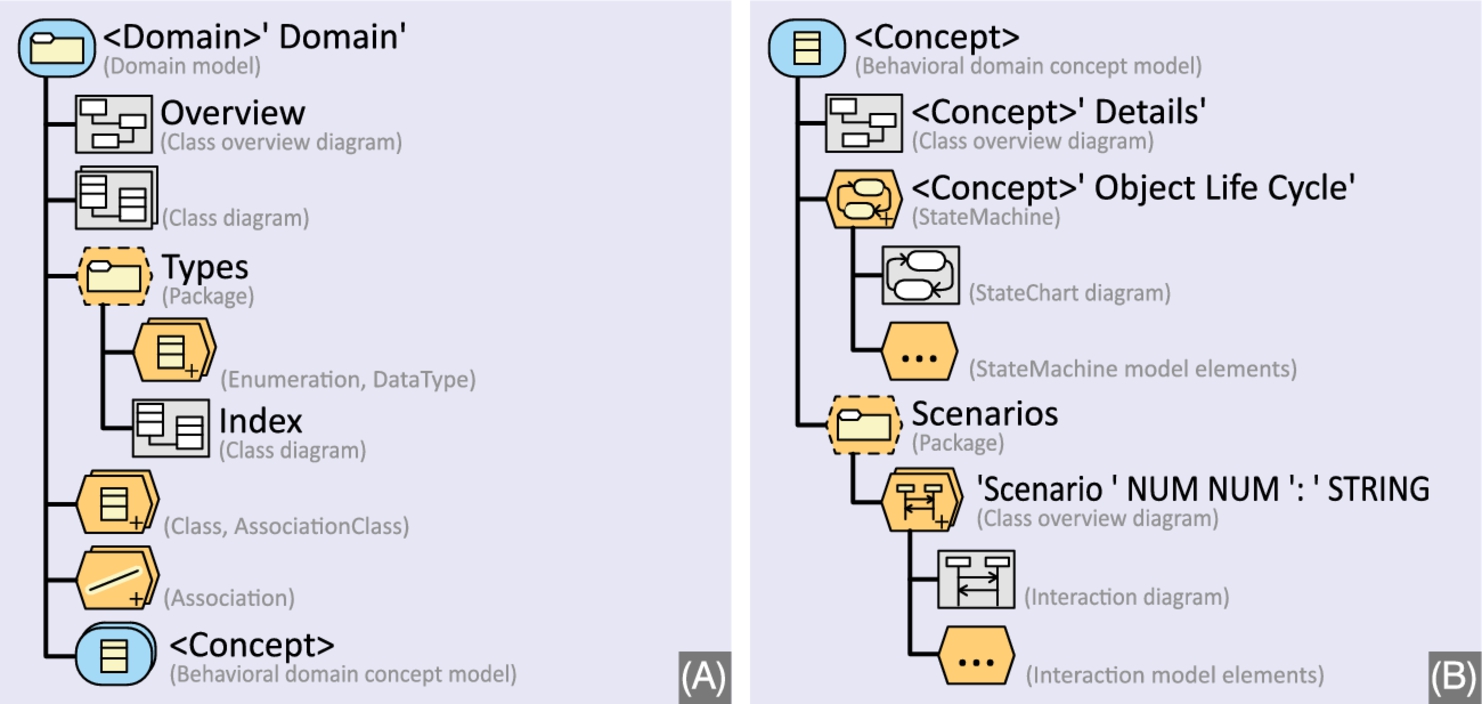
A further model is shown in Fig. 7.8. It defines domain model structures which contain both structure and behavior. By structuring, it allows for larger models while maintaining a manageable structure. The domain model defines an overview diagram and detail diagrams, a Package for data type declarations with a diagram as index, the usual model elements for class models, and a set of submodels to elaborate on particularly complex domain concepts. Those special domain concepts come with an overview diagram, a StateMachine for the object life cycle, and, optionally, a Package with Interactions. Note that the details for the Interactions and the StateMachine are not made explicit here, as they are understood. In fact, all of the detail structure of the Interactions and the StateMachine could have been omitted.
7.5 Case study 1: Library Management System (LMS)
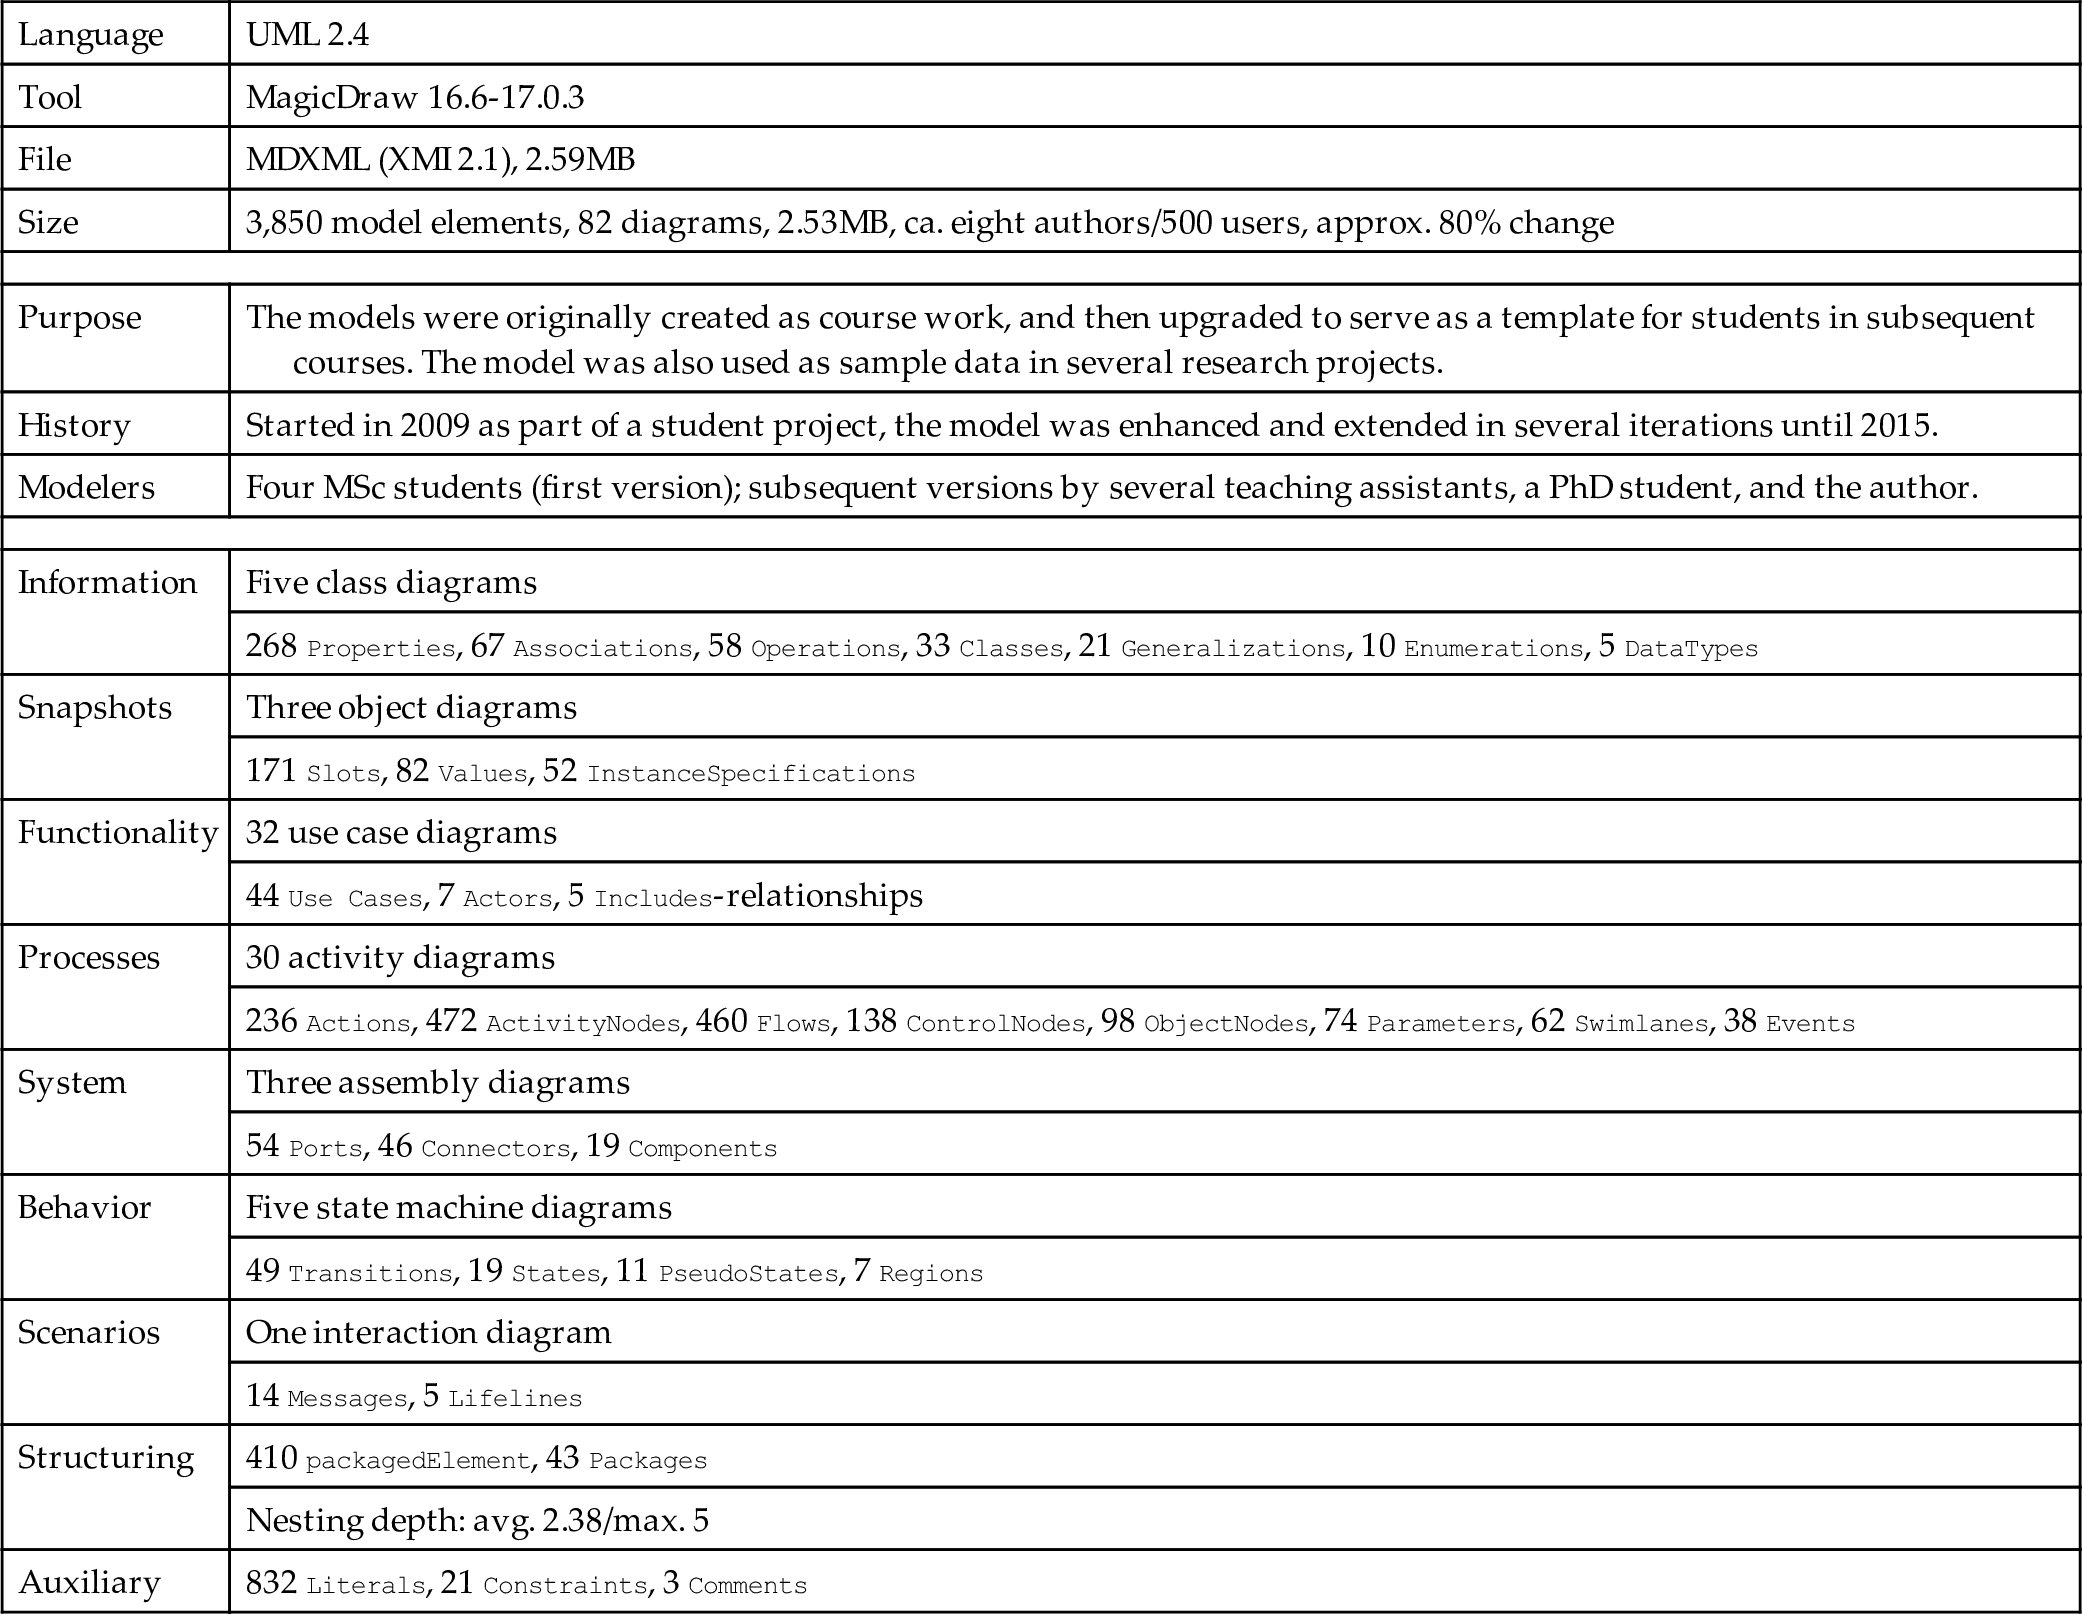
The Library Management System (LMS) is a large UML model used mainly for academic teaching. Table 7.3 provides an overview of the most important structural and size metrics. This case study exemplifies the multiview model structuring paradigm.
Table 7.3
A summary description of the Library Management System (LMS) model.
| Language | UML 2.4 |
| Tool | MagicDraw 16.6-17.0.3 |
| File | MDXML (XMI 2.1), 2.59MB |
| Size | 3,850 model elements, 82 diagrams, 2.53MB, ca. eight authors/500 users, approx. 80% change |
| Purpose | The models were originally created as course work, and then upgraded to serve as a template for students in subsequent courses. The model was also used as sample data in several research projects. |
| History | Started in 2009 as part of a student project, the model was enhanced and extended in several iterations until 2015. |
| Modelers | Four MSc students (first version); subsequent versions by several teaching assistants, a PhD student, and the author. |
| Information | Five class diagrams |
| 268 Properties, 67 Associations, 58 Operations, 33 Classes, 21 Generalizations, 10 Enumerations, 5 DataTypes | |
| Snapshots | Three object diagrams |
| 171 Slots, 82 Values, 52 InstanceSpecifications | |
| Functionality | 32 use case diagrams |
| 44 Use Cases, 7 Actors, 5 Includes-relationships | |
| Processes | 30 activity diagrams |
| 236 Actions, 472 ActivityNodes, 460 Flows, 138 ControlNodes, 98 ObjectNodes, 74 Parameters, 62 Swimlanes, 38 Events | |
| System | Three assembly diagrams |
| 54 Ports, 46 Connectors, 19 Components | |
| Behavior | Five state machine diagrams |
| 49 Transitions, 19 States, 11 PseudoStates, 7 Regions | |
| Scenarios | One interaction diagram |
| 14 Messages, 5 Lifelines | |
| Structuring | 410 packagedElement, 43 Packages |
| Nesting depth: avg. 2.38/max. 5 | |
| Auxiliary | 832 Literals, 21 Constraints, 3 Comments |
7.5.1 Model creation and evolution
The LMS was created as a teaching example. It originated in 2009, when four students created it as their course work assignment in an MSc-level 13-week Requirements Engineering course taught by the author at the Technical University of Denmark (DTU, www.dtu.dk). After that, the model was sanitized and extended, to serve as a template solution for students in subsequent instances of the course. The model evolution lasted until 2015, when the author ceased to teach that course. During that time, the model was continuously adapted, improved, and extended by a sequence of teaching assistants, a PhD-student, and the author. The model was also used as a template and study example in other modeling-related courses taught by the author, and as sample data in several research projects.
The model is expressed in UML 2.4 using a full-blown MagicDraw modeling environment, including the TeamWork Server and several actively used plugins. In line with the mainly educational intent of the model, a wide set of notations and concepts of UML were used, which is not necessarily representative of industrial usage. Also, the focus was on syntactical correctness and methodological effectiveness rather than domain fidelity.
7.5.2 Model usage
The LMS model has mainly been used as a teaching example in several courses at the MSc- and BSc-level where modeling played an important role. Students in those courses were asked to create a large model, or parts of a model, for some application domain. The resulting model was a major part of the course assignment, so it was fairly important to the students and they demanded detailed guidance on what to create. In order to provide this guidance the students were given the LMS model together with a detailed report explaining its content in prose. This case study also served as a very detailed example for many aspects of modeling, and was used as the running example in all course materials.
7.5.3 Model structure
The outline of the LMS model is shown in Fig. 7.9. The guiding metaphor for this model outline is that of a course syllabus, which is of course a consequence of the main usage scenario of this model as a pedagogic tool. This impacts the model outline in several ways.
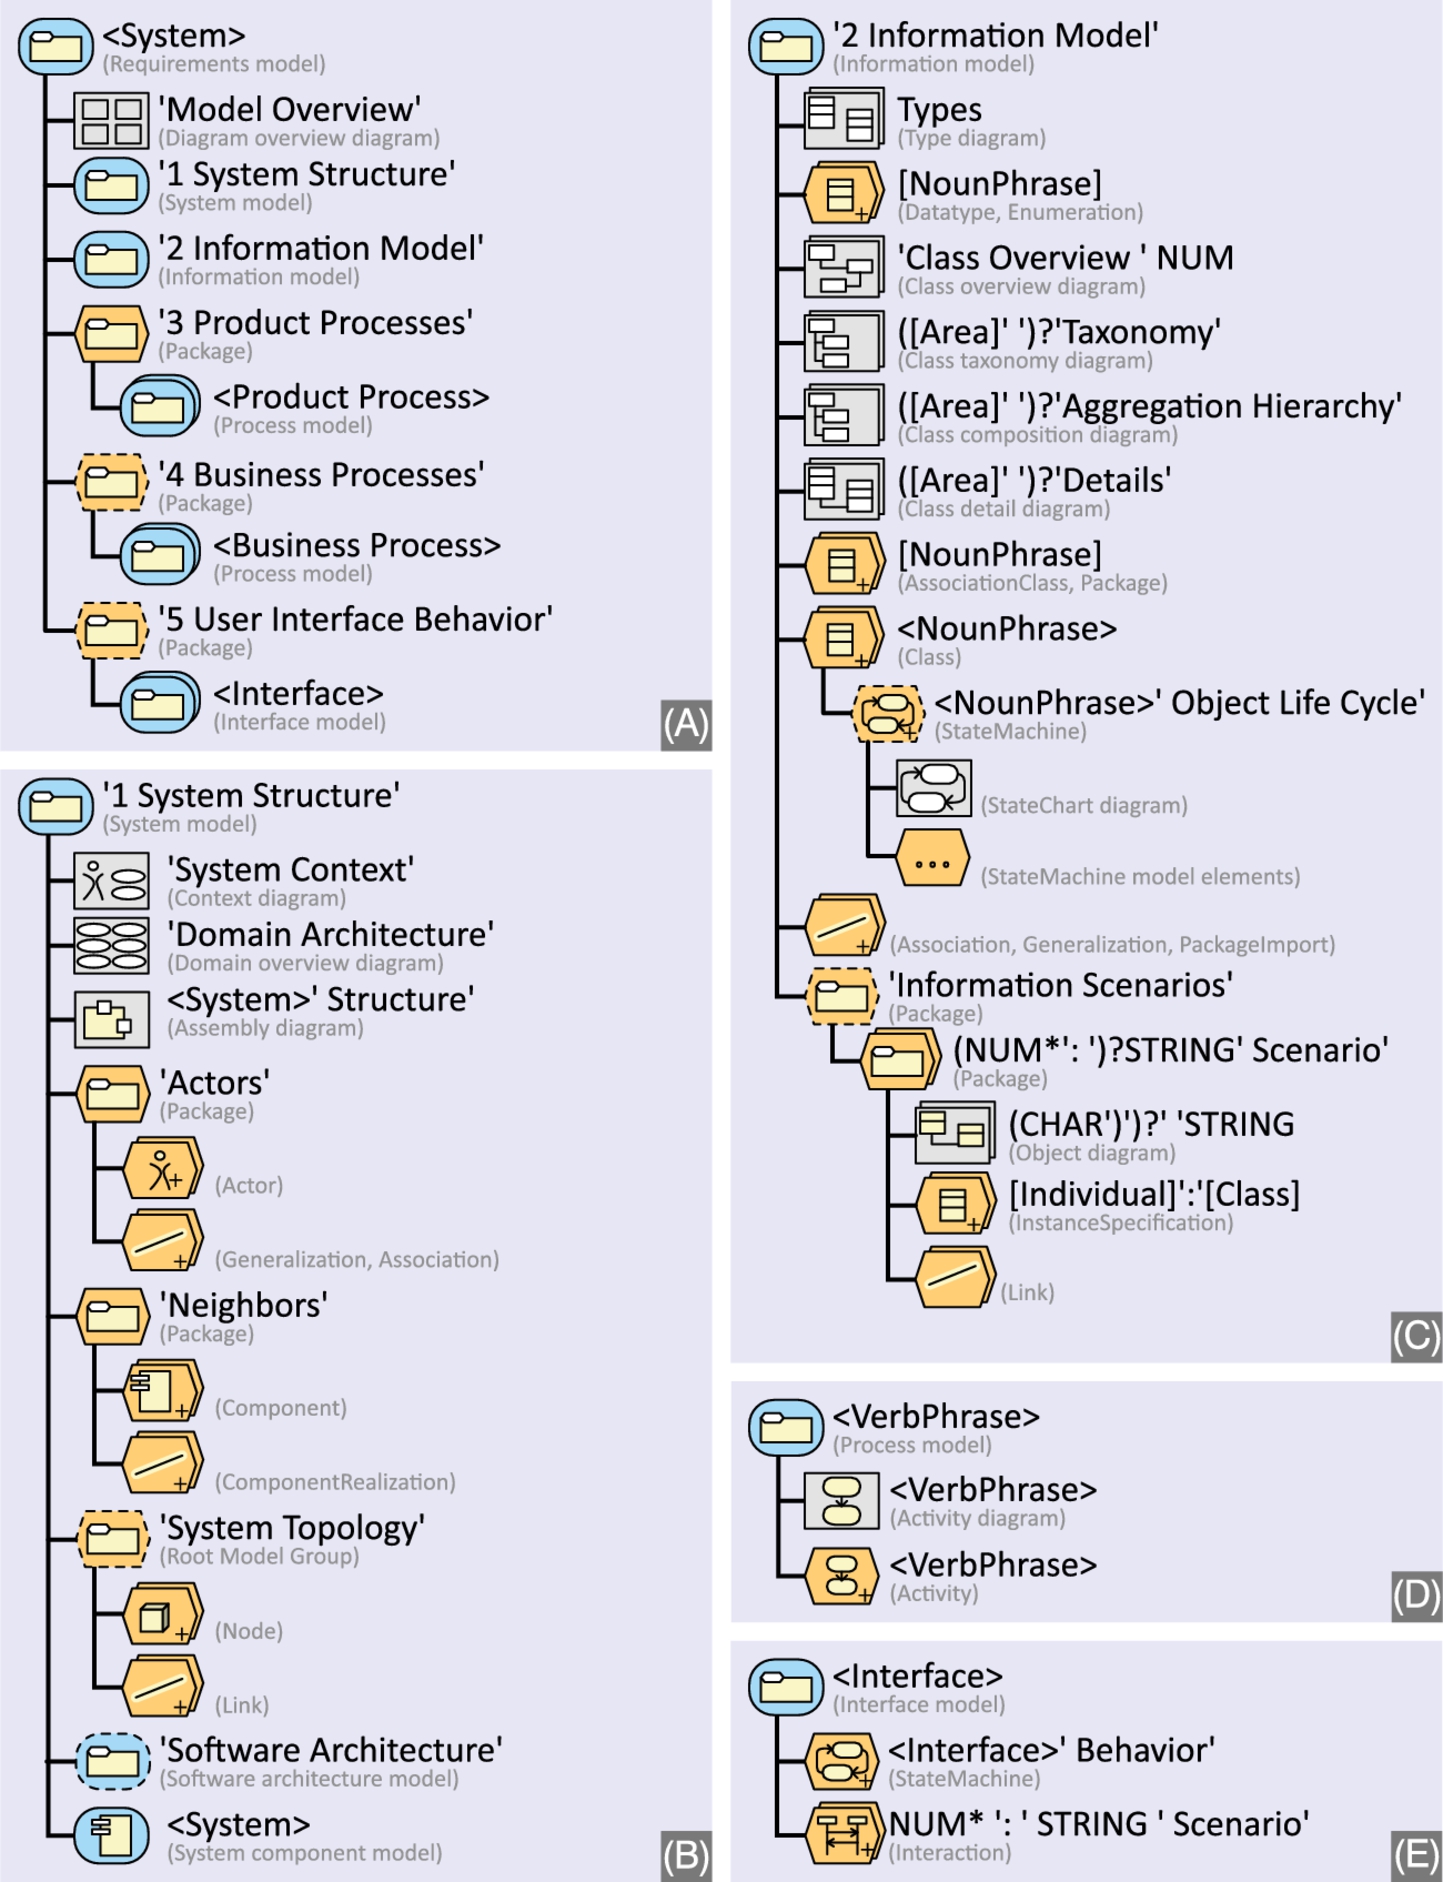
First, the top-level Packages reflect different kinds of models that can be used independently in diverse contexts: courses with different focus and scope can use different constellations of submodels. Second, the top-level Packages (see Fig. 7.9A) have fixed names and start with a number. That way, it is easier to identify parts of the model without leaving room for misunderstandings. The initial numbers ensure that these packages always appear in a specific order, reflecting the course syllabus. Third, the names and scopes of submodels and entities are chosen to be as generic as possible so that they can indeed be used independently. In a more restricted environment with specific constraints on the size, purpose, and domain of the model, the outline could be more streamlined to better match the environment. Conversely one might argue that a generic, standardized structure is better suited to accommodate project drift and other characteristics of large models (see our discussion in Section 7.2).
The first two submodels – 1 System Structure and 2 Information Model – are “true” submodels in the sense that they are elaborate substructures that could exist independently (see Fig. 7.9B and C). The submodels 3–5, on the other hand, are just containers for sets of simpler structures (see Fig. 7.9D and E; note that one of the submodel types is used twice).
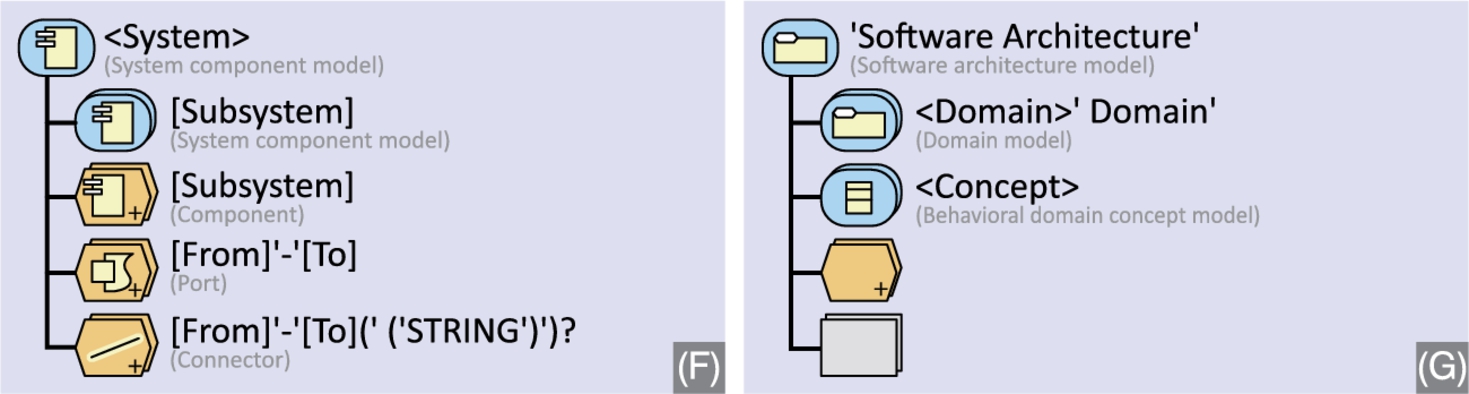
Submodel 1 System Structure exhibits a recursive structure that allows to nest models arbitrarily; see Fig. 7.9B and Fig. 7.10F. Note that in Fig. 7.10F, subsystems can be either flat (i.e., simple components) or refined, in which case a new “System component model” may be instantiated. Of course, only one of the two should be done for any system, but MONO is not sufficient to express this constraint. It has to be expressed externally, e.g., by a prose description. Fig. 7.10F allows construction-level submodels without constraining them.
Submodel 2 Information Model shows a particular kind of rich class model with optional object life cycles for classes, and scenarios consisting of ensembles of InstanceSpecifications and object diagrams to model specific states. In this submodel, there are also several instructive instances of naming constraints with matching variables, commentary variables, various multiplicities, and regular expressions.
7.6 Case study 2: BIENE Erhebung (ERH)
The BIENE Erhebung model (ERH) is a large model created by the tax authorities of the German federal states for gathering and validating requirements of, and for informing construction and deployment of, administrative systems concerned with levying taxes.5 Table 7.4 provides an overview of the most important structural and size metrics. This case study exemplifies the single-view model structuring paradigm.
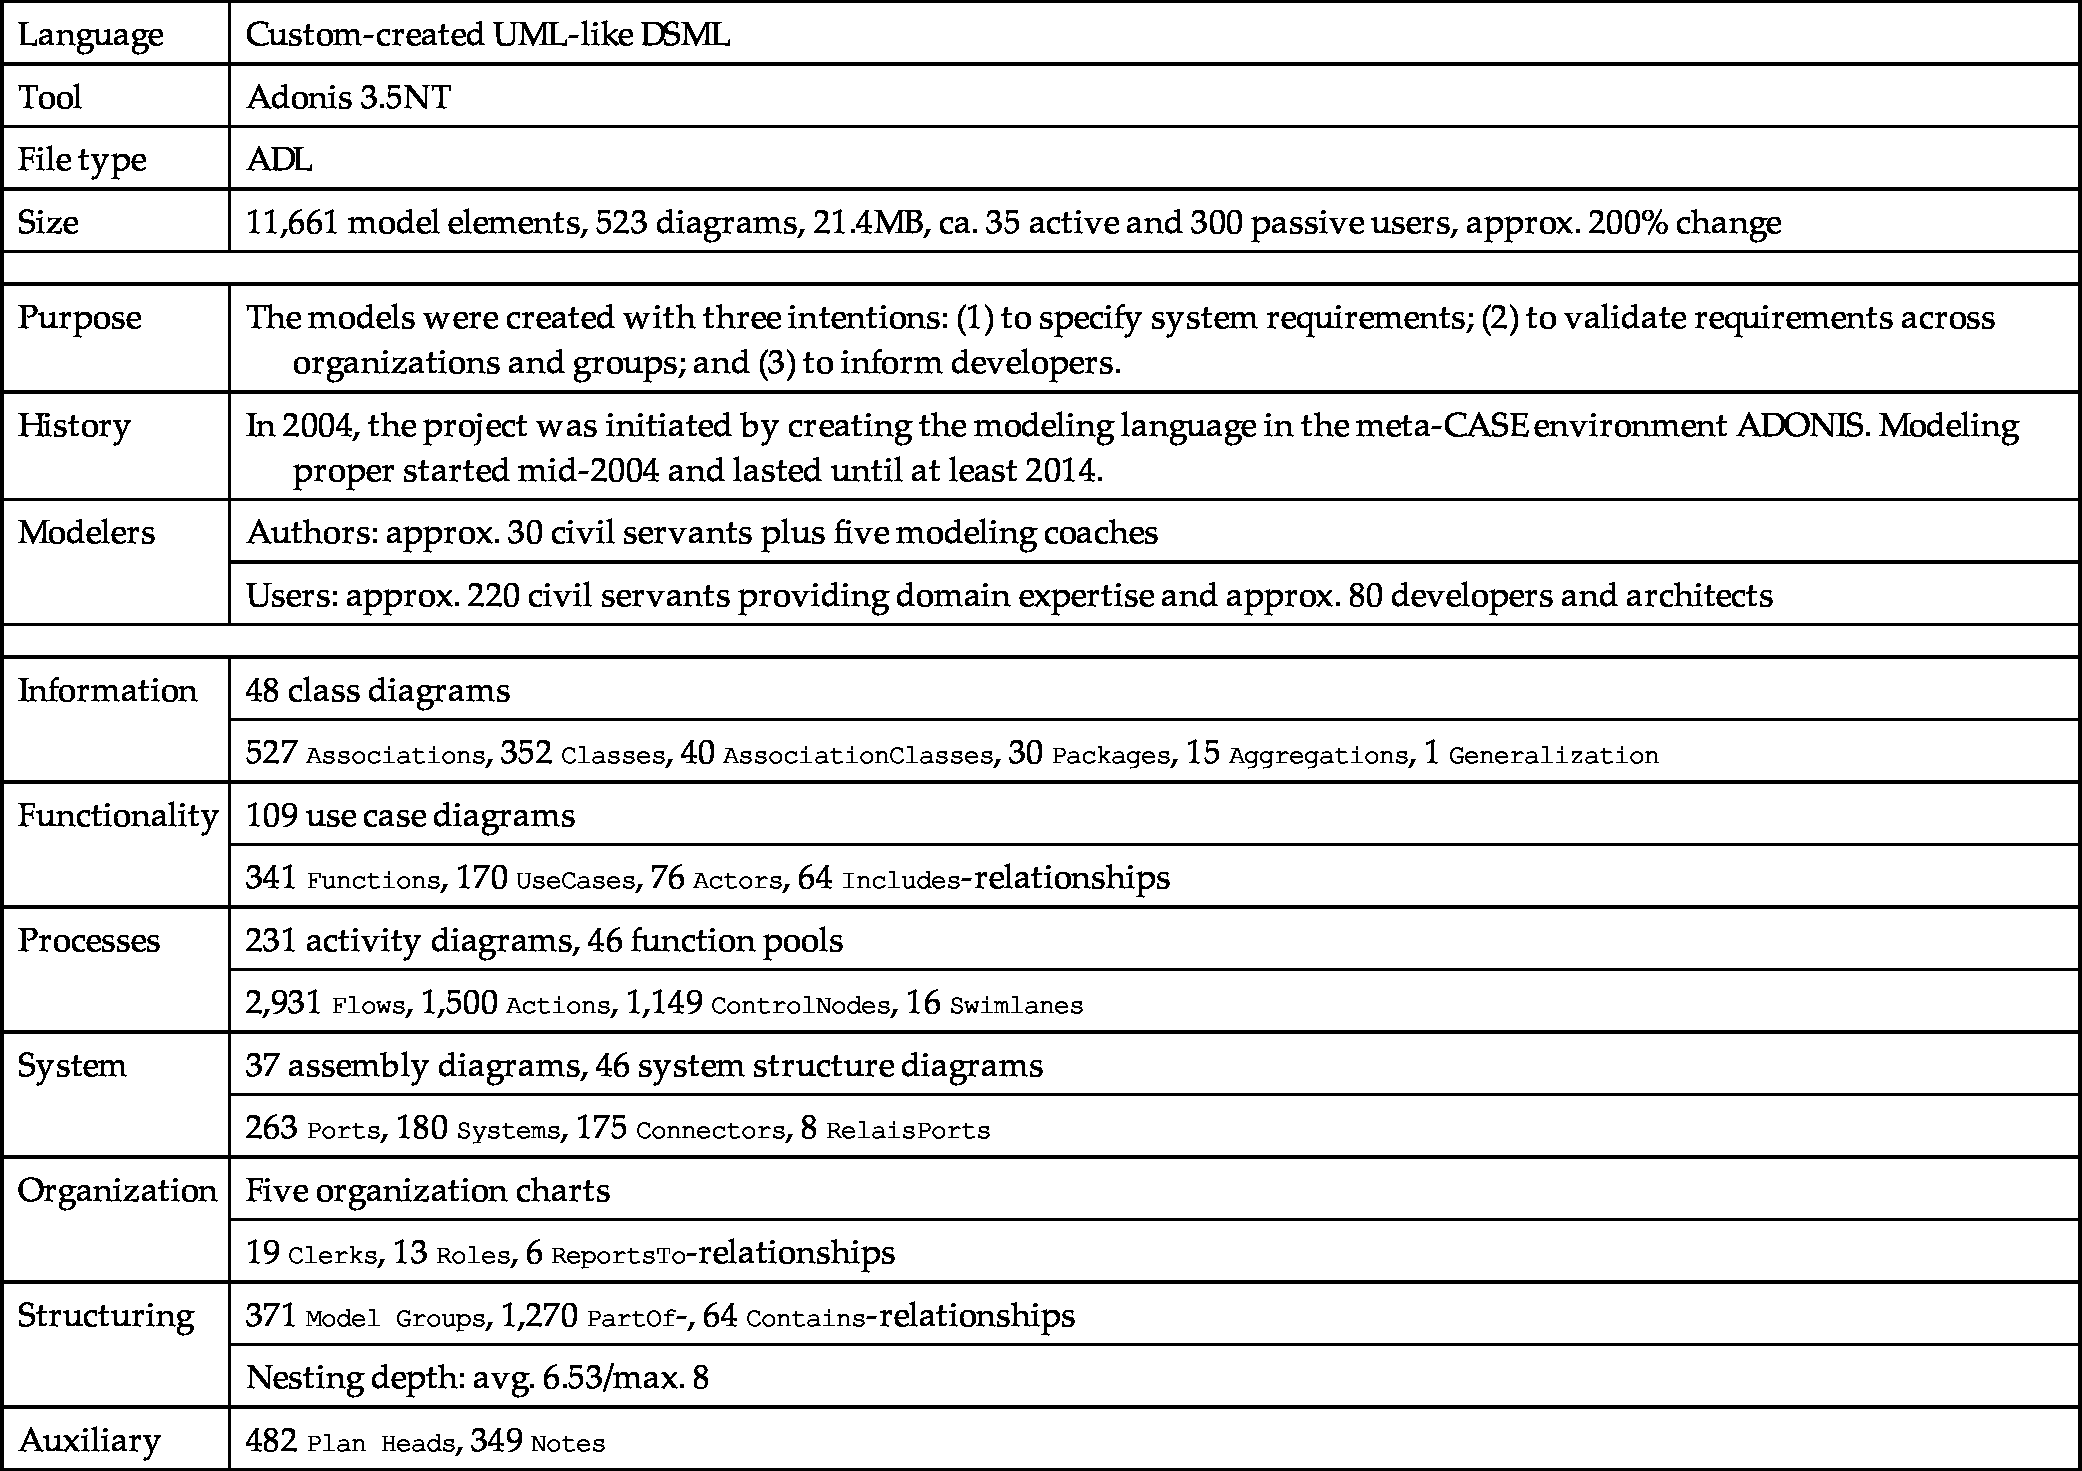
Table 7.4
A summary description of the BIENE ERH model.
| Language | Custom-created UML-like DSML |
| Tool | Adonis 3.5NT |
| File type | ADL |
| Size | 11,661 model elements, 523 diagrams, 21.4MB, ca. 35 active and 300 passive users, approx. 200% change |
| Purpose | The models were created with three intentions: (1) to specify system requirements; (2) to validate requirements across organizations and groups; and (3) to inform developers. |
| History | In 2004, the project was initiated by creating the modeling language in the meta-CASE environment ADONIS. Modeling proper started mid-2004 and lasted until at least 2014. |
| Modelers | Authors: approx. 30 civil servants plus five modeling coaches |
| Users: approx. 220 civil servants providing domain expertise and approx. 80 developers and architects | |
| Information | 48 class diagrams |
| 527 Associations, 352 Classes, 40 AssociationClasses, 30 Packages, 15 Aggregations, 1 Generalization | |
| Functionality | 109 use case diagrams |
| 341 Functions, 170 UseCases, 76 Actors, 64 Includes-relationships | |
| Processes | 231 activity diagrams, 46 function pools |
| 2,931 Flows, 1,500 Actions, 1,149 ControlNodes, 16 Swimlanes | |
| System | 37 assembly diagrams, 46 system structure diagrams |
| 263 Ports, 180 Systems, 175 Connectors, 8 RelaisPorts | |
| Organization | Five organization charts |
| 19 Clerks, 13 Roles, 6 ReportsTo-relationships | |
| Structuring | 371 Model Groups, 1,270 PartOf-, 64 Contains-relationships |
| Nesting depth: avg. 6.53/max. 8 | |
| Auxiliary | 482 Plan Heads, 349 Notes |
7.6.1 Model creation and evolution
The BIENE project aspires to replace the software for handling all tax-related payments and the associated processes in the federal states of Germany. Those systems have been in operation since the 1950s and 1960s, and have been under heavy maintenance ever since to accommodate multiple layers of jurisdiction and regulation, from the European Union level via national and state levels to organizational rules of the tax authorities of the 16 federal states of Germany. Most of these systems were written in COBOL and Assembler for mainframe computers. They still run today and will likely continue to do so for years to come. So, it is not unreasonable to expect a BIENE lifetime in the same range. For political reasons, BIENE is a federated project with teams working in several cities. BIENE is a very large, mission-critical, and high-risk project with a long and painful history of failed previous attempts.6
In the first six months of the BIENE project, a Domain-Specific Modeling Language (DSML) was created together with the domain experts. It offers a syntax inspired by UML but with a much smaller and more concise metamodel, plus several specialties to address domain needs. The DSML is implemented using the ADONIS BPM metamodeling tool (then a commercial tool, now open source [16]; see www.adonis-community.com/en). In addition to the language proper and the modeling tool to support it, a development process was tailored for BIENE, following the VM'97 standard that was mandatory in Germany at the time for large public projects like BIENE [11]. Also, several more detailed guidelines on modeling, tool usage, and other aspects were created when the need emerged. Altogether, the package comprising the language, tool, method, and guidelines will henceforth be called the environment. After the initial six-month development period, small adjustments were continuously made to the environment for four years.
7.6.2 Model usage
After the initial development of the BIENE modeling environment, it was deployed to domain teams who would each work independently on a particular application subdomain. Every domain team consisted of a lead modeler, one or two additional modelers, an architect, and several developers. Every domain team would co-opt domain and technology experts as they were needed, particularly a modeling coach. That way, the very diverse background, tasks, and levels of expertise of the teams could be addressed.
Every team would kick off a domain project with a three-day workshop in which a coach trained one to four modeling teams simultaneously. There, domain teams initiated their submodels and started working with it, documenting requirements and constructing a solution. When a domain project had reached a degree of completeness, extensive and distributed reviews were conducted to ensure that the needs of all BIENE clients were met. After satisfying any additional requirements the development would ensue, followed by integration testing. In the meantime, the modeler had started the next modeling assignment, which in practice meant that modeling teams were involved in up to four different domains at any given time, all in different stages of completion.
Apart from requirements gathering and software development, the models were also used for the engineering test cases, creating exploratory prototypes, project management and controlling, and informing the migration planning. In some cases, where substantial domain knowledge was truly missing, models would also be used to document the insights generated by reverse engineering old code. In a nutshell: the BIENE project was truly model-based, and models were first-class citizens.
For the core modeling team, it was essential that topic teams could work independently on their respective parts of the model and achieve completeness and correctness. For the construction crew, it was important that the model would be detailed and stable enough to effectively inform the software construction and testing.
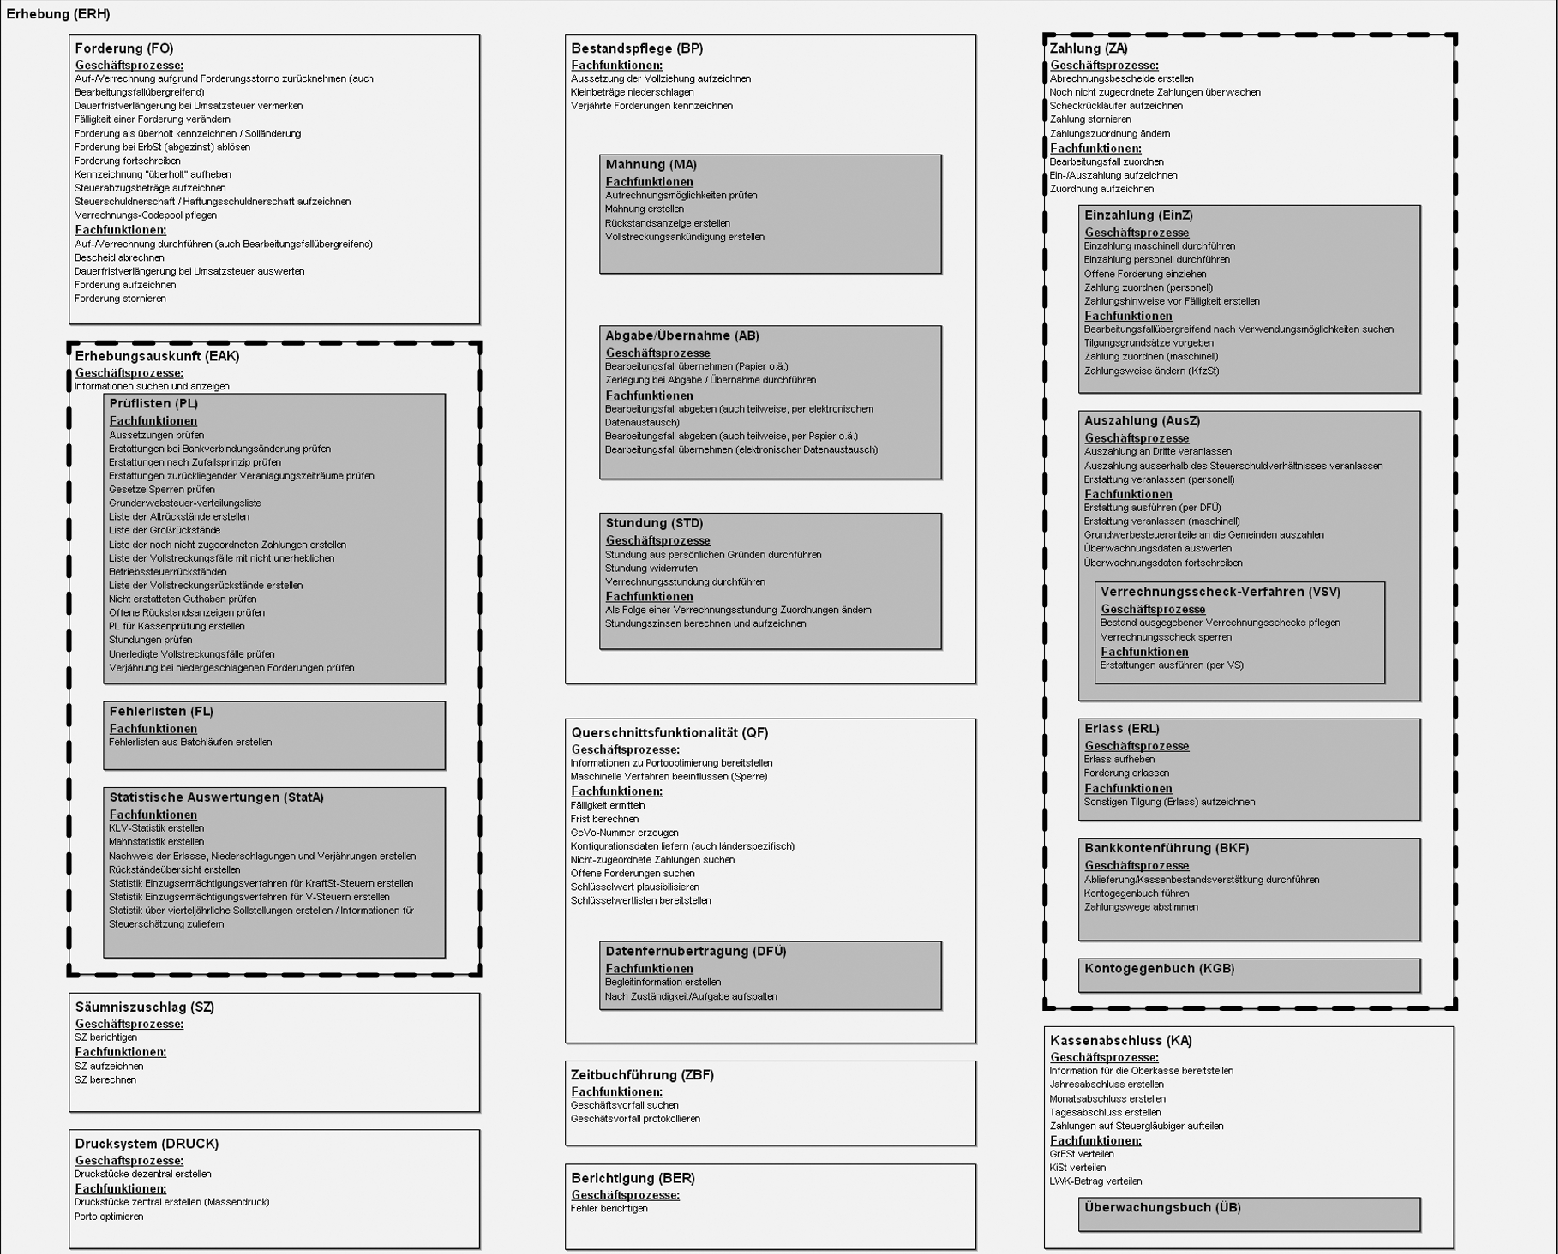
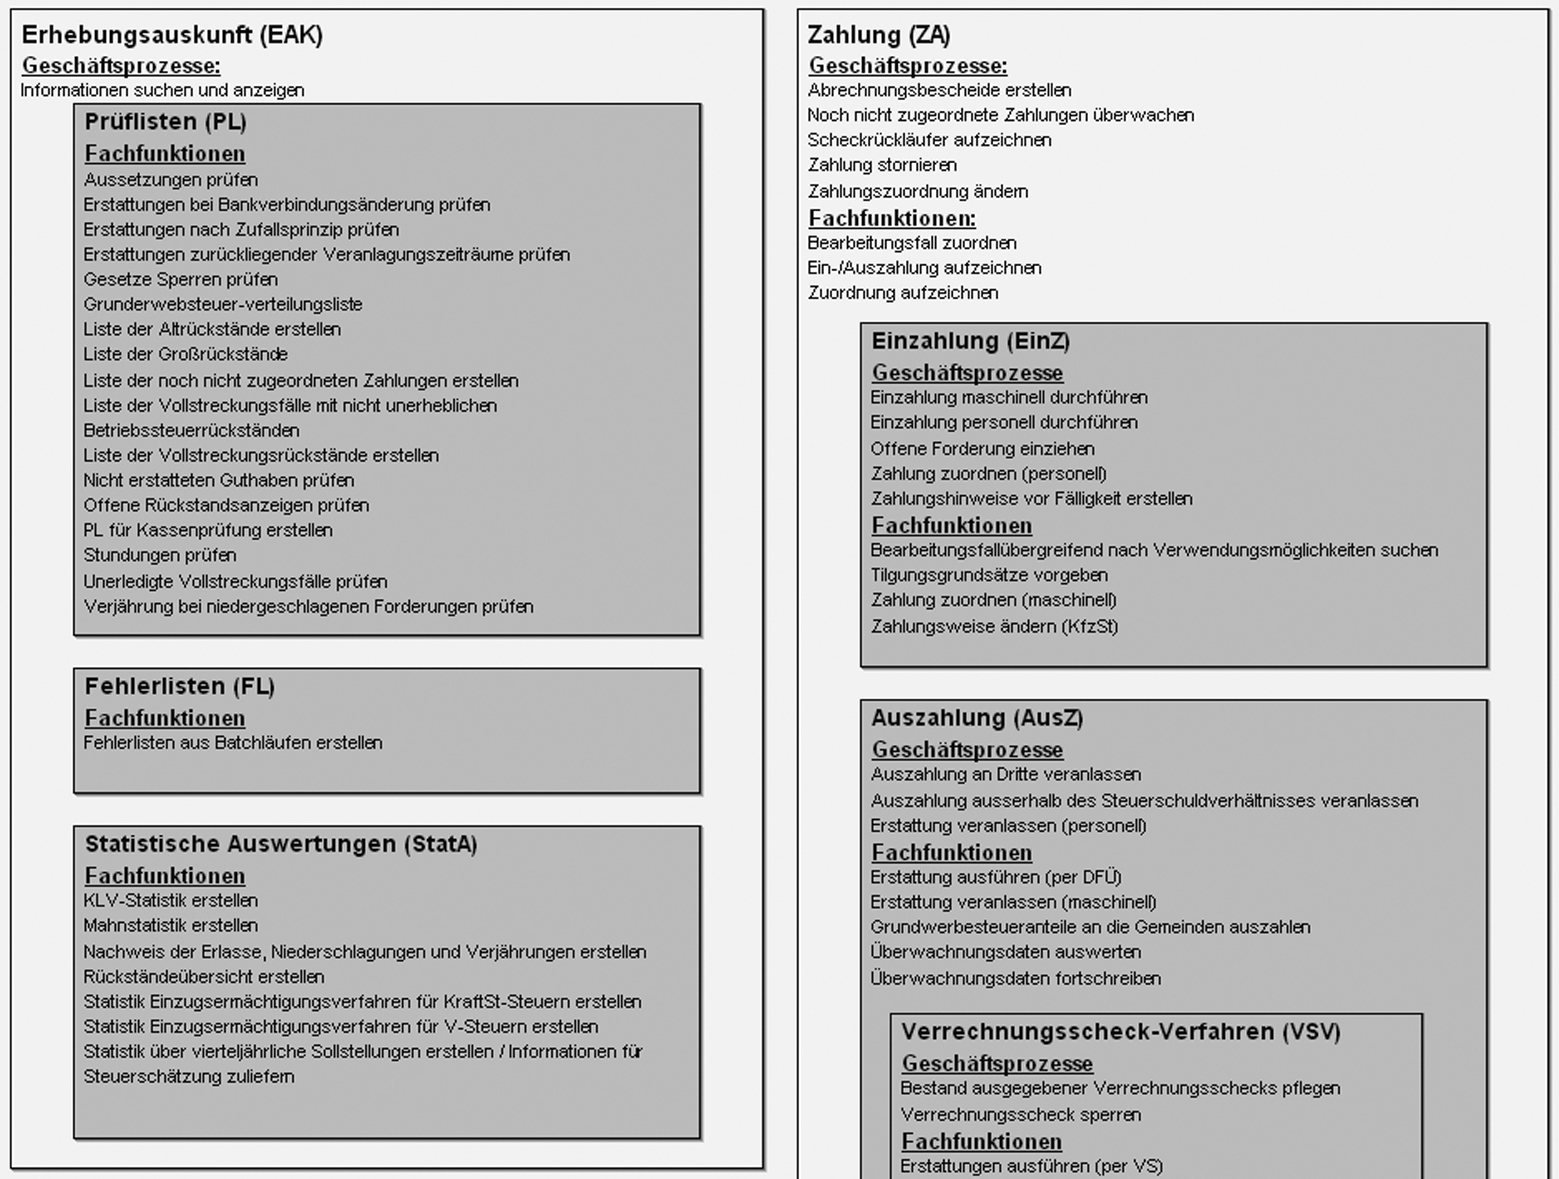
Fig. 7.11 shows the domain architecture of the tax levying system under construction in 2008, ca. four years into the project. Every line of text represents a business process or function, every rectangle represents an application domain or subsystem (the darker the shading the deeper the nesting). It defines the complete scope of the functionality associated with the tax levying domain. This domain architecture is the result of a comprehensive survey of required functionality. While complete in scope, it is not final in terms of the degree of detail: only the two parts with dashed heavy outline are complete in that sense, too; the other parts were not completed at the time. A typical domain project would comprise realizing around five of these processes and functions in one iteration.
7.6.3 Model structure
The outline of the ERH model is shown in Fig. 7.13. The top-level model outline reflects the project setup: the first four RootModelGroups implement a staged pipeline for developing independent subsystems, where submodels of unrelated application domains are created in group 0 and moved on to groups 1–3 as they mature. Therefore, RootModelGroups 0 through 3 have the same second-level structure; see Fig. 7.13B.
0 Workspace is the area for models under construction.
1 Under Review stores models under review for alignment to stakeholder needs.
2 Accepted contains models after review and during software construction.
3 Constructed acts as documentation of completed submodels.
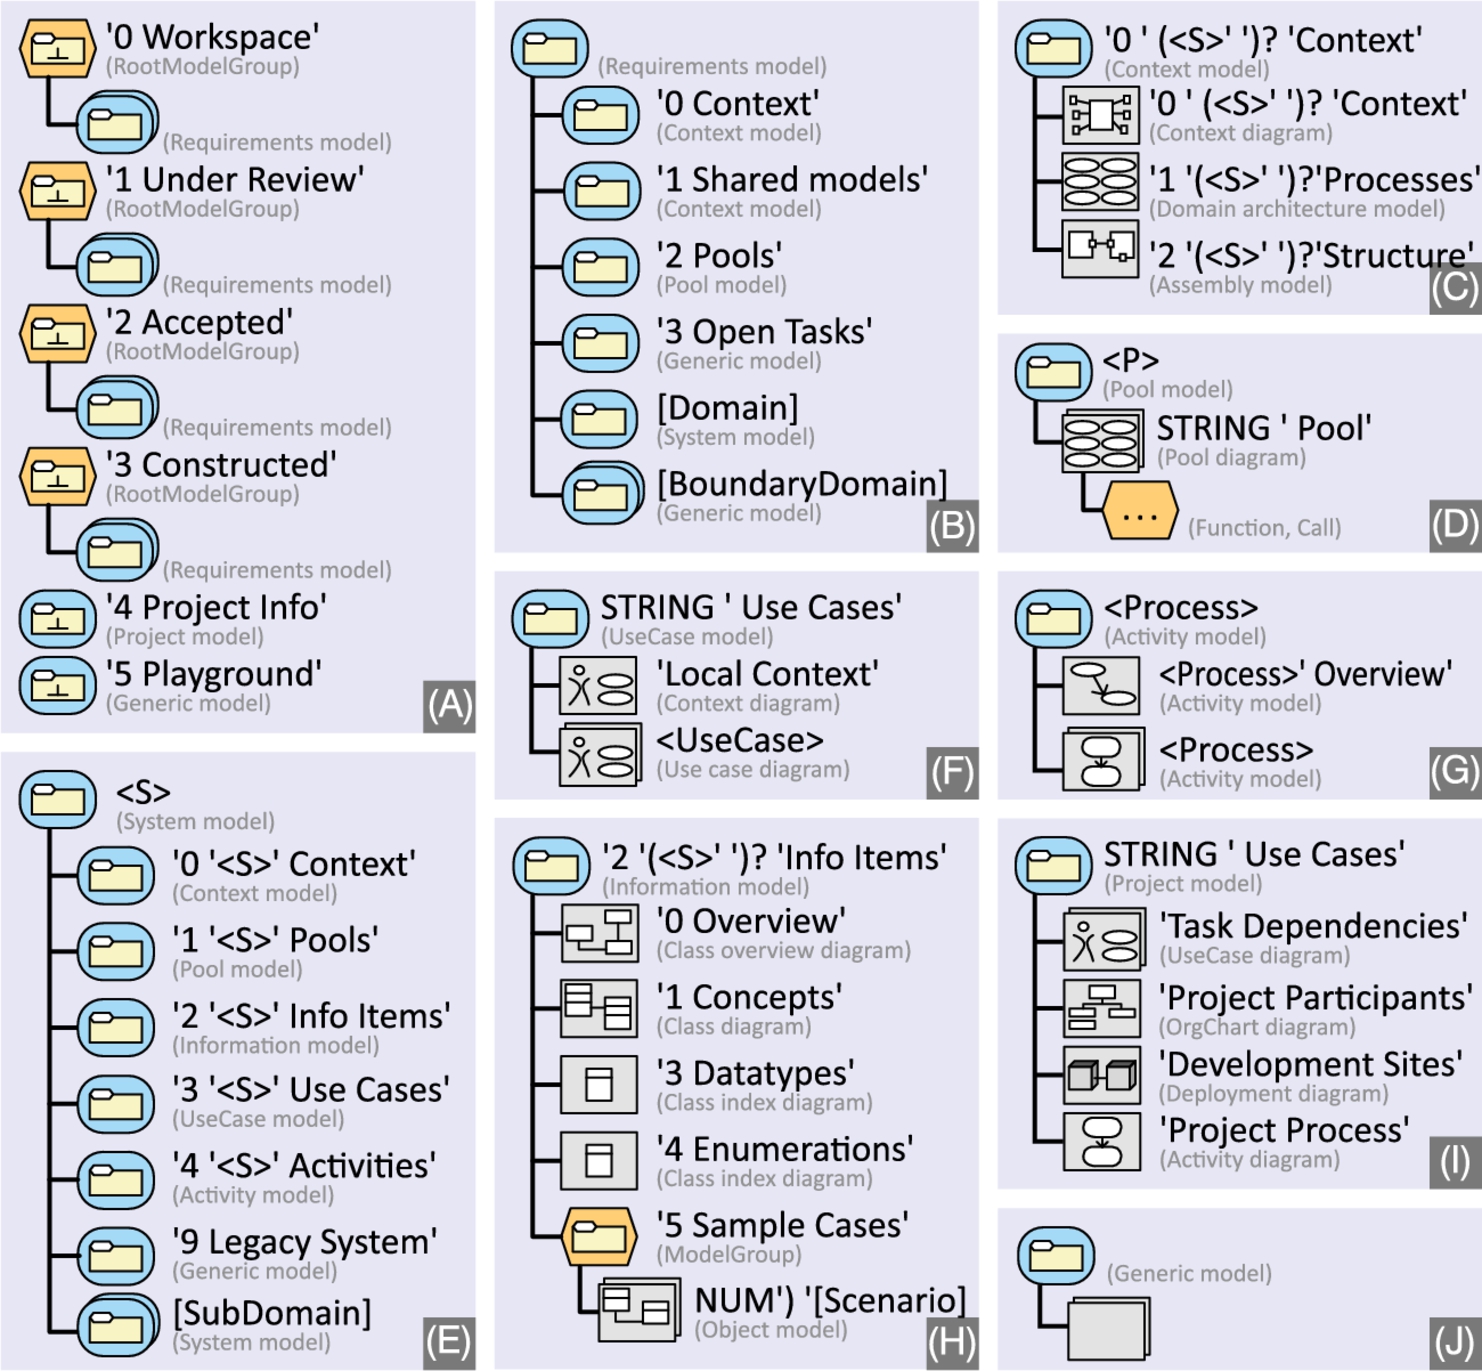
At the second level of the model outline the decisive influence of the project purpose comes into view: the single most important goal of BIENE was to achieve consensus across all stakeholders and ensure ownership and acceptance from all the authorities involved. Therefore it was vital that the project was run in several organizations, which led to a strict decoupling of subprojects for subdomains so that impediments in one of them would not delay others. In terms of the model outline, this was achieved by creating independent submodels for different domain teams and factoring out common concerns, such as the data structures that all domain projects shared. So, Fig. 7.13B defines ModelGroups for the interface of one domain project to others (0 Context), and for models common to all subdomains (1 Shared models and 2 Pools).
The third outline level of ERH uses the same structural metaphor as the second level of the LMS model, namely, that submodels correspond to chapters of a book. Thus, there are strong structural similarities: ERH Context model and System model (Fig. 7.13C and E) combined are similar to the LMS System model (Fig. 7.9, B), and the ERH Information model (Fig. 7.13H) is similar to the LMS Information model (Fig. 7.9C). They differ in details, though, e.g., the scenarios in ERH are less expressive than those in LMS.
RootModelGroups 4 and 5 support the involvement of a large number of people only loosely attached to the project. These provisions have been made necessary by the strongly distributed nature of the project.
4 Project Info informs participants about the project organization, process, and progress as well as dependencies between work units and project plans. It also holds tutorials and guidelines on the modeling language and methodology.
5 Playground allows for experiments by inexperienced users and temporary modeling sketches without harming the production models.
The model outline also reflects the tooling environment. The BIENE project selected ADONIS as the modeling tool at an early stage. Since ADONIS had been created with Business Process Modeling in mind, which means that the primary entity are diagrams, not model elements – model elements are only parts of diagrams. The concepts for model structuring (ModelGroups and RootModelGroups) are not part of the modeling language as such. Also, there is no multiview modeling as is commonly found in UML modeling tools, so all model elements are contained in exactly one diagram. Thus, it is redundant to specify model element types, and specifying a diagram type is completely sufficient. Many of the constraints and details we had to specify explicitly in the LMS model outline in Fig. 7.9 are implicit in the language definition in the ERH outline.
7.7 Discussion
Standardizing model structures makes it easier to locate knowledge in a model, not least because it makes it easier to identify the right place for adding and changing a model, which in turn reduces the deleterious effect of drift. Therefore, establishing a suitable and well-designed model outline is an important contribution to the success of any medium or large-scale modeling project, just like the quality of a directory structure contributes to any coding project. Being able to describe such directory structures concisely is necessary to plan and communicate them.
Employing the basic containment trees that all serious modeling languages and tools provide may seem a simplistic solution at first. It offers unmatched generality, flexibility, and simplicity, though. In our experience, describing a model as a book with chapters and sections is very useful as a guiding metaphor. Using the domain structure to inform the model structure allows domain experts to navigate a model naturally.
As the case studies presented above demonstrate, recursive model outlines scale up to large and very large models, and probably further. The case studies have also demonstrated that model outlines as we presented them scale in the sense that substantial numbers of modelers with little to no modeling background can easily use them, and that these outlines may last at least several years. In summary, we claim that the requirements stated in Section 7.3.1 are satisfied, and all four dimensions of large models are covered.
MONO is obviously expressive enough to describe most aspects of a model outline, leaving only a few advanced constraints for external description. It also covers both major modeling paradigms of today, UML-style multiview modeling, and BPM-style models-are-diagrams modeling, despite their inherent differences. However, looking at Figs. 7.9, 7.10 and 7.13 also shows that there are repercussions from various context parameters that show up in the model outlines.
- • Specific tool features show up, like the model overview diagrams in MagicDraw, or the pool models in Adonis. Taking advantage of such features and incorporating them in a model does, of course, limit the generality of the resulting model outline.
- • Also, observe that BPM-style models usually distinguish elements by name, where UML-style models identify elements by name and type, or internal identifier. So, some sets of name constraints may not be consistent in all environments (e.g., Fig. 7.9F).
- • The organizational structure and constraints of the BIENE project directly impact a great deal of the ERH outline. Or, conversely, the simple model outlines we propose can actually accommodate and support project goals.
- • The modeling paradigm shows up at first sight in the outlines: where the ERH outline shows mainly blue roundtangles (submodels) and some gray rectangles (diagrams), the LMS outline shows a lot more amber hexagons (model elements). In other words: the ERH outline is defined mostly in terms of diagrams and (recursive) submodels while the LMS is defined mainly by model elements and their relationships. This is a byproduct of using diagrams as containers and embedding a great amount of the structural constraints in their definitions. It is also a pattern that is typical when contrasting BPM-style model outlines with UML-style model outlines.
Irrespective of the modeling paradigm, naming conventions are very important when facing long lifetime or large audiences. Failing to put them into place at the very beginning turns into a burden later.
7.8 Conclusions
7.8.1 Summary
Modeling projects benefit from structuring their models just like all projects benefit from structuring their artifacts. As models grow, the need becomes more and more pressing. Also, model structure templates are useful for guiding junior modelers and domain experts. Finally, modeling is inherently difficult. Providing a standardized model outline takes one burden away from modelers and lets them focus on the task at hand: collecting and creating new knowledge in order to clarify murky questions and resolve controversy.
Despite these benefits, experience and advice on how to best structure models is not publicly available. As a first step towards true best practices, we report on two large models and explain their outline structures. We describe these outlines using a dedicated precise visual notation that we define and introduce for this occasion. The notation is a necessary prerequisite to comparing, communicating, and consolidating model outline knowledge, which we hope to encourage by this chapter.
7.8.2 Related work
In the Business Process Modeling arena, structuring large models has been an issue for a long time. For instance, ARIS – probably the most widely used modeling language in the IT industry – comes with several notations supporting high-level views of process models. Practical guidebooks complement them by practical guidance (see, e.g., “segmenting models” in [9, Section 11.3.3]).
Similarly, UML provides notations for hierarchical decompositions of large diagrams such as Activity Overview Diagrams. Other notations like StateChart Diagrams had hierarchical decomposition built into them from the start. Some tools also add specific features for providing more structure in large models. For instance, MagicDraw comes with “Overview Diagrams” where modelers can create diagrams whose graphemes represent other diagrams. A different path is pursued by VisualParadigm, which offers diagram layers [27,28] to tackle complexity within one diagram.
In the academic research literature, there is very little information available on means of structuring models, i.e., concepts, formalisms, and tools. Notable exceptions are [17] and [36] for formal method-inspired approaches and [7] for a more hands-on engineering approach.
Another angle on model structuring comes from recent work model slicing [20,35]. A model slice is a submodel that is closed under certain metaassociations and contains a seed model element (or set of model elements), the so-called slicing criterion.
However, we perceive a dearth of scientific work on how models ought to be structured, that is, studies, best practices, or guidelines, or even just examples or experience reports, let alone standards or systematic studies on how to best structure models. Apart from our own previous work [31], we are not aware of any such research. Although we have anecdotal reports of some relevant internal material in organizations that do large-scale modeling, no such material seems to be published, e.g., as an internal report or an industry white paper.
7.8.3 Contributions
This paper has four major contributions. First, we elaborate what “size” means for models, propose a conceptual framework and some metrics to measure the size of models, and also provide interpretations for the figures yielded by these metrics. Second, we propose MONO as a way to visually define the structure of a model, either for documenting the outline of an existing model, or for designing and planning new model structures. Third, we present two case studies of large and very large models and show how MONO can be applied to describe their model outlines. Allowing for recursive definitions, MONO offers a substantial amount of scalability. Fourth, between the introductory examples and the case studies, we provide many small and large examples of how models can actually be structured. These examples can not yet be considered best practices, as they lack independent confirmation. Yet, they are a starting point that people can refer to and elaborate on. We hope that this chapter will help to raise the visibility of this issue and spawn new ideas for model structures.
7.8.4 Limitations and future work
While we are confident that the notation and model outlines presented here will hold up under scrutiny, they obviously need independent validation before they can be considered reliable. Also, we have only presented case studies for specific coordinates in the space of models and modeling languages. It is currently unclear, just how far the outlines and structuring means we have proposed will carry. In particular, scaling down there will be a point at which the effort of defining a dedicated model outline will exceed the benefit derived from it. Where this point is, exactly, is an open question. Also, we have not validated MONO on Matlab/Simulink models, which is a highly relevant modeling environment in industrial practice.
We see three major areas for future work. First, there is a need to formalize MONO such that model outline checkers can be created. Among other things, it would check the consistency of a given outline and whether a given model conforms to a predefined model outline. Second, putting MONO into practice requires tool support, both for editing the visual notation and for checking it against model instances. Third, it would be desirable to extend the notion of a submodel and the conformance checking in such a way as to define a proper notion of modularity of models. This would be a necessary prerequisite for sharing models based on an interface while hiding details.