
5
All About Anypoint Platform
The terms Anypoint Studio and Anypoint Platform may sound similar and thus confusing. However, they are completely different and serve different purposes. Anypoint Studio is an integrated development environment (IDE), which we use to build, test, and run Mule applications. We thoroughly explored it in Chapter 3, Exploring Anypoint Studio, and Chapter 4, Introduction to Core Components. Anypoint Platform, on the other hand, is a user interface (UI)-based control plane, which manages a variety of components such as Design Center, Exchange, Runtime Manager, and so on. We will be learning all of this in depth in this chapter.
After reading this chapter, you’ll know more about the following topics:
- Different components in Anypoint Platform
- What an API specification, an API Fragment, and AsyncAPI are in API Designer
- How to develop a Mule application in Flow Designer
- How to publish assets from an Exchange portal to a public portal
- How to deploy a Mule application from Runtime Manager
- How to create Runtime Manager alerts
- API Manager, Anypoint Monitoring, and Visualizer
- Access Management (organization and business groups)
Technical requirements
We will be using the Anypoint Platform that we already configured in Chapter 2, Designing Your API.
Here is the login link: https://anypoint.mulesoft.com/login/.
The .jar file used for deployment later in this chapter in the Deploying to CloudHub section is available in the following GitHub path in the Chapter3 folder: https://github.com/PacktPublishing/MuleSoft-for-Salesforce-Developers.
Introducing Anypoint Platform
Anypoint Platform is a single platform that facilitates designing an API, storing assets, deploying any application to the cloud/on-premises, getting real-time visibility, and troubleshooting issues. It helps organizations to connect applications, data, and devices. It consists of the following components:
- Design Center
- Exchange
- Runtime Manager
- API Manager
- Anypoint Monitoring
- Anypoint Visualizer
- Access Management (organization and business groups)
- Data Group
- Data Gateway
- MQ
- Secrets Manager
In the upcoming sections, we will explore some of these components in detail.
Getting started with Design Center
Design Center is a tool that is used to design and build APIs in Anypoint Platform. Here, we design and test the API specification first, before the actual development. This is called the API design-first approach. We can share the API specification with other developers to consume the API even before we start the development. The two main components of Design Center are API Designer and Flow Designer.
API Designer
API Designer is a platform for designing, documenting, and testing APIs in RESTful API Modeling Language (RAML) or OpenAPI Specification (OAS) with code-based or visually guided experience. It also generates interactive API documentation in the API console, which provides information on APIs and their methods. Before the actual implementation, an API developer can also test their APIs in the API console itself.
Note
RAML is a YAML-based language for describing RESTful APIs. OAS, an open API specification formerly known as Swagger specification, is a standard for defining RESTful interfaces.
In the API Designer, we can design an API specification, fragment, and AsyncAPI. Let us learn more about them.
API specification
An API specification is API documentation that helps developers/consumers understand the API. This specification has API requests, response structures, methods, endpoints, examples, and other required details to consume the API. This is used in synchronous/real-time web service integration.
We have learned how to design the API specification in Chapter 2, Designing Your API. So, let’s move on to an API fragment and AsyncAPI.
API fragment
An API fragment is a reusable component of RAML. It is not a complete RAML but a portion of the RAML specification. It can be created separately as an API fragment in API Designer and can be reused in multiple API specifications. We explored this in detail in Chapter 2, Designing Your API.
AsyncAPI
An AsyncAPI specification is used for creating the specification for a messaging-based interface. This specification is protocol-agnostic. That means it can support many protocols such as amqp, amqps, http, https, ibmmq, jms, kafka, kafka-secure, anypointmq, mqtt, secure-mqtt, solace, stomp, stomps, ws, wss, and mercure. In a nutshell, AsyncAPI is protocol-independent. We use AsyncAPI in any event-driven architecture, which deals with asynchronous/near-real-time integrations.
Let’s follow these steps to create an AsyncAPI specification:
- Log in to Anypoint Platform and click Design Center. Here, click Create new, and select New AsyncAPI.
- Provide the project name. Project language can either be YAML or JSON. In this example, let’s set the language as YAML, as shown in Figure 5.1, and then click on Create AsyncAPI.

Figure 5.1 – New AsyncAPI
Once created, it shows the following code block to describe the AsyncAPI version and other details:
asyncapi: '2.0.0'
info:
title: MusicAsyncAPI
version: '1.0.0'
channels: {}
In this example, to publish the song data to a queue/channel by an external application/organization, they need the following: a queue name, a payload structure, and server details. These details will be available in the AsyncAPI specification provided by MuleSoft developers. Using this specification, external applications or organizations can publish (send) or subscribe (receive) data from the required queue/channel. Let’s consider songs-request and songs-response as channel names (see Figure 5.2).
In the PUBLISH method section, we can define the fields that are required for publishing the message to the songs-request channel. Similarly, in the SUBSCRIBE method section, we can define the fields that we expect while subscribing to the message from the songs-response channel. If we need to reuse any code, then use the component object in AsyncAPI and refer to it using $ref.
The email and name are in the contact information section. Server details for different environments are in the servers section.

Figure 5.2 – AsyncAPI specification
Figure 5.2 shows the structure of an AsyncAPI specification, which includes the info, servers, and channels sections.
- After successfully creating the AsyncAPI specification, click on Publish and select the Publish to Exchange option. On the dialog box that appears, provide the asset version and click Publish to Exchange to publish the AsyncAPI specification to Exchange (see Figure 5.3). Versioning is important because when the API version changes, it gives flexibility to clients on whether to update or continue with an older version of the API.
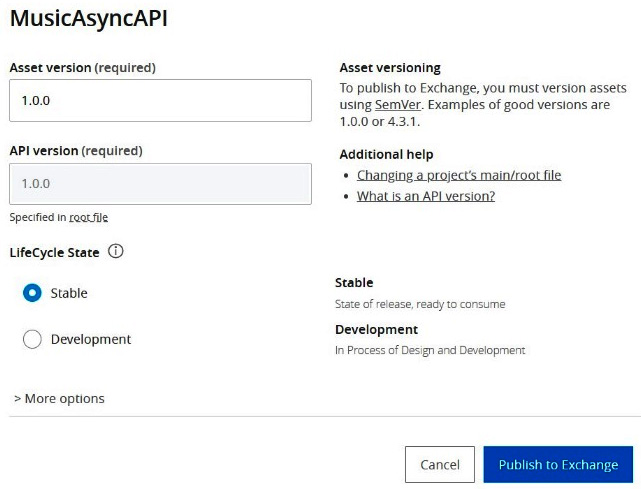
Figure 5.3 – Publishing the AsyncAPI
Once published to Exchange, the AsyncAPI specification is available for users in the same organization. If we need to make it available for external partners/consumers, then we need to publish it to the public portal from Exchange.
With this, we have understood how to design the API using an API specification, an API fragment, and an AsyncAPI specification from Design Center. After we design the API, we can share it with other developers/external partners/consumers to start their development. This way, they can consume the API before the actual development of the API.
Now, let’s explore more about Flow Designer in Design Center.
Flow Designer
Anypoint Flow Designer is a low-code drag and drop tool. It allows anyone, even people with minimal programming knowledge, to build Mule integrations, such as receiving customer data from Salesforce and sending it to other backend systems (database or legacy applications).
In the following example, let’s create a Mule application using HTTP Listener, Logger, and Transform Message. After creating it, let’s deploy the application into CloudHub:
- In the Design Center, click Create new, and select New Mule App.
- Set the Mule app name as SongsMuleApp, as shown in Figure 5.4, and click Create App.

Figure 5.4 – Creating a new Mule app
- Next, click on Go straight to canvas to open the canvas.
- Click trigger and select HTTP Listener. Set the path value as /songs and click the cross button (see Figure 5.5).

Figure 5.5 – HTTP Listener path configuration
- Click the add (+) symbol in the canvas beside the HTTP listener to add a new card (see Figure 5.6).
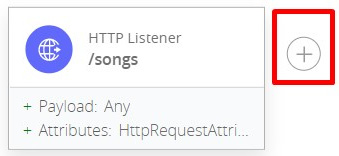
Figure 5.6 – Adding cards
- Add the Transform component and select the configuration. Then, click on the Scripts tab and fill in song’s JSON data, as shown in Figure 5.7. Next, click the cross button to close the window. The Mule application gets auto-saved.

Figure 5.7 – Adding a transform message
- Rename New Flow getSongsFlow (see Figure 5.8).

Figure 5.8 – Renaming the flow
With this, we have successfully created our Mule application, SongsMuleApp. Now, let’s try to deploy it in CloudHub to run our application.
Deploying to CloudHub
There are a few ways to deploy an application in Mule, one of which is deploying to CloudHub. CloudHub is a MuleSoft Platform as a Service (PaaS) cloud environment, which is fully managed by MuleSoft. It is highly available, with 99.99% uptime.
Let’s begin by deploying our application to CloudHub:
- Click Deploy application (see Figure 5.9). In the dialog box, select the target environment as Sandbox and click Deploy.

Figure 5.9 – Deploying an application in CloudHub
- It will deploy the application and the following dialog box appears.

Figure 5.10 – Deploying an application
Once the application is deployed successfully into CloudHub, the following dialog box appears at the bottom right of the page:

Figure 5.11 – The Deployment success dialog
- Next, go to Runtime Manager. It shows the status of songsmuleapp-wtjz as Started (see Figure 5.12).

Figure 5.12 – Runtime Manager – the application list

Figure 5.13 – Runtime Manager – Dashboard
- Now, it is time to test the application we just created using Postman to check whether it is working. While typing the URL in Postman, add the /songs path, which we configured earlier in the HTTP Listener configuration, and select the GET method. Then, click the Send button.
- The application deployed in CloudHub will then receive the request and send the response, with the status as 200 OK, which means our application is working. The response received in Postman is shown in Figure 5.14.

Figure 5.14 – The send request from Postman
Similarly, we can call this web service URL from any system (mobile, web, and legacy applications) to get the response.
In this section, you have understood how to create a simple Mule application and deploy it to CloudHub. Try creating a new Mule application with different components in Flow Designer for different use cases/requirements.
In this section, we have explored Design Center in Anypoint Platform. We learned more about API specifications, API fragments, and AsyncAPI in API Designer. We also created a Mule application in Flow Designer and deployed the same in CloudHub.
Next, let’s learn more about the Exchange component.
Introducing Exchange
Exchange is an online catalog that stores all the reusable assets, such as APIs, connectors, templates, examples, policies, API groups, DataWeave libraries, AsyncAPIs, HTTP APIs, API specification and fragments, and custom assets. This is mainly used for exchanging/sharing assets with others in Anypoint Platform within an organization.
From Exchange, we can discover and see the assets available in the organization. We can access these Exchange assets from different components (both Anypoint Platform and Anypoint Studio) for our reuse. For example, in Anypoint Studio, we can access the connectors, templates, and examples by using the Search in Exchange option in the Mule palette. Similarly, in API Manager of Anypoint Platform, we can access the API assets by using the Manage API from Exchange option.
Assets are grouped under Provided by MuleSoft and the respective organization name in the Exchange. Provided by MuleSoft has all the assets shared by MuleSoft and its partners and certified by MuleSoft.
Figure 5.15 shows the assets under Provided by MuleSoft. These assets are publicly available for all MuleSoft customers.

Figure 5.15 – Exchange assets provided by MuleSoft
Assets published/shared within the organization appear in the respective organization section. These assets are not accessible outside the organization. In this example, Packt Publication is an organization name.
This organization has a musicbox-sys-api REST API asset in the Exchange (which we designed and published earlier in Chapter 2, Designing Your API), and this is discoverable for other developers in the same organization, as shown in Figure 5.16.

Figure 5.16 – Exchange assets from the current organization
On clicking the musicbox-sys-api asset, the asset page opens, as shown in Figure 5.17.
Let’s try to download, view/edit, and share the API specification.
We can download the assets either as RAML, as OAS, as a Mule 3 connector, or as a Mule 4 connector by clicking the Download option.
The View code option allows you to view/edit the API specification from the Design Center.

Figure 5.17 – Exchange – viewing the asset
We can share the assets with other developers within the organization and also publish the asset to the public portal by selecting the Share and then the Public option on the asset page. Check the checkbox for the version and click Save, as shown in Figure 5.18.

Figure 5.18 – Exchange – sharing assets to the public portal
Now, let’s explore more about the public portal in Exchange.
The public portal
The public portal is a web-based user interface (UI) where developers can view the company’s API, and it is mainly used for enabling developers/consumers to access the assets published by other organizations. The Exchange public portal is also called the developer portal. We can customize the portal appearance by adding a logo, banner image, text, and favicon for the browser tab.
Open the public portal by selecting the Public portal link in the Exchange section, as shown in Figure 5.19.

Figure 5.19 – Public portal
All assets published to the public portal are available, as displayed in Figure 5.20. Anyone with an internet connection can view these APIs. Open the public portal in Private/Incognito mode from the browser. If we open the public portal in a normal browser window, it might use the same login credentials that you logged in with already. Just to show that the public portal will work without any credentials, I have opened it in Private/Incognito mode. It doesn’t require any credentials to see a list of APIs published to the public portal.

Figure 5.20 – Public portal
Previously, we tried to publish the API specification to the Exchange (In Chapter 2, Designing Your API). From the Exchange, we can publish the assets using the Publish new asset option. Try to publish various asset types (REST, SOAP, HTTP, and AsyncAPI) from Exchange using this option.
In this section, we learned about the assets provided by MuleSoft and also assets shared by our organization in Exchange. Then, we learned how to download, view/edit, and share/publish the asset to the public portal.
Let’s move on to learning more about Runtime Manager.
Exploring Runtime Manager
Anypoint Runtime Manager is the single place to view and manage the Mule applications that are running in Mule Runtime. Mule Runtime is an integration engine that runs Mule applications. We can see and manage the application deployed in on-premises mode, CloudHub (MuleSoft-managed), and the public cloud from Runtime Manager. Earlier, we developed an application from Flow Designer and deployed it to CloudHub. We can also deploy a Mule application using a .jar file from Runtime Manager. A .jar file is a compressed version of an application.
Let’s get familiar with some terms related to Runtime Manager before we deploy the Mule application into CloudHub using the .jar file.
- Workers: A worker is nothing but a small, dedicated server that can run a Mule application on CloudHub.
- Worker size: Different types of workers are available based on vCore size. Worker sizes come with different compute, memory, and storage capacities. A core can be a physical or virtual core / vCore (a virtual core denotes virtual CPU and allows the users to choose the physical properties (number of cores, memory and storage size) of hardware). In computers, we use a physical core, but in CloudHub, it’s preferable to use vCore. vCore is partitioned from a physical core. For example, 1 physical core is partitioned up to 10 virtual small cores with 10 * 0.1 vCores. 0.1 vCore is the smallest size in CloudHub.
- Increasing the number of workers provides horizontal scaling for the application, whereas increasing the worker size provides vertical scaling for the application.
Horizontal and Vertical Scaling
Horizontal scaling means adding additional machines to accommodate new infrastructure demands. For example, if there is Black Friday/Christmas sale, we expect more traffic to our e-commerce server; in that case, we can add an additional server to share the load of incoming traffic.
Vertical scaling means increasing additional resources to the same machine to get more power (CPU, memory, and disk). For example, if we need to process more records from a file/database, then we can add an additional CPU or memory to handle the load.
While deploying the Mule application, we can choose the worker size from the dropdown (see Figure 5.21). Let’s look at the available worker size in the following table.
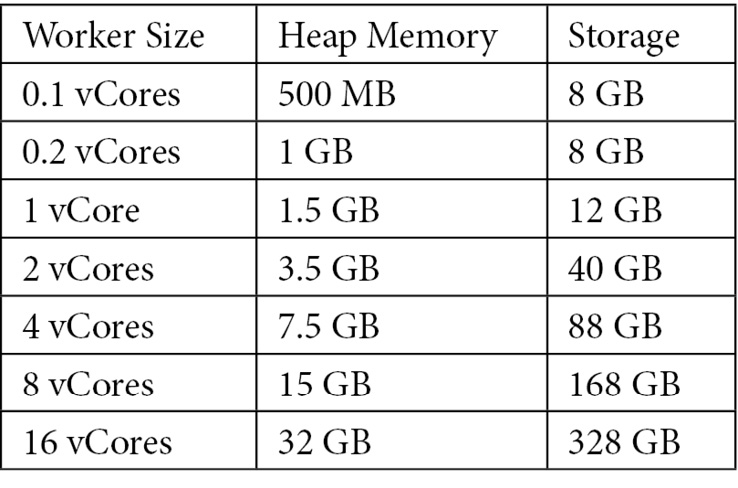
Table 5.1 – Worker sizes
Heap memory is memory allocated to our Mule application. When the application runs, it uses this memory to process the requests received.
For example, if we choose 0.2 VCPU as a worker size, then the heap memory and storage allocated will be 1 GB and 8 GB respectively.
We are now familiar with the concepts of workers and worker size in Runtime Manager. Next, let’s see how to deploy a Mule application into CloudHub using a .jar file.
Deploying a Mule application into CloudHub
Now that we have a basic understanding of common terms, let’s deploy the Mule application using Runtime Manager. In this example, we are going to deploy the Hello World Mule application that we developed in Chapter 3, Exploring Anypoint Studio. In that chapter, we exported the application as a .jar file. The application has HTTP Listener with a /hello endpoint, Logger to log the Welcome to Hello world application message, and Transform Message to output { message: "Hello World" }. We will now use the same .jar file to deploy the application in CloudHub.
Follow these steps to deploy the application:
- Click Runtime Manager under Management Center.
- Choose Sandbox as the environment.
- Click the Deploy application button to deploy the application.
- Provide a unique application name, select the deployment target, and choose the .jar file. Now, select the worker size and the workers, and then click Deploy Application (see Figure 5.21).

Figure 5.21 – Deploying an application in Runtime Manager
- A progress bar will appear on the same page while deploying in CloudHub. In this step, it will procure a virtual machine (VM)/system, install a lightweight Mule runtime, and also deploy the application.
- Now, we can see the following log page that shows the latest status of deployment (see Figure 5.22).

Figure 5.22 – Deployment status – logs
- Once the Mule application is successfully deployed, a green mark appears on the log page (see Figure 5.23).

Figure 5.23 – Runtime Manager – deploy application status
- Click on Applications on the left-side navigation to view the list of applications. You can see that the application is in a Started state (see Figure 5.24).
- Click the application named demo-helloworldapplication.

Figure 5.24 – Runtime Manager – deployed application status
- This shows the application URL in a domain column, the number of Mule messages received, CPU usage, and Memory usage in Dashboard (see Figure 5.25).

Figure 5.25 – Runtime Manager – Dashboard
- Copy the application URL from Dashboard, add a path (/hello), which we have specified in HTTP Listener (refer to Figure 3.14 – Listener Properties Configuration in Chapter 3, Exploring Anypoint Studio), and send the request from the Postman application. Once we click Send, the application that is running in CloudHub receives the request. It then gets processed through various steps (Logger, Transform Message, and so on) before getting the response. Send a few more requests from the Postman application to see the number of Mule messages in the Dashboard (see Figure 5.26).

Figure 5.26 – A send request from Postman
As shown in the preceding figure, we can see the status is 200 OK, which means that the application has received and processed the request successfully.
With this, we have successfully deployed the application in CloudHub using Runtime Manager. Now, let’s learn how to manage a Mule application.
Managing a Mule application
After deploying the Mule application, typically the operation/support teams need to monitor/manage the application by checking the logs, the number of Mule messages received, CPU usage, and memory usage. This is done to check whether the Mule application is working or not. This kind of managing the application is facilitated by a list of options available such as Dashboard, Insight, Logs, Object Stores, Queues, Schedulers, and Settings in Runtime Manager.
By clicking the application name on Runtime Manager, we can see these options on the left-side navigation. Let’s learn about those options one by one.
Dashboard
Dashboard displays the full details of the application (see Figure 5.25). It shows the number of Mule messages received, CPU usage, and Memory usage for that worker/application. We can also view the report for different time ranges, such as the last hour, the last 24 hours, and the last week.
Logs
In the Logs section, we can see logs related to the application. If an application has a Logger component, whenever it is called inside the Mule application, it logs a message.

Figure 5.27 – Runtime Manager – Logs
In the demo-helloworldmuleapplication, we logged a Welcome to Hello world application message using Logger. When this application receives the request, it logs the message from Logger (see Figure 5.27).
Insights
To learn the Status, Processing Time, and Date information for each run or transaction, we can check out the Insights tab.

Figure 5.28 – Runtime Manager – Insights
We have called a hello world Mule application three times; hence, we can see three transactions in Figure 5.28 with their status, processing time, and date. This helps with efficient monitoring.
To enable Insight, in the Settings tab, click Insight and enable the metadata.
Object Store
The Object Store connector is a Mule component that allows you to store a simple key-value pair. A key-value pair is a combination of two simple values where one is the key and the other is a value. The key is the unique identifier of the values stored.
If the application uses the Object Store connector, we can view the keys from the Object Store option. Let’s look at Figure 5.29 for a better understanding:
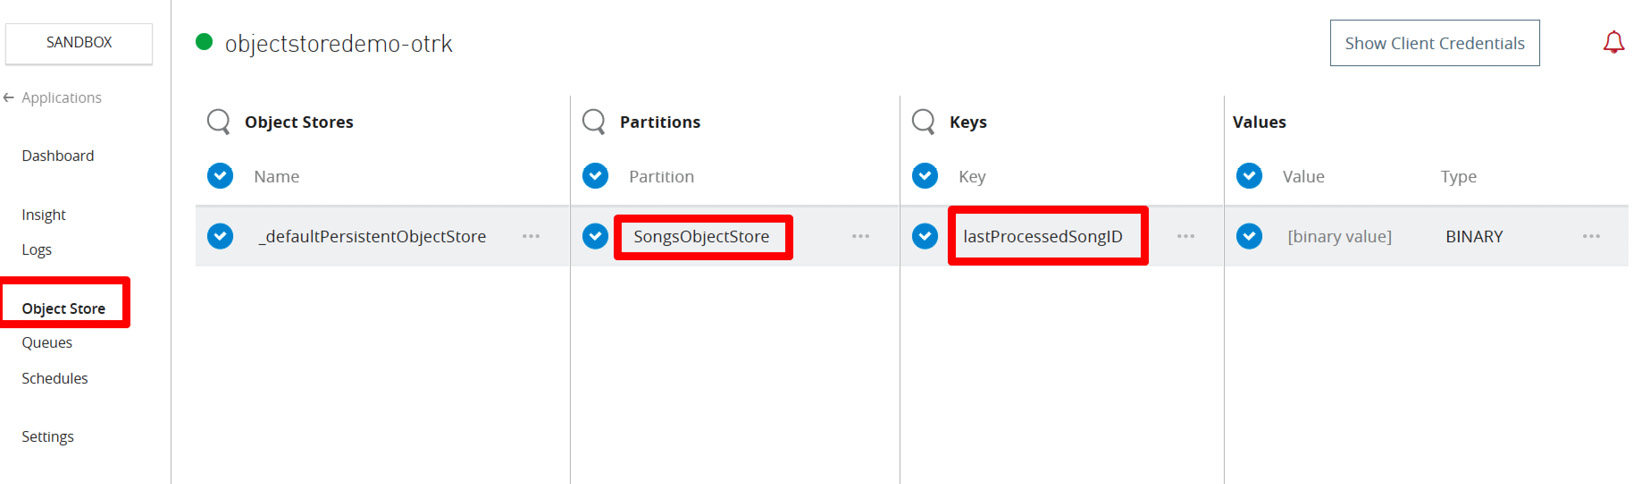
Figure 5.29 – Runtime Manager – Object Store
Here, lastProcessedSongID is a key name. For example, a Mule application processes songs from one system to another every few minutes. When it runs, it picks the records and stores lastProcessedSongID in the Object Store. Each time it runs, it checks for lastProcessedSongID from the Object Store so that it can process the succeeding records.
We will learn more about the Object Store in Chapter 8, Building Your Mule Application.
Queues
The Queues tab in Runtime Manager shows the queues within the flows of your deployed applications. For example, if we are using the VM Connector with a persistent queue enabled, then it appears in this Queues tab. We can see the number of messages in the queue and the number of messages that have been processed in the last 24 hours. We can also clear the messages if they are not required.
Schedules
The scheduler is a component that helps schedule the jobs. For example, if we need to run a specific program at 8 PM every day, then we can configure it based on a specific time. This is useful if we need to run a Mule application at a specific time.
The Schedules tab in Runtime Manager shows the scheduler details (the name, the time of the last run, and the frequency of the schedule) of the application. We can use the Enable, Disable, and Run now options as per requirements (see Figure 5.30). We will learn more about schedulers in Chapter 8, Building Your Mule Application.

Figure 5.30 – Runtime Manager – Schedules
In Figure 5.30, the scheduler is configured to run every 10 minutes, and we can see the previous run details in the Last Run column.
If the scheduler component is not applicable for a particular application, then it will not be displayed.
Settings
From the Settings page (see Figure 5.31), we can perform the following functions:
- For any application changes, we can update the .jar file to redeploy the application
- Change the Runtime version of the application
- Add/modify the application properties
- Enable the Insight
- Increase/decrease the logging level
- Allocate the static IP for the application

Figure 5.31 – Runtime Manager – Settings
In Figure 5.31, the Runtime version is 4.4.0. If we need to change the version of the Mule runtime, then we can change it to the latest or previous version. Similarly, worker size, the number of workers, properties, and the logging level can be changed.
With this, we have learned about the various options such as Dashboard, Logs, Insights, Object Store, Queues, Schedules, and Settings in the Mule application that are useful to manage the application. Now, let’s learn how to configure the alerts in Runtime Manager.
Runtime Manager alerts
Runtime Manager alerts enable you to set up an email alert whenever any event (condition) occurs in a specific application or all applications.
We can setup alerts for CloudHub as well as local servers in Runtime Manager. Now let’s see various alert conditions for CloudHub:
- CPU usage – CloudHub
- Custom application alert
- Exceeds event traffic threshold
- Memory usage – CloudHub
- Deployment failed
- Deployment success
- Secure data gateway connected
- Secure data gateway disconnected
- Worker not responding
For applications running in local servers (on-premises), we can configure different types of alert conditions. Now let’s look at those:
- Number of errors
- Number of Mule messages
- Response time
- Application undeployed
- Deployment failure
- Deployment success
Here’s how we can create an alert.
Creating an alert
Let’s create a new alert for the Deployment Success condition:
- Click on Create your first alert if you are creating an alert for the first time. Otherwise, click on Create Alert.
- Type the name of the alert and the application type that needs to be monitored, and then specify the condition. Then, provide the recipient’s email ID in the Recipients field. This is the email address that the alert will be sent to. Finally, click on Submit.

Figure 5.32 – Creating an alert
With this, the alert has been created. Going forward, if any application is deployed successfully, then an email alert will be sent to the email address you specified (see Figure 5.33).

Figure 5.33 – An email alert in the inbox
Alerts can be created for different condition types. Try creating alerts for those different conditions. For example, create a deployment failure alert to notify you if there is any failure in the deployment. Similarly, create an alert if the memory/CPU threshold exceeds. Apart from these, try to create alerts with different condition types.
With this, we have learned to create an alert in Runtime Manager. Next, let’s move on to explore Anypoint VPC.
Anypoint VPC – virtual private cloud
VPC is a generic term. Anypoint VPC is the VPC hosted inside CloudHub. Let’s try to understand VPC so that we can have a clear idea about Anypoint VPC.
A Virtual Private Cloud (VPC) is a set of servers present in a protected environment. Communication with these servers can only be established through a VPC firewall. In the absence of Anypoint VPC, Mule applications run in a shared location. This means that the Mule applications in CloudHub belonging to all the customers run in the same location/space. This may raise security concerns among the customers.
Large organizations want their applications to run in a private and protected environment. This can be achieved by creating a VPC in Runtime Manager. After creating a VPC, we can connect to an on-premises environment using a virtual private network (VPN). A VPN ensures secure connectivity to your on-premises network from your Anypoint VPC.
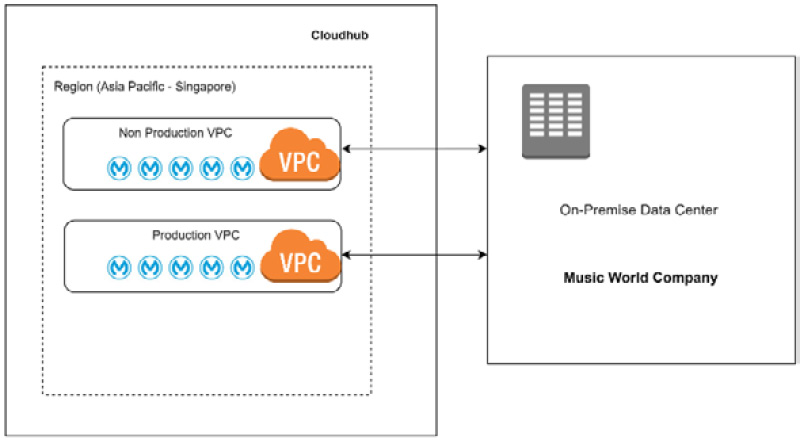
Figure 5.34 – Anypoint VPC
In Figure 5.34, the Music World Company has a backend system in an on-premises data center and a MuleSoft application in CloudHub. For security reasons, they run those Mule applications inside Anypoint VPC in CloudHub. We can group all MuleSoft applications into either one or more VPCs. Here, the customer has all the non-production MuleSoft applications in one non-production VPC and their production application in another VPC.
Now that we have learned about Anypoint VPC, let’s learn more about load balancers in Runtime Manager.
Load balancer
A load balancer is one of the options available in Runtime Manager that enables the handling of the external HTTP/HTTPS traffic to multiple applications deployed in CloudHub workers in a VPC. CloudHub provides two types of load balancers:
- Shared load balancer (SLB): This provides a basic load-balancing functionally and is shared across multiple customers.
- Dedicated load balancer (DLB): This is an optional component of Anypoint Platform. This allows handling load balancing between different workers that run Mule applications.
Next, let’s take a quick look at another component of Anypoint Platform, API Manager.
Introducing API Manager
API Manager facilitates creating, managing, securing, and analyzing APIs. We can create the APIs in the following ways:
- Manage from Exchange
- Create a new API from a RAML/OAS/SOAP definition or an HTTP API
- Import an API from a .zip file
Once we create the API, we can apply the policies to secure our APIs. We will explore how to apply policies and custom policies in Chapter 10, Secure Your API.
Exploring Anypoint Monitoring
Anypoint Monitoring provides visibility to all the integrations across an application network. From the built-in dashboard (see Figure 5.35), we can check the following metrics:
- Number of Mule messages received
- Average response time of the API
- Number of errors received
- CPU utilization
- JVM heap memory used
- JVM thread count

Figure 5.35 – Anypoint Monitoring – Built-in dashboards
This dashboard gives a clear picture of application performance and failure details.
If we need to enable alerts for Mule applications, then we can set an alert in Anypoint Monitoring. Let’s learn how to create an alert in Anypoint Monitoring.
Alerts
From Anypoint Monitoring, we can configure an alert based on the metrics and send an email alert to a specific email ID or Anypoint user (see Figure 5.36).

Figure 5.36 – Anypoint Monitoring – Alerts
We can monitor the state (success/failure) of the alert. Alerts can be either enabled or disabled.
Let’s learn how to search the logs from Anypoint Monitoring.
Log Management
Log Management helps to search the log for any text from all applications and also different environments (see Figure 5.37).

Figure 5.37 – Anypoint Monitoring – Log Management
One of the features of Log Management is that our search can be saved for future reference. This helps the operation team to quickly search the logs from the saved search.
Let’s learn more about Visualizer, which is one of the components of Anypoint Platform.
Introducing Anypoint Visualizer
Anypoint Visualizer provides a real-time, graphical representation of the APIs. The data displayed in the graph dynamically gets updated and doesn’t require any specific configuration.
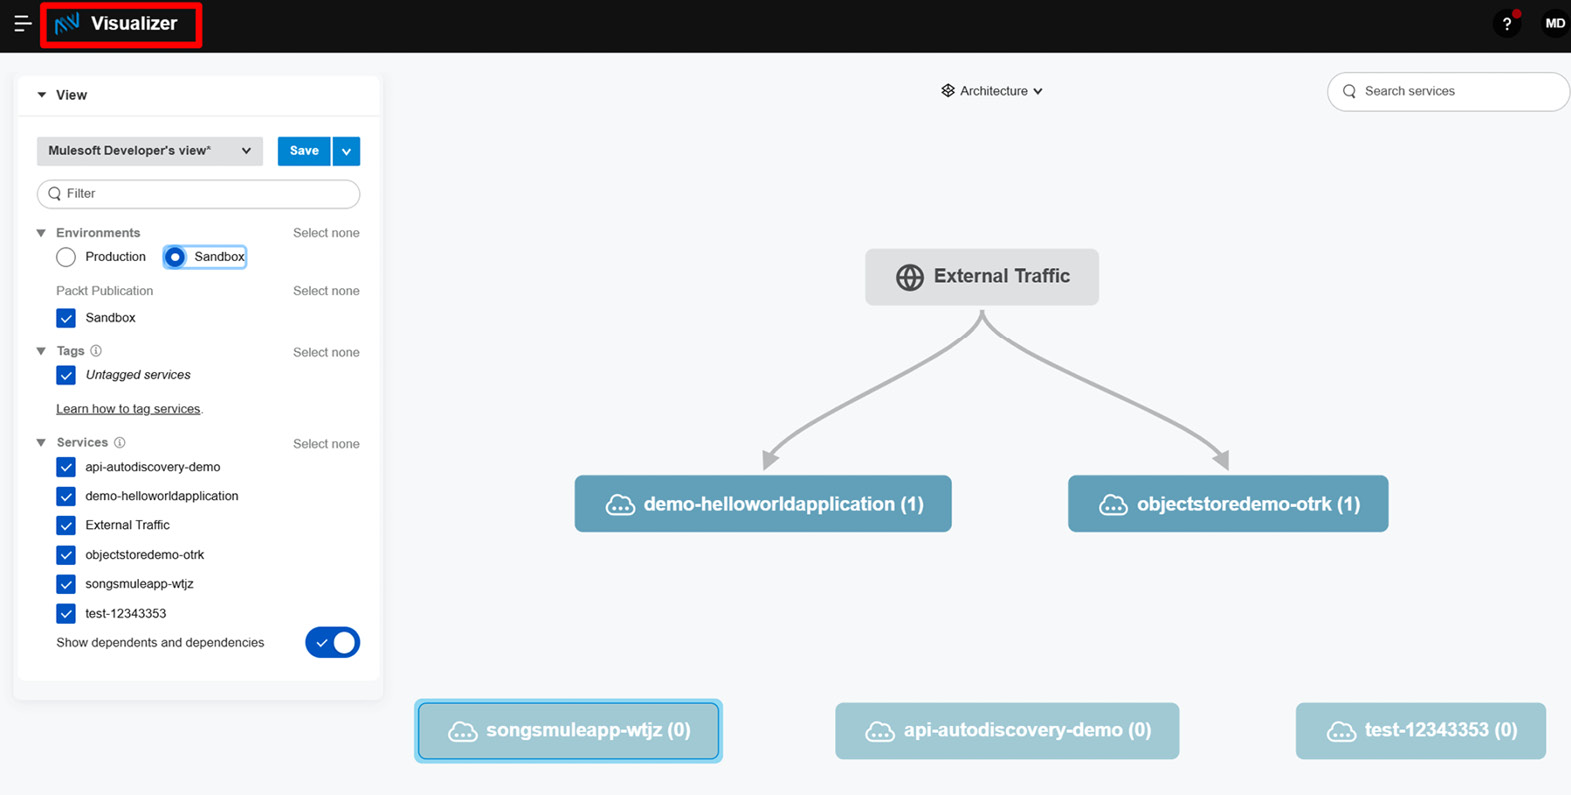
Figure 5.38 – Anypoint Visualizer
From this graphical view, we can easily understand how APIs are connected to each other (see Figure 5.38).
We now know how we can visualize a Mule application using Anypoint Visualizer. Let’s now explore Access Management, which is one of the components of Anypoint Platform.
Exploring Access Management
Access Management is used to manage an organization, business groups, users, roles, environments, identify providers, client providers, and audit logs in Anypoint Platform. Let’s see how each of them is managed.
Organization and business groups
When we create an Anypoint Platform account, a root organization gets created. The root organization can contain multiple business groups.
A business group is the child of the root organization. It is a self-contained resource group that contains resources such as Mule applications and APIs.
Invite user
From the Users link on the left-side navigation, we can invite users to our Anypoint Platform, as shown in Figure 5.39. By default, users are stored in Anypoint Platform.

Figure 5.39 – Anypoint Platform – Invite user
We can also configure identify providers (IdPs), which store and manage digital identities, in order to store the users.
Roles
Anypoint Platform comes with the following default roles, which are assigned to predefined permissions. We can assign the users to the roles (see Figure 5.40), based on their responsibilities. We can also create a new role and set the required permission for different components.

Figure 5.40 – Anypoint Platform – Roles
A user can also be assigned multiple roles, based on their responsibilities.
Environments
This tab enables you to add a new environment. For example, if we need more test/non-production environments, then we can create an environment such as System Integration Testing (SIT), Quality Assurance (QA), User Acceptance Testing (UAT), and so on.
Audit logs
Audit logs track user activity with date/time, product, action, IP address, and other details (see Figure 5.41).

Figure 5.41 – Anypoint Platform – Audit Logs
We can download audit logs as a .csv file using the Download option.
SUBSCRIPTION
This provides validity and subscription information for different environments, static IPs, VPC, and load balancers in Runtime Manager, and also Anypoint MQ and Object Store subscription/usage details.
With this, we have learned how to manage the access-related functions in Access Management.
Summary
This chapter is all about Anypoint Platform and its components: Design Center, Exchange, Runtime Manager, API Manager, Anypoint Monitoring, Anypoint Visualizer, and Access Management (organization and business groups). We have learned about each component’s functionalities. On completing this chapter, you now have sufficient knowledge of Anypoint Platform and can feel confident enough to design, manage and monitor Mule applications.
In the next chapter, we’ll explore DataWeave, an expression language used for transforming data from one format to another and performing complex logical transformations.
Questions
Take a moment to answer the following questions to serve as a recap of what you just learned in this chapter.
- What is Anypoint Platform?
- Are Anypoint Platform and Anypoint Studio the same?
- What is a reusable component of RAML?
- A is a business analyst, with minimal coding experience. Can A build his Mule application? Justify your answer.
- What is the minimum worker size in CloudHub?
- What are the components in which we can configure alerts?
Answers
- Anypoint Platform helps organizations to connect applications, data, and devices.
- No. They are not the same. Anypoint Studio is an IDE, which we use to build, test, and run a Mule application. Anypoint Platform is a UI-based control plane with which we can manage all the components of Anypoint Platform.
- An API fragment is a reusable component of RAML. It is not a complete RAML but a portion of a RAML specification. It can be created separately as an API fragment in API Designer and can be reused in multiple API specifications.
- Yes. Business analysts can easily design and build Mule applications from Flow Designer using drag and drop.
- The minimum worker size is 0.1 VCPU in CloudHub.
- We can configure alerts from the following components in Anypoint Platform:
- Anypoint Monitoring
- Runtime Manager
- API Manager