
Synchronicity – Video and synchronisation
Introduction
Audio, for all its artistic power and technological intricacy, is just one element in today’s multimedia entertainment phalanx. Today’s recording engineers are more likely to find themselves working in a MIDI studio locked to SMPTE timecode than they are to be rigging microphones. Today’s composer has a better chance of making his/her living by proactively seeking work for television and film (for which he/she will require an understanding of the medium) than to wait for a commission for a symphony from a rich patron! This chapter contains a description of the principles and concepts which form the technical foundations of an understanding of analogue and digital television.
Persistence of vision
The human eye exhibits an important property which has great relevance to the film and video industries. This property is known as the persistence of vision. When an image is impressed upon the eye, an instantaneous cessation of the stimulus does not result in a similarly instantaneous cessation of signals within the optic nerve and visual processing centres. Instead, an exponential ‘lag’ takes place with a relatively long time required for total decay. The cinema has exploited this effect for over 100 years. Due to the persistence of vision, if the eye is presented with a succession of still images at a sufficiently rapid rate, each frame differing only in the positions moving within a fixed frame of reference, the impression is gained of a moving image. In a film projector each still frame of film is drawn into position in front of an intense light source while the source of light is shut off by means of a rotating shutter. Once the film frame has stabilised, the light is allowed through – by opening the shutter – and the image on the frame is projected upon a screen by way of an arrangement of lenses. Experiments soon established that a presentation rate of about 12 still frames per second was sufficiently rapid to give a good impression of continuously flowing movement but interrupting the light source at this rate caused unbearable flicker. This flicker phenomenon was also discovered to be related to level of illumination; the brighter the light being repetitively interrupted, the worse the flicker. Abetted by the low light output from early projectors, this led to the first film frame-rate standard of 16 frames per second (fps). A standard well above that required simply to give the impression of movement and sufficiently rapid to ensure flicker was reduced to a tolerable level when used with early projection lamps. As these lamps improved flicker became more of a problem until an ingenious alteration to the projector fixed the problem. The solution involved a modification to the rotating shutter so that, once the film frame was drawn into position, the shutter opened, then closed, then opened again, before closing a second time for the next film frame to be drawn into position. In other words, the light interruption frequency was raised to twice that of the frame rate. When the film frame rate was eventually raised to the 24 fps standard which is still in force to this day, the light interruption frequency was raised to 48 times per second, a rate which enables high levels of illumination to be employed without causing flicker.
Cathode ray tube and raster scanning
To every engineer, the cathode ray tube (CRT) will be familiar enough from the oscilloscope. The evacuated glass envelope contains an electrode assembly and its terminations at its base whose purpose is to shoot a beam of electrons at the luminescent screen at the other end of the tube. This luminescent screen fluoresces to produce light whenever electrons hit it. In an oscilloscope the deflection of this beam is effected by means of electric fields – a so-called electrostatic tube. In television the electron beam (or beams in the case of colour) is deflected by means of magnetic fields caused by currents flowing in deflection coils wound around the neck of the tube where the base section meets the flare. Such a tube is known as an electromagnetic type.
Just like an oscilloscope, without any scanning currents the television tube produces a small spot of light in the middle of the screen. This spot of light can be made to move anywhere on the screen very quickly with the application of the appropriate current in the deflection coils. The brightness of the spot can be controlled with equal rapidity by altering the rate at which electrons are emitted from the cathode of the electron gun assembly. This is usually effected by controlling the potential between the grid and the cathode electrodes of the gun. Just as in an electron tube or valve, as the grid electrode is made more negative in relation to the cathode, the flow of electrons to the anode is decreased. In the case of the CRT the anode is formed by a metal coating on the inside of the tube flare. A decrease in grid voltage – and thus anode current – results in a darkening of the spot of light. Correspondingly, an increase in grid voltage results in a brightening of the scanning spot.
In television, the bright spot is set up to move steadily across the screen from left to right (as seen from the front of the tube). When it has completed this journey it flies back very quickly to trace another path across the screen just below the previous trajectory. (The analogy with the movement of the eyes as they ‘scan’ text during reading can’t have escaped you!) If this process is made to happen sufficiently quickly, the eye’s persistence of vision, combined with an afterglow effect in the tube phosphor, conspire to fool the eye, so that it does not perceive the moving spot but instead sees a set of parallel lines drawn on the screen. If the number of lines is increased, the eye ceases to see these as separate too – at least from a distance – and instead perceives an illuminated rectangle of light on the tube face. This is known as a raster. In the broadcast television system employed in Europe this raster is scanned twice in ![]() of a second. One set of 312.5 lines is scanned in the first
of a second. One set of 312.5 lines is scanned in the first ![]() of a second and a second interlaced set – which is not superimposed but is staggered in the gaps in the preceding trace – is scanned in the second
of a second and a second interlaced set – which is not superimposed but is staggered in the gaps in the preceding trace – is scanned in the second ![]() . The total number of lines is thus 625. In North America, a total of 525 lines (in two interlaced passes of 262.5) are scanned in
. The total number of lines is thus 625. In North America, a total of 525 lines (in two interlaced passes of 262.5) are scanned in ![]() of a second.
of a second.
This may seem like a complicated way of doing things and the adoption of interlace has caused television engineers many problems over the years. Interlace was adopted in order to accomplish a 2 to 1 reduction in the bandwidth required for television pictures with very little noticeable loss of quality. It is thus a form of perceptual coding – what we would call today a data compression technique. Where bandwidth is not so important – as in computer displays – non-interlaced scanning is employed. Note also that interlace is, in some respects, the corollary of the double exposure system used in the cinema to raise the flicker frequency to double the frame rate.
Television signal
The television signal must do two things, the first is obvious, the second less so. First, it must control the instantaneous brightness of the spot on the face of the cathode ray tube in order that the brightness changes which constitute the information of the picture may be conveyed. Second, it must control the raster scanning, so that the beam travels across the tube face in synchronism with the tube within the transmitting camera. Otherwise information from the top left-hand side of the televised scene will not appear in the top left-hand side of the screen and so on! In the analogue television signal this distinction between picture information and scan synchronising information (known in the trade as sync-pulse information) is divided by a voltage level known as black level. All information above black level relates to picture information, all information below relates to sync information. By this clever means, all synchronising information is ‘below’ black level. The electron beam therefore remains cut-off – and the screen remains dark – during the sync information. In digital television the distinction between data relating to picture modulation and sync is established by a unique codeword preamble which identifies the following byte as a sync byte.
Horizontal and vertical sync
The analogy between the eye’s movement across the page during reading and the movement of the scan spot in scanning a tube face has already been made. Of course the scan spot doesn’t move onto another page like the eyes do once they have reached the bottom of the page. But it does have to fly back to start all over again once it has completed one whole set of lines from the top to the bottom of the raster. The spot thus flies back in two possible ways: a horizontal retrace, between lines, and a vertical retrace, once it has completed one whole set of lines and is required to start all over again on another set. Obviously to stay in synchronism with the transmitting camera the television receiver must be instructed to perform both horizontal retrace and vertical retrace at the appropriate times – and furthermore not to confuse one instruction for the other!
It is for this reason that there exist two types of sync information known reasonably enough as horizontal and vertical. Inside the television monitor these are treated separately and respectively initiate and terminate the horizontal and vertical scan generator circuits. These circuits are similar – at least in principle – to the ramp or sawtooth generator circuits discussed in Chapter 5. As the current gradually increases in both the horizontal and vertical scan coils, the spot is made to move from left to right and top to bottom, the current in the top to bottom circuit growing 312.5 times more slowly than in the horizontal deflection coils so that 312.5 lines are drawn in the time it takes the vertical deflection circuit to draw the beam across the vertical extent of the tube face.
The complete television signal is illustrated in Figures 15.1 and 15.2 which display the signal using two different timebases. Notice the amplitude level which distinguishes the watershed between picture information and sync information. Known as black level this voltage is set to a standard 0 V Peak white information is defined not to go beyond a level of 0.7 V above this reference level. Sync information, the line or horizontal sync, 4.7 microsecond pulse is visible in the figure and should extend 0.3 V below the black reference level. Note also that the picture information falls to the black level before and after the sync pulse. This interval is necessary because the electron beam cannot instantaneously retrace to the left-hand side of the screen to restart another trace. It takes a little time – about 12 microseconds. This period, which includes the duration of the 4.7 microsecond line-sync pulse during which time the beam current is controlled ‘blacker than black’, is known as the line-blanking period. A similar, much longer, period exists to allow the scan spot to return to the top of the screen once a whole vertical scan has been accomplished, this interval being known as the field blanking or vertical interval.

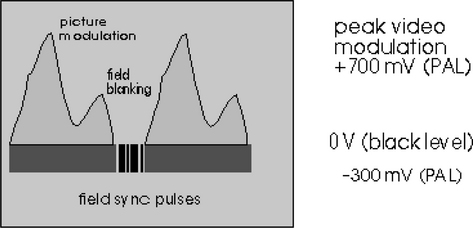
Looking now at Figure 15.2, a whole 625 lines are shown, in two fields of 312.5 lines. Notice the wider sync pulses which appear between each field. In order that a monitor may distinguish between horizontal and vertical sync, the duration of the line-sync pulses are extended during the vertical interval (the gap in the picture information allowing for the field retrace) and a charge-pump circuit combined with a comparator is able to detect these longer pulses as different from the shorter line-sync pulses. This information is sent to the vertical scan generator to control the synchronism of the vertical scan.
Colour perception
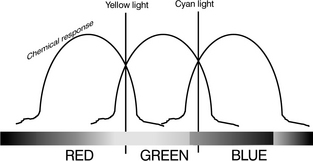
Sir Isaac Newton discovered that sunlight passing through a prism breaks into the band of multicoloured light which we now call a spectrum. We perceive seven distinct bands in the spectrum – red, orange, yellow, green, blue, indigo, violet. We see these bands distinctly because each represents a particular band of wavelengths. The objects we perceive as coloured are perceived thus because they too reflect a particular range of wavelengths. For instance, a daffodil looks yellow because it reflects predominantly wavelengths in the region 570 nm. We can experience wavelengths of different colour because the cone cells, in the retina at the back of the eye, contain three photosensitive chemicals each of which is sensitive in three broad areas of the light spectrum. It is easiest to think of this in terms of three separate but overlapping photochemical processes: a low-frequency (long-wavelength) RED process, a medium-frequency GREEN process and a high-frequency BLUE process. (Electronic engineers might prefer to think of this as three, shallow-slope band-pass filters!) When light of a particular frequency falls on the retina, the action of the light reacts selectively with this frequency-discriminating mechanism. When we perceive a red object we are experiencing a high level of activity in our long wavelength (low-frequency) process and low levels in our other two. A blue object stimulates the short wavelength or high-frequency process and so on. When we perceive an object with an intermediate colour, say the yellow of the egg yoke, we experience a mixture of two chemical processes caused by the overlapping nature of each of the frequency-selective mechanisms. In this case, the yellow light from the egg causes stimulation in both the long wavelength RED process and the medium-wavelength GREEN process (Figure 15.3). Because human beings possess three separate colour vision processes we are classified as trichromats. People afflicted with colour blindness usually lack one of the three chemical responses in the normal eye; they are known as dichromats although a few rare individuals are true mono-chromats. What has not yet been discovered, among people or other animals, is a more-than-three colour perception system. This is fortunate for the engineers who developed colour television!
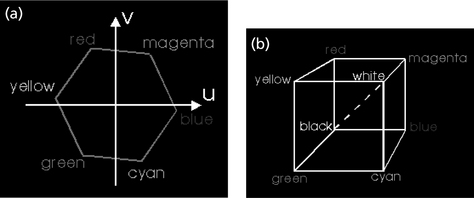
The fact that our cone cells only contain three chemicals is the reason that we may be fooled into experiencing the whole gamut of colours with the combination of only three, so called, primary colours. The television primaries of red, green and blue were chosen because each stimulates only one of the photosensitive chemicals found in the cone cells. The great television swindle is that we can, for instance, be duped into believing we are seeing yellow by activating both the red and green tube elements simultaneously – just as would a pure yellow source. Similarly we may be hoodwinked into seeing light blue cyan with the simultaneous activation of green and blue. We can also be made to experience paradoxical colours like magenta by combining red and blue, a feat that no pure light source could ever do! This last fact demonstrates that our colour perception system effectively ‘wraps around’, mapping the linear spectrum of electromagnetic frequencies into a colour circle, or a colour space. And it is in this way that we usually view the science of colour perception: we can regard all visual sense as taking place within a colour three space. A television studio vectorscope allows us to view colour three space end on, so it looks like a hexagon – Figure 15.4(a). Note that each colour appears at a different angle, like the numbers on a clock face. Hue is the term used in image processing and television to describe a colour’s precise location on this locus. Saturation is the term used to describe the amount a pure colour is ‘diluted’ by white light. The dotted axis shown in Figure 15.4(b). is the axis of pure luminance. The more a particular shade moves towards this axis from a position on the boundary of the cube, the more a colour is said to be desaturated.
Colour television
From the discussions of the trichromatic response of the eye and of the persistence of vision, it should be apparent that a colour scene may be rendered by the quick successive presentation of the red, green and blue components of a colour picture. Provided these images are displayed frequently enough, the impression of a full colour scene is indeed gained. Identical reasoning led to the development of the first colour television demonstrations by Baird in 1928 and the first public colour television transmissions in America by CBS in 1951. Known as a field-sequential system, in essence the apparatus consisted of a high field-rate monochrome television system with optical red, green and blue filters presented in front of the camera lens and the receiver screen which, when synchronised together, produced a colour picture. Such an electromechanical system was not only unreliable and cumbersome but also required three times the bandwidth of a monochrome system (because three fields had to be reproduced in the period previously taken by one). In fact, even with the high field rate adopted by CBS, the system suffered from colour flicker on saturated colours and was soon abandoned after transmissions started. Undeterred, the engineers took the next most obvious logical step for producing coloured images. They argued that rather than to present sequential fields of primary colours, they would present sequential dots of each primary. Such a (dot sequential) system using the secondary primaries of yellow, magenta, cyan and black forms the basis of colour printing. In a television system, individual phosphor dots of red, green and blue – provided they are displayed with sufficient spatial frequency – provide the impression of a colour image when viewed from a suitable distance.
Consider the video signal designed to excite such a dot-sequential tube face. When a monochrome scene is being displayed, the television signal does not differ from its black and white counterpart. Each pixel (of red, green and blue) is equally excited, depending on the overall luminosity (or luminance) of a region of the screen. Only when a colour is reproduced does the signal start to manifest a high-frequency component, related to the spatial frequency of the phosphor it is designed successively to stimulate. The exact phase of the high-frequency component depends, of course, on which phosphors are to be stimulated. The more saturated the colour (i.e. the more it departs from grey), the more high-frequency ‘colorising’ signal is added. This signal is mathematically identical to a black and white television signal whereupon is superimposed a high-frequency colour-information carrier-signal (now known as a colour subcarrier) – a single frequency carrier whose instantaneous value of amplitude and phase respectively determines the saturation and hue of any particular region of the picture. This is the essence of the NTSC1 colour television system launched in the USA in 1953, although, for practical reasons, the engineers eventually resorted to an electronic dot-sequential signal rather than achieving this in the action of the tube. This technique is considered next.
NTSC and PAL colour systems
If you’ve ever had to match the colour of a cotton thread or wool, you’ll know you have to wind a length of it around a piece of card before you are in a position to judge the colour. That’s because the eye is relatively insensitive to coloured detail. This is obviously a phenomenon which is of great relevance to any application of colour picture reproduction and coding; that colour information may be relatively coarse in comparison with luminance information. Artists have known this for thousands of years. From cave paintings to modern animation studios it is possible to see examples of skilled, detailed monochrome drawings being coloured in later by a less skilled hand.
The first step in the electronic coding of an NTSC colour picture is colour-space conversion into a form where brightness information (luminance) is separate from colour information (chrominance) so that the latter can be used to control the high-frequency colour subcarrier. This axis transformation is usually referred to as RGB to YUV conversion and it is achieved by mathematical manipulation of the form:
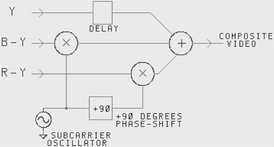
The Y (traditional symbol for luminance) signal is generated in this way so that it as nearly as possible matches the monochrome signal from a black and white camera scanning the same scene. (The colour green is a more luminous colour than either red or blue and red is more luminous than blue.) Of the other two signals, U is generated by subtracting Y from B: for a black and white signal this evidently remains zero for any shade of grey. The same is true of R – Y. These signals therefore denote the amount the colour signal differs from its black and white counterpart. They are therefore dubbed colour difference signals. (Each colour difference signal is scaled by a constant.) These signals may be a much lower bandwidth than the luminance signal because they carry colour information only, to which the eye is relatively insensitive. Once derived, they are low-pass filtered to a bandwidth of 0.5 MHz.2 These two signals are used to control the amplitude and phase of a high-frequency subcarrier superimposed onto the luminance signal. This chrominance modulation process is implemented with two balanced modulators in an amplitude-modulation-suppressed-carrier configuration – a process which can be thought of as multiplication. A clever technique is employed so that U modulates one carrier signal and V modulates another carrier of identical frequency but phase shifted with respect to the other by 90°. These two carriers are then combined and result in a subcarrier signal which varies its phase and amplitude dependent upon the instantaneous value of U and V. Note the similarity between this and the form of colour information noted in connection with the dot-sequential system: amplitude of high-frequency carrier dependent upon the depth – or saturation – of the colour, and phase dependent upon the hue of the colour. (The difference is that in NTSC, the colour subcarrier signal is coded and decoded using electronic multiplexing and demultiplexing of YUV signals rather than the spatial multiplexing of RGB components attempted in dot-sequential systems.) Figure 15.5 illustrates the chrominance coding process.
While this simple coding technique works well it suffers from a number of important drawbacks. One serious implication is that if the high-frequency colour subcarrier is attenuated (for instance, due to the low pass action of a long coaxial cable) there is a resulting loss of colour saturation. More serious still, if the phase of the signal suffers from progressive phase disturbance the colour in the reproduced colour is likely to change. This remains a problem with NTSC where no means is taken to ameliorate the effects of such a disturbance. The PAL system takes steps to prevent phase distortion having such a disastrous effect by switching the phase of the V subcarrier on alternate lines. This really involves very little extra circuitry within the coder but has design ramifications which means the design of PAL decoding is a very complicated subject indeed. The idea behind this modification to the NTSC system (for that is all PAL is) is that, should the picture – for argument’s sake – take on a red tinge on one line, it is cancelled out on the next when it takes on a complementary blue tinge. The viewer, seeing this from a distance, just continues to see an undisturbed colour picture. In fact, things aren’t quite that simple in practice but the concept was important enough to be worth naming the entire system after this one notion – Phase Alternation Line (PAL). Another disadvantage of the coding process illustrated in Figure 15.5 is due to the contamination of luminance information with chrominance and vice versa. Although this can be limited to some degree by complementary band-pass and band-stop filtering, a complete separation is not possible and this results in the swathes of moving coloured bands (cross-colour) which appear across high frequency picture detail on television – herringbone jackets proving especially potent in eliciting this system pathology.
In the colour receiver, synchronous demodulation is used to decode the colour subcarrier. One local oscillator is used and the output is phase shifted to produce the two orthogonal carrier signals for the synchronous demodulators (multipliers). Figure 15.6 illustrates the block schematic of an NTSC colour decoder. A PAL decoder is much more complicated.

Mathematically we can consider the PAL and NTSC coding process thus:
NTSC colour signal = Y + 0.49(B – Y) sin ωt + 0.88 (R – Y) cos ωt
PAL colour signal = Y + 0.49(B – Y) sin ωt ± 0.88 (R – Y) cos ωt
Note that following the demodulators, the U and V signals are low-pass filtered to remove the twice frequency component and that the Y signal is delayed to match the processing delay of the demodulation process before being combined with the U and V signals in a reverse colour space conversion. In demodulating the colour subcarrier, the regenerated carriers must not only remain spot-on frequency, but also maintain a precise phase relationship with the incoming signal. For these reasons the local oscillator must be phase locked and for this to happen the oscillator must obviously be fed a reference signal on a regular and frequent basis. This requirement is fulfilled by the colour burst waveform which is shown in the composite colour television signal displayed in Figure 15.7.

The reference colour burst is included on every active TV line at a point in the original black and white signal given over to line retrace. Notice also the high-frequency colour information superimposed on the ‘black and white’ luminance information. Once the demodulated signals have been through a reverse colour space conversion, and become RGB signals once more, they are applied to the guns of the colour tube.
Table 15.1
| NTSC | PAL | |
| Field frequency | 59.94 Hz | 50 Hz |
| Total lines | 525 | 625 |
| Active lines | 480 | 575 |
| Horizontal resolution | 440 | 572 |
| Line frequency | 15.75 kHz | 15.625 kHz |
(Note: Horizontal resolutions calculated for NTSC bandwidth of 4.2 MHz and 52 μs line period; PAL, 5.5 MHz bandwidth and 52 μs period.)
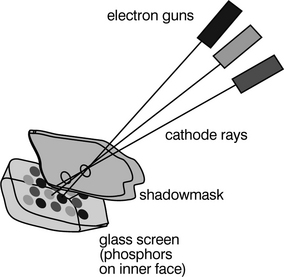
As you watch television, three colours are being scanned simultaneously by three parallel electron beams, emitted by three cathodes at the base of the tube and all scanned by a common magnetic deflection system. But how to ensure that each electron gun only excites its appropriate phosphor? The answer is the shadowmask – a perforated, sheet-steel barrier which masks the phosphors from the action of an inappropriate electron gun. The arrangement is illustrated in Figure 15.8. For a colour tube to produce an acceptable picture at reasonable viewing distance there are about half a million phosphor red, green and blue triads on the inner surface of the screen. The electron guns are set at a small angle to each other and aimed so that they converge at the shadowmask. The beams then pass through one hole and diverge a little between the shadowmask and the screen so that each strikes only its corresponding phosphor. Waste of power is one of the very real drawbacks of the shadowmask colour tube. Only about a quarter of the energy in each electron beam reaches the phosphors. Up to 75% of the electrons do nothing but heat up the steel!
Analogue video interfaces
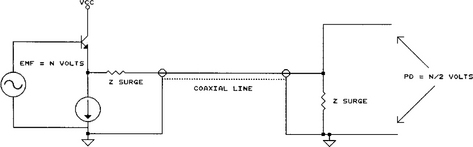
Due to their wide bandwidth, analogue television signals are always distributed via coaxial cables. The technique known as matched termination is universally applied. In this scheme both the sender impedance and the load impedance are set to match the surge impedance of the line itself. This minimises reflections. Standard impedance in television is 75 Ω A typical interconnection is shown in Figure 15.9. Note that matched termination has the one disadvantage, that the voltage signal arriving across the receiver’s termination is half that of the signal EMF provided by the sender. Standard voltage levels (referred to above) always relate to voltages measured across the termination impedance.
Digital video
In order to see the forces which have led to the rapid adoption of digital video processing and interfacing throughout the television industry in the 1990s, it is necessary to look at some of the technical innovations in television during the late 1970s and early 1980s. The NTSC and PAL television systems described above were primarily developed as transmission standards, not as television production standards. As we have seen, because of the nature of the NTSC and PAL signal, high-frequency luminance detail can easily translate to erroneous colour information. In fact, this cross-colour effect is an almost constant feature of the broadcast standard television pictures and results in a general ‘business’ to the picture at all times. That said, these composite TV standards (so named because the colour and luminance information travel in a composite form) became the primary production standard mainly due to the inordinate cost of ‘three-level’ signal processing equipment (i.e. routing switchers, mixers etc.) which operated on the red, green and blue or luminance and colour-difference signals separately. A further consideration, beyond cost, was that it remained difficult to keep the gain, DC offsets and frequency response (and therefore delay) of such systems constant, or at least consistent, over relatively long periods of time. Systems which did treat the R, G and B components separately suffered particularly from colour shifts throughout the duration of a programme. Nevertheless as analogue technology improved, with the use of integrated circuits as opposed to discrete semiconductor circuits, manufacturers started to produce three-channel, component television equipment which processed the luminance, R–Y and B–Y signals separately. Pressure for this extra quality came particularly from graphics areas which found working with the composite standards resulted in poor quality images which were tiring to work on, and where they wished to use both fine detail textures, which created cross-colour, and heavily saturated colours which do not produce well on a composite system (especially NTSC).
So-called analogue component television equipment had a relatively short stay in the world of high-end production largely because the problems of intercomponent levels, drift and frequency response were never ultimately solved. A digital system, of course, has no such problems. Noise, amplitude response with respect to frequency and time are immutable parameters ‘designed into’ the equipment – not parameters which shift as currents change by fractions of milliamps in a base-emitter junction somewhere! From the start, digital television offered the only real alternative to analogue composite processing and, as production houses were becoming dissatisfied with the production value obtainable with composite equipment, the death-knell was dealt to analogue processing in television.
4:2:2 protocol description – general
Just as with audio, so with video; as more and more television equipment began to process the signals internally in digital form, so the number of conversions could be kept to a minimum if manufacturers provided a digital interface standard allowing various pieces of digital video hardware to pass digital video information directly without recourse to standard analogue connections. This section is a basic outline of the 4:2:2 protocol (otherwise known as CCIR 601), which has been accepted as the industry standard for digitised component TV signals. The data signals are carried in the form of binary information coded in 8-bit or 10-bit words. These signals comprise the video signals themselves and timing reference signals. Also included in the protocol are ancillary data and identification signals. The video signals are derived by the coding of the analogue video signal components. These components are luminance (Y) and colour difference (Cr and Cb) signals generated from primary signals (R, G, B). The coding parameters are specified in CCIR Recommendation 601 and the main details are reproduced in Table 15.2.
Table 15.2
Encoding parameter values for the 4:2:2 digital video interface

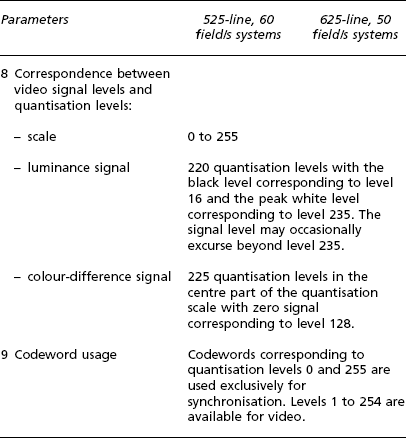
(Note that the sampling-frequencies of 13.5 MHz (luminance) and 6.75 MHz (colour difference) are integer multiples of 2.25 MHz, the lowest common multiple of the line frequencies in 525/60 and 625/50 systems, resulting in a static orthogonal sampling pattern for both. The luminance and the colour-difference signals are thus sampled to 8- (or 10-)bit depth with the luminance signal sampled twice as often as each chrominance signal (74 ns as against 148 ns). These values are multiplexed together with the structure as follows:
Cb, Y, Cr, Y, Cb, Y, Cr … etc.
where the three words (Cb, Y, Cr) refer to co-sited luminance and colour difference samples and the following word Y corresponds to a neighbouring luminance only sample. The first video data word of each active line is Cb.)
Timing relationships
The digital active line begins at 264 words from the leading edge of the analogue line synchronisation pulse, this time being specified between half amplitude points. This relationship is shown in Figure 15.10. The start of the first digital field is fixed by the position specified for the start of the digital active line: the first digital field starts at 24 words before the start of the analogue line No. 1. The second digital field starts 24 words before the start of analogue line No. 313.

Video timing reference signals (TRS)
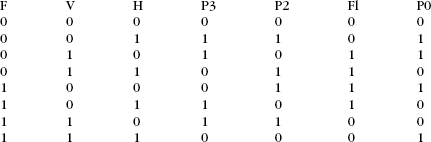
Two video timing reference signals are multiplexed into the data stream on every line, as shown in Figure 15.10, and retain the same format throughout the field blanking interval. Each timing reference signal consists of a four-word sequence, the first three words being a fixed preamble and the fourth containing the information defining:
This sequence of four words can be represented, using hexadecimal notation, in the following manner:
in which XY represents a variable word. In binary form this can be represented in the following form:

The binary values of F, V and H characterise the three items of information listed earlier:
V = 1 during the field-blanking interval;
H = 1 at the start of the line-blanking interval.
The binary values P0, P1, P2 and P3 depend on the states of F, V and H in accordance with the following table, and are used for error detection/correction of timing data:
Clock signal
The clock signal is at 27 MHz, there being 1728 clock intervals during each horizontal line period (PAL).
Filter templates
The remainder of CCIR Recommendation 601 is concerned with the definition of the frequency response plots for pre-sampling and reconstruction filter. The filters required by Recommendation 601 are practically difficult to achieve and equipment required to meet this specification has to contain expensive filters in order to obtain the required performance.
Parallel digital interface
The first digital video interface standards were parallel in format. They consisted of 8 or 10 bits of differential data at ECL data levels and a differential clock signal again as an ECL signal. Carried via a multicore cable, the signals terminated at either end in a standard D25 plug and socket. In many ways this was an excellent arrangement and is well suited to connecting two local digital videotape machines together over a short distance. The protocol for the digital video interface is Table 15.3. Clock transitions are specified to take place in the centre of each data-bit cell.
Table 15.3
The parallel digital video interface
| Pin No. | Function |
| 1 | Clock + |
| 2 | System Ground |
| 3 | Data 7 (MSB) + |
| 4 | Data 6 + |
| 5 | Data 5 + |
| 6 | Data 4 + |
| 7 | Data 3 + |
| 8 | Data 2 + |
| 9 | Data 1 + |
| 10 | Data 0 + |
| 11 | Data −1 + 10-bit systems only |
| 12 | Data −2 + 10-bit systems only |
| 13 | Cable shield |
| 14 | Clock − |
| 15 | System Ground |
| 16 | Data 7 (MSB) – |
| 17 | Data 6 – |
| 18 | Data 5 – |
| 19 | Data 4 – |
| 20 | Data 3 – |
| 21 | Data 2 – |
| 22 | Data 1 – |
| 23 | Data 0 – |
| 24 | Data −1 – 10-bit systems only |
| 25 | Data −2 – 10-bit systems only |
Problems arose with the parallel digital video interface over medium/long distances resulting in mis-clocking of the input data and visual ‘sparkles’ or ‘zits’ on the picture. Furthermore the parallel interface required expensive and non-standard multicore cable (although over very short distances it could run over standard ribbon cable) and the D25 plug and socket are very bulky. Today, the parallel interface standard has been largely superseded by the serial digital video standard which is designed to be transmitted over relatively long distances using the same coaxial cable as used for analogue video signals. This makes its adoption and implementation as simple as possible for existing television facilities converting from analogue to digital video standards.
Serial digital video interface
SMPTE 259M specifies the parameters of the serial digital standard. This document specifies that the parallel data in the format given in the previous section be serialised and transmitted at a rate ten times the parallel clock frequency. For component signals this is:
The serialised data must have a peak to peak amplitude of 800 mV (±10%) across 75 Ω, have a nominal rise time of 1 ns and have a jitter performance of ±250 ps. At the receiving end, the signals must be converted back to parallel in order to present the original parallel data to the internal video processing. (Note that no equipment processes video in its serial form although digital routing switchers and DAs, where there is no necessity to alter the signal, only buffer it or route it, do not decode the serial bit stream.)
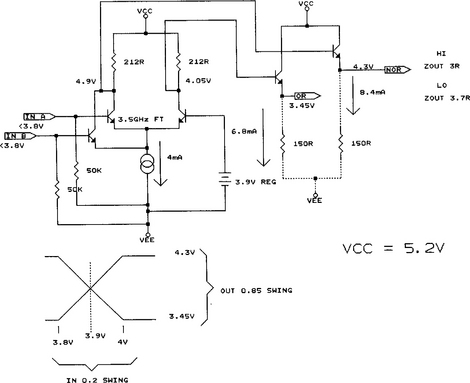
Serialisation is achieved by means of a system illustrated in Figure 15.11. Parallel data and a parallel clock are fed into input latches and thence to a parallel to serial conversion circuit. The parallel clock is also fed to a phase-locked loop which performs parallel clock multiplication (by 10 times). A sync detector looks for TRS information and ensures this is encoded correctly irrespective of 8- or 10-bit resolution. The serial data is fed out of the serialiser and into the scrambler and NRZ to NRZI circuit. The scrambler circuit uses a linear feedback shift register which is used to pseudo-randomise the incoming serial data. This has the effect of minimising the DC component of the output serial data stream, the NRZ to NRZI circuit converts long series of ones to a series of transitions. The resulting signal contains enough information at clock rate and is sufficiently DC free that it may be sent down existing video cables. It may be then be reclocked, decoded and converted back to parallel data at the receiving equipment. Due to its very high data rate serial video must be carried by ECL circuits. An illustration of a typical ECL gate is given in Figure 15.12. Note that standard video levels are commensurate with data levels in ECL logic. Clearly the implementation of such a high speed interface is a highly specialised task. Fortunately practical engineers have all the requirements for interface encoders and decoders designed for them by third-party integrated circuit manufacturers (Figure 15.13).

Embedded digital audio in the digital video interface
So far, we have considered the interfacing of digital audio and video separately. Manifestly, there exist many good operational reasons to combine a television picture with its accompanying sound ‘down the same wire’. The standard which specifies the embedding of digital audio data, auxiliary data and associated control information into the ancillary data space of the serial digital interconnect conforming to SMPTE 259M in this manner is the proposed SMPTE 272M standard.
The video standard has adequate ‘space’ for the mapping of a minimum of 1 stereo digital audio signal (or two mono channels) to a maximum of 8 pairs of stereo digital audio signals (or 16 mono channels). The 16 channels are divided into 4 audio signals in 4 ‘groups’. The standard provides for 10 levels of operation (suffixed A to J) which allow for various different and extended operations over and above the default synchronous 48 kHz/20-bit standard. The audio may appear in any and/or all the line blanking periods and should be distributed evenly throughout the field. Consider the case of one 48 kHz audio signal multiplexed into a 625/50 digital video signal. The number of samples to be transmitted every line is:
which is equivalent to 3.072 samples per line. The sensible approach is taken within the standard of transmitting 3 samples per line most of the time and transmitting 4 samples per line occasionally in order to create this non-integer average data rate. In the case of 625/50 this leads to 1920 samples per complete frame. (Obviously a comparable calculation can be made for other sampling and frame rates.) All that is required to achieve this ‘packeting’ of audio within each video line is a small amount of buffering either end and a small data overhead to ‘tell’ the receiver whether it should expect 3 or 4 samples on any given line.
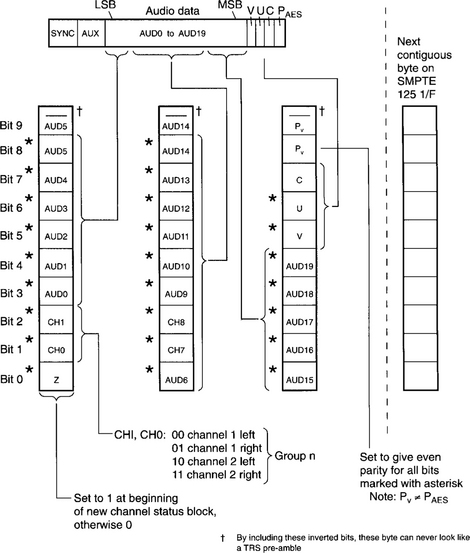
Figure 15.14 illustrates the structure of each digital audio packet as it appears on preferably all, or nearly all, the lines of the field. The packet starts immediately after the TRS word for EAV (end of active line) with the ancillary data header 000,3FF,3FF. This is followed by a unique ancillary data ID which defines which audio group is being transmitted. This is followed with a data-block number byte. This is a free-running counter counting from 1 to 255 on the lowest 8 bits. If this is set to zero, a de-embedder is to assume this option is not active. The 9th bit is even parity for b7 to b0 and the 10th is the inverse of the 9th. It is by means of this data-block number word that a vertical interval switch could be discovered and concealed. The next word is a data count which indicates to a receiver the number of audio data words to follow. Audio subframes then follow as adjacent sets of three contiguous words. The format in which each AES subframe is encoded is illustrated in Figure 15.15. Each audio data packet terminates in a checksum word.

The standard also specifies an optional audio control packet. If the control packet is not transmitted, a receiver defaults to 48 kHz, synchronous operation. For other levels, the control byte must be transmitted in field interval.
Timecode
As we have seen, television (like movie film) gives the impression of continuous motion pictures by the successive, swift presentation of still images, thereby fooling the eye into believing it is perceiving motion. It is probably therefore no surprise that timecode (deriving as it does from television technology) operates by ‘tagging’ each video frame with a unique identifying number called a timecode address. The address contains information concerning hours, minutes, seconds and frames. This information is formed into a serial digital code which is recorded as a data signal onto one of the audio tracks of a videotape recorder. (Some videotape recorders have a dedicated track for this purpose.)
Each frame’s worth of data is known as a word of timecode and this digital word is formed of 80 bits spaced evenly throughout the frame. Taking EBU timecode 3 as an example, the final data rate therefore turns out to be 80 bits × 25 frames per second = 2000 bits per second, which is equivalent to a fundamental frequency of 1 kHz; easily low enough, therefore, to be treated as a straightforward audio signal. The timecode word data format is illustrated (along with its temporal relationship to a video field) in Figure 15.16. The precise form of the electrical code for timecode is known as Manchester bi-phase modulation. When used in a video environment, timecode must be accurately phased to the video signal. As defined in the specification, the leading edge of bit ‘0’ must begin at the start of line 5 of field 1 (±1 line). Time address data is encoded within the 80 bits as 8, 4-bit BCD (binary coded decimal) words (i.e. 1, 4-bit number for tens and 1 for units). Like the clock itself, time address data is only permitted to go from 00 hours, 00 minutes, 00 seconds, 00 frames to 23 hours, 59 minutes, 59 seconds, 24 frames.

However, a 4-bit BCD number can represent any number from 0 to 9, so in principle timecode could be used to represent 99 hours, 99 minutes and so on. But, as there are no hours above 23, no minutes or seconds above 59 and no frames above 24 (in PAL), timecode possesses potential redundancy. In fact some of these extra codes are exploited in other ways. The basic time address data, and these extra bits are assigned their position in the full 80-bit timecode word, are like this:
| 0–3 | Frame units |
| 4–7 | First binary group |
| 8–9 | Frame tens |
| 10 | Drop frame flag |
| 11 | Colour frame flag |
| 12–15 | Second binary group |
| 16–19 | Seconds units |
| 20–23 | Third binary group |
| 24–26 | Seconds tens |
| 27 | Unassigned |
| 28–31 | Fourth binary group |
| 32–35 | Minutes units |
| 36–39 | Fifth binary group |
| 40–42 | Minutes tens |
| 43 | Unassigned |
| 44–47 | Sixth binary group |
| 48–51 | Hours units |
| 52–55 | Seventh binary group |
| 56–57 | Hours tens |
| 58–59 | Unassigned |
| 60–63 | Eighth binary group |
| 64–79 | Synchronising sequence |
Vertical interval timecode (VITC)
Longitudinal timecode (LTC) is a quasi-audio signal recorded on an audio track (or hidden audio track dedicated to timecode). VITC, on the other hand, encodes the same information within the vertical interval portion of the video signal in a manner similar to a Teletext signal. Each has advantages and disadvantages; LTC is unable to be read while the player/recorder is in pause, while VITC cannot be read while the machine is in fast forward or rewind modes. It is advantageous that a videotape has both forms of timecode recorded. VITC is illustrated in Figure 15.16 too. Note how timecode is displayed ‘burned-in’ on the monitor.
PAL and NTSC
Naturally timecode varies according to the television system used and for NTSC (SMPTE) there are two versions of timecode in use to accommodate the slight difference between the nominal frame rate of 30 frames per second and the actual frame rate of NTSC of 29.97 frames per second. While every frame is numbered and no frames are ever actually dropped, the two versions are referred to as ‘Drop-’ and ‘Non-drop-’ frame timecode. Non-drop-frame timecode will have every number for every second present, but will drift out of relationship with clock time by 3.6 seconds every hour. Drop-frame timecode drops numbers from the numbering system in a predetermined sequence, so that the timecode-time and clock-time remain in synchronisation. Drop-frame is important in broadcast work, where actual programme time is important.
User bits
Within the timecode word there is provision for the hours, minutes, seconds, frames and field ID that we normally see, and ‘user bits’ which can be set by the user for additional identification. Use of user bits varies with some organisations using them to identify shoot dates or locations and others ignoring them completely.