
Chapter 2
3D Nodes
2.1. Historical development
2.1.1. Distributed nodes
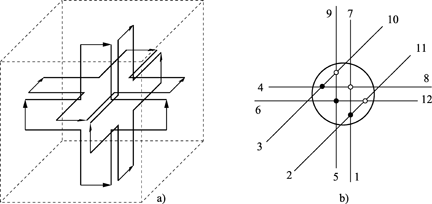
The nodes used in 2D [JOH 71, HOE 91] were combined into a distributed node which would enable 3D simulation. This node, as presented by Akhtarzad and Johns [AKH 74], is achieved by the interconnection of three series nodes and three parallel nodes, which thus form a cube with edges of length Δl/2 (Figure 2.1). The equivalent electrical scheme of the distributed node is given by [AKH 75]. The theory and the whole package of applications of these schemes are brought together in a review paper proposed by Hoefer [HOE 85]. The diverse components of the electromagnetic field are thus available at the corners of the cube, at the parallel nodes for the electrical field and at the series nodes for the magnetic field. The connection of multiple nodes of this type enables the simulation of a 3D medium.
The topology of the distributed node is similar to that of the FDTD for the Yee cell [YEE 66]. The advantage of the TLM approach is in the fact that we are making use of three out of six field components at each scattering point (the point where the transmission lines intersect on the scheme) against just one for FDTD. However, the distributed node requires twice as many variables as the FDTD cell. Furthermore, the major disadvantage of this node is the complexity of its numerical scheme [JOH 87]; the fields calculated at the scattering points are spatially separated and are therefore not instantly updated. This makes arbitrary wall modeling difficult [HOE 89]. Finally, programming of the variable meshing (i.e. having a dimension variation in space) becomes laborious.
Figure 2.1. Distributed 3D node

2.1.2. Asymmetrical condensed node (ACN)
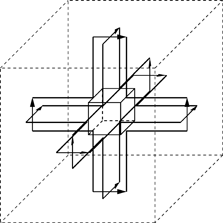
This node was proposed by P. Saguet and E. Pic [SAG 82]. It is obtained from the original 3D node by suppressing the line sections between the elementary series and parallel nodes (Figure 2.2a). This is done through the transfer of the elementary cell from the original T node to an elementary half-T cell. The interconnection between the three parallel and three series nodes is then achieved at a point, hence the name “node”. The asymmetrical condensed node in its simplest form (Figure 2.2b) is made up of 12 arms. Treatment of inhomogeneous and lossy media leads to a node containing 21 arms.
The advantage of this node is its ability to carry out scattering operations at a unique point in space. Thus the six field components are calculated simultaneously at this point. The walls can be applied at the center of the node, or more sensibly, at the mid-points between the nodes (i.e. on the cube faces). However, with the image of the distributed node, there remains an asymmetry; along the direction of propagation, the first connection encountered is either parallel or series. This implies that a wall seen in any direction has properties which are appreciably different from those under another incidence, especially at high frequencies. From this phase, development of 3D TLM nodes goes beyond the classic 2D node. The first step in this direction was proposed by Johns [JOH 86a, JOH 86b] with the symmetrical condensed node (SCN).
2.1.3. The symmetrical condensed node (SCN)
The configuration of this node (without permeability, permittivity and loss stubs) is shown in Figure 2.3. It preserves the advantages of a condensed scheme, while overcoming the defects from the ACN.
On each arm of this node, two pulses propagate, corresponding to wave cross-polarizations in the considered direction (Figure 2.4). The scattering process is carried out at a single point, or “connection”. We place this term in quotation marks as the development of this node is no longer based on an equivalent circuit of lines branching. In order to calculate its scattering matrix, Johns used Maxwell’s equations and the energy conservation law [JOH 87]. The node thus obtained has a scattering matrix of size 12 × 12 [HOE 89] for a cubic cell and an isotropic inhomogeneous medium.
Figure 2.3. The symmetrical condensed node

Figure 2.4. SCN and central connection
For simulating variable, non-cubic meshing and other more general media, only the stubs technique has been used with this node; six reactive arms are added to the center of the cell. The scattering matrix is thus a matrix of size 18 × 18. The incident and reflected voltages for each input are linked by this scattering matrix [HOE 89].
Fields E and H can be calculated at the center of any cell, at each iteration, from a linear combination of the incident voltages. For the simulation of electric and magnetic losses of a medium, infinite reactive arms can be added to the center of the cell, without changing the size of the S matrix [NAY 90, GER 90]. Indeed, it is sufficient to include these parameters in the calculation of matrix elements, since the reflected voltages on each reactive arm never return. Details of SCN theory and application can be found in [CHR 95], however we will study them more specifically in the following sections.
2.1.4. Other types of nodes
2.1.4.1. HSCN and SSCN nodes
Memory storage (18 voltages) as well as the time step are the main disadvantages of the SCN node. Indeed, if the meshing is not cubic, the time step is proportional to the ratio of the smallest dimensions to the largest. This constraint has the effect of significantly reducing the time step for a variable meshing, for instance. As a result, the number of iterations must be increased according to the same law. Two new TLM nodes minimize these problems: the HSCN [SCA 90, BER 94] (Hybrid SCN) and the SSCN [TRE 94] (Super SCN).
The basis for the improvements brought about by these two new nodes is the following idea: it is not necessary for all transmission lines linking these nodes to have the same characteristic impedance (Z0). Using this possibility, it is possible to free either the inductive reactive arms [SCA 90], or the capacitive reactive arms [BER 94]. This formulation defines the new hybrid node. It therefore enables a reduction in memory (15 voltages), while enabling a time step of around 1.7 times that of the SCN in more favorable cases. However, it is necessary to deal with the interfaces between media, since line impedances are no longer identical. On the other hand, based on the same principle, the SSCN node enables the reactive arms (12 voltages) to be freed from the structure, as well as the time step to be, in certain cases double that of the SCN [SCA 90, TRE 95a, TRE 95b]. For this node, there are six different arm impedances rather than three (HSCN). Conversely, the SSCN dispersion characteristics are not as good as those of the SCN and HSCN [TRE 95b, BER 95] in media other than a vacuum.
The properties of the SCN, HSCN and SSCN nodes can be deduced from the properties of a general node (GSCN), which we will study in section 2.2.
2.1.4.2. Alternating scheme (ATLM)
Note that in the best case (SSCN), the TLM algorithm requires up to 12 voltages per node, which is due to the apparent redundancy in the TLM method. We should add that this is without a doubt the reason for the appearance of parasitic (purely numeric) modes [RUS 95a], which are highly disruptive in the implementation of absorbing boundaries [CHE 93]. The ATLM scheme proposes overcoming this redundancy.
Figure 2.5. The ATLMscheme: white cells indicate the cells calculated in nΔt; black cells indicate those calculated in (n+1)Δt

Imagine a set of TLM cells within a homogeneous medium (Figure 2.5). In the white cells, we calculate the reflected voltages at time (n+l/2)Δt from the incident voltages at (n-l/2)Δt. These reflected voltages then become the incident voltages for the adjacent nodes. We then calculate the reflected voltages of the black cells at (n+l/2)Δt, and so on. This scheme was initially developed for the SSCN [RUS 95b]. It demands an alternative meshing philosophy. Indeed the boundaries must out of necessity be at a distance of Δl (and not Δl/2) from the center of the nodes, to insure synchronism. To that end, these walls need to be positioned at the center of the TLM nodes. This technique enables a 50% decrease in memory and makes the TLM method particularly cost effective in terms of computer resources. Furthermore, it enables parasitic modes to be eliminated [CHE 93] without any loss of precision. It is also suitable for the SCN node [CHE 93, KRU 96, BAD 96], with reactive arms of length Δl to preserve synchronism. This latter scheme represents a memory saving of 25% compared with the classic SCN. However, the ATLM scheme imposes a significant number of constraints. In order to respect TLM synchronism, we have indicated that with the ATLM model it is advisable to position boundaries at the center of the nodes. The direct impact of this constraint is that a new node needs to be created for each situation. The consequence is that the trivial issue of TLM meshing, which constitutes one of its forces and makes the adoption of this scheme difficult in situations where there are a number of different materials and walls, is suppressed. This assessment is equally valid in the case of variable meshing, where the boundary between areas of different density is situated at the center of the cells, which implies the creation of particularly “exotic” cells.
2.1.4.3. Split step scheme
The final 3D TLM scheme presented could equally be described as being alternating, even though it is quite different in nature [NAM 99]. This is an algorithm which aims to suppress the notion of a maximum time step in time methods. Indeed, this parameter is crippling when significant contrasts in dimensions exist within an analyzed structure. The coexistence of meshing zones of different contrasts implies the use of a very small time step and thus of an inversely proportional number of iterations. This type of scheme enables freedom from this.
The first studies in this area were conducted in FDTD under the name ADI-FDTD (alternate direction implicit FDTD) [NAM 99, ZHE 00]. Then, a scheme for TLM formalism was created: SS-TLM [LEM 04], which relies upon an “exploded” derivation of Maxwell’s equations. If, for instance, we depart from one of the projections of the Maxwell-Ampère equations along the Ox axis of the Cartesian system:
[2.1] ![]()
where ε is the permittivity of the medium and σexis the conductivity of the medium along the Ox axis, we can split this into two as follows:
[2.2] ![]()
[2.3] ![]()
The two equations will be solved sequentially within an iterative scheme. One TLM scheme arising from this type of equation results in an implied scheme, which no longer has any upper time step limit, other than the obvious Nyquist limit. However, the numerical error generated by this scheme forces the time step to be limited. If this does not present any advantage within a regular meshing configuration, in more difficult situations (i.e. with high contrast levels), the increase in calculation time is typically significant. Furthermore, the implied formulation can no longer be expressed in terms of voltage at the surfaces, but must be expressed in terms of fields at the center of the cell. The required memory is no more than 6 components of the field per cell (against 18 voltages for the SCN). Finally, this technique removes parasitic modes from the TLM method.
This formulation appears promising. However, as it is so new, it will not be developed in this book.
2.2. The generalized condensed node [TRE 95b]
2.2.1. General description
2.2.1.1. Notations
In general, on a particular transmission line, a total voltage pulse is defined as the sum of the incident and reflected pulses: V = Vi + Vr. Similarly, the total current is given by I = (Vi − Vr)/Z, where Z is the characteristic impedance of the line.
If the coordinate origin is situated at the center of the node, a voltage propagating in direction i polarized along j will be denoted by Vinj for the negative side of the node and Vipj for the positive side: i,j∈{x,y,z}i≠j.
On open stubs, the incident voltage is denoted by Voi and on short-circuit stubs by Vsi. The voltages on electric and magnetic loss matched stubs will be denoted by Vei and Vmi respectively.
For each transmission line the capacities and inductances per unit length in the i direction and polarized along j will be denoted by Cij and Lij. Similarly, the characteristic impedances and admittances will beZijandYij.
The total capacity and inductance of the stubs in the i direction will be denoted by Coi and Lsi, the characteristic impedances and admittances of these stubs are denoted by Zsi and Yoi respectively.
Although a general study is possible, here we are only interested in so-called “balanced” nodes, i.e. where the impedances of the lines from both sides of the node (in the same direction and for the same polarity) are identical.
2.2.1.2. Constitutive relationships in generalized nodes
Each cell has dimensions Δx, Δy and Δz and contains a non-dispersive anisotropic material, defined by its permittivity tensor ![]() and its permeability tensor
and its permeability tensor ![]() :
:
[2.5] 
The total capacity of the block is given by:
[2.6] 
which gives, in the 3 directions:
[2.7] ![]()
[2.8] ![]()
[2.9] ![]()
Similarly, the total inductance of the block is given by:
[2.10] 
[2.11] ![]()
[2.12] ![]()
[2.13] ![]()
These are the components of the total capacity Ct and total inductance Lt vectors of the block of matter, modeled by the TLM cell. This cell must therefore reproduce the corresponding capacity and inductance in each direction.
For example, let us take the total capacity of the cell in the y direction. This consists of the lineic capacities of the two polarized transmission lines along y, of length Δx and Δz, as well as the capacity of the open stub, which gives us:
[2.14] ![]()
Similarly, for the total inductance in the z direction, for example:
[2.15] ![]()
Following the same process, six equations can be obtained which can be compared with equations [2.7] to [2.9] and [2.11] to [2.13].
The following six equations are thus obtained:
[2.16] ![]()
[2.18] ![]()
[2.19] ![]()
[2.20] ![]()
[2.21] ![]()
These six equations form the basis for modeling the medium using TLM networks including any 3D node.
There are therefore 18 parameters to be determined:
Six lineic capacities, six lineic inductances, three total capacities of open stubs and three total inductances of short-circuit stubs. There therefore remains 12 degrees of freedom for determining these parameters.
In TLM schemes, time synchronism must be maintained for the whole network. The pulses must arrive at the center of the node simultaneously, following a propagation time Δt (time step).
Let us take, for example, the propagation velocity on a transmission line directed along x and polarized along y. We have: ![]() and additionally
and additionally ![]() .
.
Time synchronism therefore imposes six new equations:
[2.22] ![]()
[2.24] ![]()
[2.25] ![]()
[2.26] ![]()
[2.27] ![]()
Taking these six constraints into account, there still remains six degrees of freedom.
Additional constraints can therefore be applied which will lead to different versions of the 3D TLM node.
Of course, modeling losses is always possible, as we have already shown in Chapter 1 (see 1.2.3). Infinitely long stubs or stubs terminated by a matched load are inserted. If we consider the electrical and “magnetic” effective conductivities σek and σmk in the k direction, the loss elements in the 3D TLM node are defined by:
[2.28] ![]()
[2.29] ![]()
2.2.2. Derivation of 3D TLM nodes
2.2.2.1. Nodes equipped with stubs: the SCN node
As stated in the previous section, we have six degrees of freedom which enable the imposition of new constraints. Six additional constraints can easily be obtained by using transmission lines, all with the same characteristic impedance Z0. This is the situation with the traditional SCN node.
Therefore: Zij = Z0 (Yij = Y0= 1/Z0) and the system [2.16] to [2.21] is reduced to:
[2.30] ![]()
[2.31] ![]()
i,j,k pertain to { x,y,z } and are not identical.
Therefore the only parameters to be determined are Y0k and Zsk. We obtain:
[2.32] ![]()
[2.33] ![]()
![]() being the velocity of light.
being the velocity of light.
In order for the process to be stable, all of the stubs must have positive or null impedance or admittance and we must therefore have:
[2.34] ![]()
[2.35] ![]()
i,j,k∈{x,y,z} i ≠ j,k.
If the network is cubic, then ΔI = Δj = Δk = Δl and we then find: ![]()
From equations [2.34] and [2.35] it follows that if the mesh step is increased in one direction in order to decrease the required memory, the maximum time step will decrease proportionally, which signifies that the computing time will also increase. What is gained on one side is lost on the other.
2.2.2.2. Hybrid nodes
2.2.2.2.1. Type I HSCN nodes
The previous disadvantage may be avoided if the SCN node constraint (all of the characteristic impedances being identical) is relaxed. This idea has been explored and implemented for the SCN and described in [CHR 95, TRE 95b, BER 95] under the name HSCN (hybrid symmetrical condensed node). Let us assume, for example, that the transmission lines linking the nodes are sufficient to model the inductance of the block. This being the case, the short-circuit stubs become useless and Zsk is therefore null. The transmission lines used to model the same magnetic component must have the same characteristic impedance, and there are therefore three new conditions, which are written as: Zij=Zij for i,j ∈ {x,y,z} i ≠ j.
By applying these conditions to equations [2.30] and [2.31], we obtain:
[2.36] ![]()
or:
[2.37] ![]()
Carrying these values forward into expression [2.32], the value for the characteristic admittance of the open stub in the k direction is obtained:
[2.38] ![]()
Equation [2.36] shows that if the simulated medium is inhomogeneous in terms of permeability, or if the meshing varies in a particular direction, the characteristic impedances of the transmission lines in this direction will not be identical at the interface between two nodes of different regions. Reflection and transmission coefficients should be applied as indicated in 2D in Chapter 1 (Figure 1.7). We note also that for a uniform meshing, there is no correction to be made if the medium presents different permittivities but the same permeability throughout.
2.2.2.2.2. Type II HSCN hybrid nodes
What we have just done for inductances can also be done for capacities. If the transmission lines linking the nodes are sufficient to model the total capacity of the simulated matter block, the open stubs are no longer necessary and we then have: Yok = 0 and the characteristic admittances of the lines should be such that: Yik= Yjk ij,ke {x,y,z} i ≠ j,k. By inserting these values into expression [2.30], then:
[2.39] ![]()
These values are carried forward into expression [2.31], leading to the following value for the characteristic impedances of short-circuit stubs:
[2.40] ![]()
Equation [2.39] shows that if the simulated medium is inhomogeneous in terms of permeability, or if the meshing is variable in a particular direction, then the characteristic impedances of the transmission lines in this direction will not be identical at the interface between two nodes of different regions. Reflected and transmission coefficients should be applied as indicated in 2D in Chapter 1 (Figure 1.7). We note also that for a uniform meshing, there is no correction to be made if the medium presents different permeabilities but the same permittivity throughout.
The choice between the two types of nodes could be dictated by these considerations.
2.2.2.2.3. Maximum time step of HSCN nodes
The maximum time step for the HSCN node can be determined in the same way as for the SCN node, by enforcing a positive or null value at the stubs.
For example, for the type I node, the following condition should be respected:
[2.41] 
where ij,ke ∈{x,y,z} i≠j,k
Following the values for Δi and Δj, the maximum time step will be such that:
[2.42] ![]()
where Δl is the smallest of the dimensions.
We see that the value for the time step in hybrid nodes is greater than for the SCN node and is not strictly dependent on the smallest dimension of the node.
2.2.3. Scattering matrices
2.2.3.1. Line scattering
The scattering of incident pulses on a node constitutes the core of the TLM algorithm. In order to establish this scattering matrix, let us consider a polarized voltage along the y axis propagating along the x axis. Generally, the voltages of the two sides of the node are different, i.e. Vxny differs from Vxpy. However, the conservation of charge enables the definition for the total equivalent voltage Vy at the centre of the node, as the average of the voltages on both sides of the node (in the case studied where the characteristic impedances of the lines from the two sides of the node are identical). Therefore:
[2.43] ![]()
Similarly, a total equivalent current Iz can be defined and the magnetic flux continuity across the node dictates that:
[2.44] ![]()
By introducing incident and reflected voltages on the node, we obtain:
[2.45] ![]()
[2.46] ![]()
From these two expressions, we deduce:
[2.47] ![]()
[2.48] ![]()
The reflected pulses for the other directions and polarizations will be obtained from equations of the same type.
In order to determine the scattering matrix, the values of Vy and Iz, based on the incident voltages on the node, must be known.
2.2.3.2. Scattering into the stubs
The total voltage on the open and matched stubs is determined by the component of the corresponding electrical field. Simply, therefore:
[2.49] ![]()
[2.50] ![]()
there is no incident voltage on the electrical loss stub.
In the same way, for the short-circuit and the magnetic (matched) loss stubs:
[2.51] ![]()
[2.52] ![]()
All of these equations will enable us to determine the value of the total equivalent voltage as well as the equivalent total current.
2.2.3.3. Total equivalent voltage
The total equivalent voltage Vy is obtained from the conservation of charge relative to the component Ey of the electrical field:
or:
[2.54] ![]()
where In,y are the currents in all of the polarized lines along y, which gives us:
[2.55] 
A similar equation can be written for the other two polarizations, x and z.
By using equation [2.43], the reflected pulses on the polarized lines along y and propagating along z can be expressed as:
[2.56] ![]()
By symmetry, for the pulses directed along z, we obtain:
[2.57] ![]()
Inserting equations [2.56] and [2.57] into expression [2.55], the value for the polarized equivalent voltage along y, uniquely based on the incident voltages on the node, can be obtained:
[2.58] ![]()
The total voltages for the other two polarizations are obtained in the same way.
2.2.3.4. Equivalent total current
The total equivalent current Iz can be calculated from the conservation of magnetic flux for transmission lines coupled with the magnetic field component Hz. For example:
[2.59] ![]()
which is equivalent to:
[2.60] ![]()
By using an identical approach to that used for the total equivalent voltage, we reach a total equivalent current value which is only dependent on incident voltages on the node:
[2.61] ![]()
The total currents Ix and Iy are obtained in the same way.
2.2.3.5. Pulse scattering equations
From equations [2.47], [2.48] and other similar equations, it is now possible to obtain all of the expressions which give reflected pulses, and to therefore deduce the scattering matrix. This can be summarized by:
[2.62] ![]()
[2.63] ![]()
The + sign is applied for (i,j,k) ∈ {(x,y,z), (y,z,x), (z,x,y)} while the − sign is applied for (i,j,k) ∈ {(x,z,y), (y,x,z), (z,y,x)}.
The reflected voltages on the stubs are given by:
[2.64] ![]()
[2.65] ![]()
[2.66] ![]()
[2.67] ![]()
where i ∈ {x,y,z}.
2.2.3.6. Generalized condensed node scattering matrix
By using equations [2.62] to [2.67], the S scattering matrix can now be constructed from the generalized condensed node.
This matrix has 18 columns and 24 rows. The 18 columns correspond to the 12 transmission lines, 3 permittivity stubs (13–14–15) and 3 permeability stubs (16–17–18). The numbering of the transmission lines from 1 to 12 corresponds to the historical scheme of the SCN node (Figure 2.3).
To obtain the 24 rows, the three electrical loss stubs and the three magnetic stubs without incident pulses (matched stubs) are added.
The elements of the scattering matrix are given by:
[2.68] 
[2.69] ![]()
[2.70] ![]()
[2.71] 
[2.72] 
[2.73] ![]()
[2.74] ![]()
This general matrix will enable us to deal with problems of dispersion in later chapters. From this the classic SCN node scattering matrix can be obtained by enforcing that all characteristic impedances of the transmission lines are identical and equal to Z0.
If, on the other hand, the medium has no losses, then rows 19 to 24 disappear, whereas if there are no permittivity or permeability stubs, then rows and columns 13 to 18 no longer exist. Figure 2.6, for example, gives the scattering matrix of the cubic SCN node for propagation in air. Of course the original matrix provided by Johns [JOH 87] is derived.
The scattering matrix of the type I HSCN node is obtained by imposing that the short-circuit stubs have null impedance, whereas the type II HSCN node matrix will be obtained by canceling all the open stub admittances.
For example, the scattering matrix of the type I cubic HSCN node for an isotropic medium with relative permittivity εr and permeability µ0 is given by Figure 2.8, where:
Figure 2.6. Scattering matrix for the cubic SCN node in air


2.3. Time step
The time step must be maximum in order to limit the number of iterations. The algorithm remains stable if all of the TLM network impedances and admittances are positive or null. This condition determines the maximum step that can be used. This step is calculated for each block of space with given properties (basic mesh dimension, permittivity, etc.). The smallest of the maximum steps obtained is therefore the upper limit of At. For the SCN node, the equations therefore give:
[2.75] ![]()
[2.76] ![]()
whereas for the type I HSCN node, equation [2.41] would give us:
[2.77] 
Figure 2.9. Evolution of the maximum time step in a vacuum with varying cell dimensions
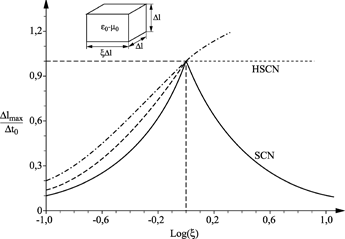
The maximum time step is highly dependent on the ratio of the cell dimensions, as we see in Figure 2.9, which gives the maximum steps for the SCN, HSCN and SSCN nodes. For a cubic cell within the vacuum, the three node types give the same time step Δt0, but the SCN node becomes poor from this point of view compared to the HSCN and SSCN (the best in this case).
2.4. Dispersion of 3D nodes
We have already studied the dispersion (or velocity error) of 2D nodes. In this section, we will look at how regular 3D nodes behave. The dispersion relation is an implicit function of the propagation constant in the three network directions, the frequency and the constitutive parameters of the media. The rigorous procedure for determining the dispersion relation in a homogeneous medium for generalized 3D nodes is given by different authors, but it currently seems impossible to study an inhomogeneous structure analytically. The comparison between the different types of nodes will, in this case, be given by using these different nodes to simulate a specific structure.
2.4.1. Theoretical study in simple cases [TRE 95b]
The dispersion relation can be written in matrix form according to [KRU93]:
[2.78] ![]()
NOTE.– For the rest of this book, matrices and vectors will be indicated in bold.
Θ represents the phase variation along the transmission lines which make up the network and is defined by θ = ωΔt, I is the unit matrix, S the scattering matrix of the considered node and P is a matrix connecting two nodes. This connection matrix stems from the Floquet theorem which links voltage pulses on a node to the voltage pulses on neighboring nodes. It involves components kx, ky and kz of the wave vector k, which enables the phase variations in the three directions to be described. The elements of the P matrix are null, apart from:
[2.79] 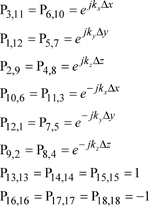
The notations used correspond to those used in Figure 2.3, which represented the SCN node. Of course, rows and columns 13 to 15 and/or 16 to 18 disappear if the corresponding stubs are not present in the considered node. Relation [2.78] is based on the time step in the mesh and the properties of the medium (through the S matrix). Therefore, for nodes without the same scattering matrix, the dispersion relations are different and the properties of the nodes are not the same. The solution to relation [2.78] is an eigenvalue problem which may be complex. Here we will settle for providing some results, but demonstrations of these solutions can be found in [TRE 95b].
2.4.1.1. Dispersion relation for nodes without stubs
The solution to equation [2.78] in the case of a 12 arm node leads to the following expression (uniform mesh, unit length Δl in the three directions):
[2.80] ![]()
2.4.1.2. Analysis of the solution
The dispersion relation for Maxwell’s equations within an isotropic, non-dispersive medium is given by:
[2.81] ![]()
where the amplitude of the propagation constant k is:
[2.82] ![]()
If we use the Taylor expansion of the cosine for small arguments cos(x) ≈ 1−x2/2, then equation [2.80] is reduced to:
[2.83] ![]()
which actually corresponds to equation [2.81], with a propagation velocity equal to Δl/(2Δt).
However, the dispersion relation [2.80] does have other solutions which do not correspond to the dispersion relation for Maxwell’s equations. Indeed relation [2.80] only makes use of the products of cosines, such as:
[2.84] ![]()
The result of this is that for every low frequency solution ω of relation [2.80] there is a corresponding high frequency solution ![]() . Therefore, for all LF solutions (0≤ωΔt≤π/2) resulting from [2.80]:
. Therefore, for all LF solutions (0≤ωΔt≤π/2) resulting from [2.80]:
[2.85] 
there is an HF solution (π/2≤ωΔt≤π) given by:
[2.86] 
[2.85] is a physical propagation solution which corresponds to Maxwell’s equations, whereas [2.86] is a parasitic solution which is, however, easy to eliminate through a low-pass time filter. Unfortunately, it is not possible, for high values of k, to filter parasitic mode solutions from relation [2.85]. However, these high spatial frequency values are not easily excited, although they may nevertheless be present. The various solutions are presented in Figure 2.10, where the dispersion diagram is given for direction [1,1,1].
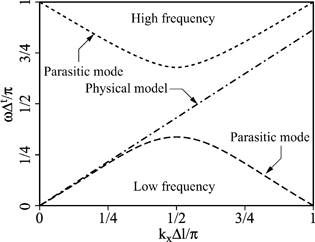
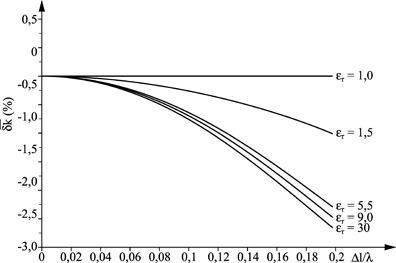
Figure 2.11. Relative velocity error of the HSCN node for an axial propagation [CHU 04]
Analytical solutions for SCN nodes with stubs and for HSCN nodes can be obtained in the same way [TRE 95b]. However, these solutions are highly complex and it is undoubtedly better to solve dispersion relation [2.78] using numerical methods. Additionally, analytical solutions are only valid for homogeneous media, which is quite restrictive.
Figure 2.11 gives an overview of the velocity error due to dispersion for the HSCN node, for propagation in an axial direction. When the relative permittivity is equal to 1, there is no dispersion of the HSCN (or SCN) node. This dispersion increases significantly when permittivity increases.
2.4.2. Case of inhomogeneous media
Le Maguer [LEM 98] carried out tests on partially filled resonant dielectric cavities, with the aim of studying the dispersion of various nodes by determining the resonance frequency of these cavities. The TLM has been successively used with SCN (with stubs), HSCN and SSCN nodes. Several meshes have also been implanted.
The results obtained have shown that, in every case studied, the HSCN node was the best performer, followed by the SCN node, while the SSCN node was the most dispersive. Other authors have reached identical conclusions [PEN 97] [GER 96].
From this point of view, the HSCN node therefore possesses a certain advantage. Let us not forget, however, that the SSCN node clearly requires less memory. Sometimes, the computer resources guide the choice of one node over another.
2.5. Absorbing walls
During the use of volume numerical methods, it is essential to be able to restrict the computation domain. Indeed, when the structure studied is of a significant size (several times the wavelength of interest), the computation volume may restrict, or even prevent the study of structures, as a consequence of prohibitive required computer resources. The problem is generally crucial when the computation domain is open over free space, or when a hyperfrequency circuit (infinite guide) needs to be matched. The issue is much less simple, working in the time domain, when it becomes necessary to be able to terminate the computation domain for a very wide frequency band. In this case, absorbing boundaries must be inserted into codes at the limits of the computation domain, which, in the frequency band being studied, must present a very low reflection, whatever the incidence of the wave.
Historically, multiple absorbing boundaries have been used, the simplest of these being matched impedance.
2.5.1. Matched impedance
The fact that all of the tangential fields at the faces of the TLM cell are being used enables an impedance condition to be imposed. This is inserted into the TLM algorithm using a reflection coefficient, which links the reflected and incident voltages of the node placed against the boundary. The chosen impedance is the characteristic impedance of the medium. This boundary is then perfect under normal incidence. However, for arbitrary incidences, their performances degrade significantly. Indeed, for a wave arriving at the wall with incidence angle θ, the reflection coefficient is:
[2.87] ![]()
The quality of the reflection coefficient is dependent on the chosen value of the impedance, and the layer will only be perfect for a given incidence and therefore for a given frequency.
This type of boundary is principally used to terminate the TLM mesh in simulations where the boundary conditions are of little importance (such as the absence of radiation for the structures).
2.5.2. Segmentation techniques
This technique consists of dividing the computation domain into sub-domains, which are handled separately, and then reassembled. This method is particularly attractive for simulations where a section of the computation volume remains unchanged. This technique was first developed by Kron [KRO 63] and then intensively used with frequency methods. It was later adapted to a time domain method (TLM) by Johns [JOH 81] in 1981. This is a natural adaptation, when the tangential field components (or equivalently, the voltages) are available to the interfaces. However, as the pulse response of the sub-domains (which may be interpreted as a numerical Green function) must be calculated and stored, the computer resources quickly constitute a limit. The pulse response is also known as the Johns matrix. More technically, this matrix enables the simulation of a sub-region. It enables incident voltages to be obtained in the domain of interest through the use of a spatiotemporal convolution, calculated from the series of reflected voltages at the previous incidences.
2.5.3. Perfectly matched layers
Perfectly matched layers (PML) are layers introduced by Bérenger [BÉR 94] in order to simulate infinite space with the FDTD (finite-difference time-domain) method. PML layers were implemented into the TLM method for the first time by using an interface between the TLM and FDTD meshes (Figure 2.12), called a non-unified (hybrid) algorithm.
The results obtained are of very good quality (−50 dB reflection for the TE10 mode in a rectangular guide). However, problems due to field interpolation may occur. Indeed, if the zone where coupling takes place has a very high field gradient, then it causes an error in interpolations, which is no longer negligible with regard to the reflection performance demanded. These problems have prompted authors to turn to a unified algorithm. A 2D TLM algorithm has been developed, and a new SCN node has been proposed [PEN 97] so that Bérenger’s PML layers can be implemented into the 3D TLM method.

2.5.3.1. PML Layer theory
The PML technique consists of enclosing the structure with matched layers. Within these layers, the components of the field are divided into two sub-components, as follows:
[2.88] ![]()
where (i, j, k) ∈ {(x, y, z), (y, z, x), (z, x, y)}.
The same expression is valid for magnetic field components.
Bérenger considers the form of Maxwell’s equations which describes the TE mode in PML layers as follows:
[2.89] ![]()
where:
– σei is the electrical conductivity in the Oi direction;
– αi > 1, is the doping of evanescent waves in the Oi direction.
The same expressions are valid for magnetic field components.
If the structure is terminated by a PML layer in the Oi direction the following relation (impedance matching) must be verified:
[2.91] ![]()
where:
– μi is the relative permeability of the medium;
– σei is the electrical conductivity in the Oi direction;
– σmi is the magnetic conductivity in the Oi direction.
The simulation results show that numerical reflections appear between two media with different conductivities. These reflections are proportional to the ratio of the conductivities. In order to overcome this, the PML layer is enlarged and a conductivity profile is imposed on it. The same treatment is applied to the αi coefficients.
2.5.3.2. PMLsfor the SCNnode [LEM 0la]
PML layers for the SCN node are described by modifying the Maxwell equations, with the six electromagnetic field components divided into 12 sub-components and with anisotropic magnetic and electrical conductivities.
In the TLM method, each plane wave, which penetrates the cells in the x, y or z direction, is associated with a pulse propagating from the center of the cell through one of the twelve transmission lines which link the node to its six neighbors. According to Huygens’ principle, these pulses are scattered at the center of the node and the reflected waves are associated with them.
2.5.4. Optimization of the PML layer profile [DUB 00, KON 03]
In numerical simulation, it is possible, in order to optimize the reflection coefficient, to use media without any physical reality. This particularity enables concepts which cannot be utilized in testing.
Let us consider a medium with electrical (σe) and magnetic (σm) losses, a permittivity εo εr and the permeability of the vacuum µo. The following condition is raised:
[2.92] ![]()
The impedance Z of the medium is the same as the medium without losses:
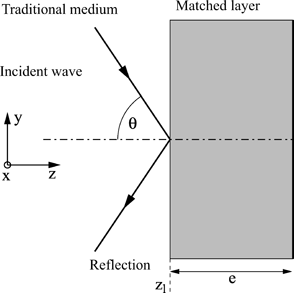
![]()
We now terminate the computation volume by using this type of layer (Figure 2.13). (Under normal incidence, a wave can penetrate the lossy layer of thickness “e” without reflection). For a wave under oblique incidence, we can calculate the apparent reflection coefficient (ARC), i.e. the reflection after a round-trip in the lossy layers:
[2.93] ![]()
assuming that the lossy layer is terminated by a perfectly conducting wall.
An adjustment in the value of coefficient ρ theoretically enables the desired absorption to be obtained. However, simulations show that a numerical reflection appears when a wave passes from one medium to another with different losses (different conductivities). This reflection is proportional to the ratio of the respective losses of each medium. In order to compensate for this disadvantage, the layer should be matched in such a way as to impose a profile describing a growing change in the losses. Thus, it is possible to minimize the effect of discontinuity at the interface, while preserving an apparently identical absorption. In this case the ARC is calculated as follows:
[2.94] ![]()
The wave is propagated in the Oz direction, with z1 being affixed to the interface. Finally, from the technical point of view, each layer (with a given loss value) is the thickness of one cell. Optimization of the layer therefore consists of choosing the depth and type of its conductivity profile for a given ARC.
However, the matched layer is limited in its application by the presence of evanescent modes. Indeed, for evanescent modes the layer is not matched and it is therefore necessary to position it sufficiently far from the discontinuities.
Theoretically, a wave arriving under any incidence over the PML layer does not produce any reflection, is not subject to any refraction and is attenuated during its propagation in the layer. In reality, however, the PML layer is subject to the same constraints as the matched layer. The layer must therefore be optimized in terms of depth and profile.
On the other hand, the PML layer is selective regarding the nature of the wave which will be attenuated. Indeed, propagative waves are absorbed into the layer while evanescent modes are not disturbed. They penetrate the layer, but no attenuation is added to their natural decrease. A supplementary phase term appears.
In their original formulation, PML layers must sometimes be very thick because of the presence of evanescent modes, which they must enable to be naturally attenuated.
In the following section, we propose studying the generalized PML, presented by Jiayuan Fang and Zhonghua Wu [FAN 96], using anisotropic and dispersive absorbing layers.
2.5.5. Anisotropic and dispersive layers
In this profile, we define new variables Sx, Sy and Sz. PML layers can be described in terms of an anisotropic, dispersive medium. It is then reduced to a “Maxwellian” medium, with unconventional permittivity and permeability tensors, as follows:

where:
![]()
For example, in the z direction:
![]()
The terms Sz0(z) and σz(z) are functions of z and must be selected in order to avoid numerical reflections (in theory, the higher the values, the faster the attenuation of fields in the PML layers).
Thus, in order to avoid numerical reflections, these parameters must continually increase as and when we advance through the PML layers.
The aim is to find a profile (a choice between Sz0(z) and σz(z)) which enables propagative and evanescent modes to be absorbed simultaneously.
A possible profile is as follows:
[2.96] ![]()
δ being the thickness of the PML layer.
The product Sz0(z) σz(z) gradually changes with space, which enables numerical reflections to be eliminated. It varies uniformly, like a parabolic function, across the whole PML layer region.
However, if the value of Sz0(z) is very high, then there is a risk of having numerical reflections at high frequencies. A necessary and sufficient condition to remedy this problem is to choose Sm such that ![]() , where λ is the shortest useful wavelength of fields within the computation volume.
, where λ is the shortest useful wavelength of fields within the computation volume.
The value of σm is determined from the apparent reflection coefficient (ARC). For example, for n = 2, the ARC is expressed as:
[2.98] ![]()
[2.99] ![]()
and the value of σm is chosen as follows:
[2.100] ![]()
As we can see in the expression ![]() , the implementation of Sz(z) is dependent on the frequency through the term jω.
, the implementation of Sz(z) is dependent on the frequency through the term jω.
See Chapter 4 for the use of the Z transform to handle the problem in the time domain.
2.5.6. Conclusion
Absorbing walls are a real problem when simulating open media. It is quite feasible to obtain reflection coefficients below –60 dB over the whole frequency band, but beyond this, instabilities may appear. We should note, however, that such values are largely sufficient for the great majority of problems.
2.6. Orthogonal curvilinear mesh [YOU 08]
2.6.1. 3D TLM curvilinear cell
The curvilinear node [YOU 08] can cover all regions and arbitrary variation in mesh size. The mesh is also equally flexible for complex physical forms. It is therefore advantageous compared with the Cartesian equations seen previously when boundary curves exist within the structure being simulated, which implies a mesh which is very fine in order to describe them.
Of course, curvilinear coordinates (u1, u2, u3) are used and the Maxwell equations are written using this coordinate system. They are integrated into a parallelepiped volume for which dimensions in the three directions are Δu1, Δu2and Δu3. Figure 2.14 shows the basic cell of the 3D curvilinear node.
The basic cell therefore consists of six curvilinear surfaces which can be grouped into pairs: surface u1 perpendicular to u1, surface u2 perpendicular to u2 and surface u3 perpendicular to u3.
The field components perpendicular to ui are referenced by the corresponding exponent i.

At the center of each surface, four tangential field components are defined, two electrical and two magnetic, hence the total of 12 components of each type in order to consider all possible polarizations. The numbering of voltage pulses is the same as that initially proposed by Johns for the SCN node, and, by convention, magnetic fields of the same number are located at the same central surface points, but perpendicular to the corresponding electrical fields.
The center of the cell will be defined as follows: in each of the three curvilinear coordinate directions (u1, u2, u3), the three curvilinear surfaces of symmetry of the cell intersect in pairs forming three central curvilinear curves, which in turn cross at a single point (barycenter), which is defined as being the center or node of the cell. Furthermore, the electrical field components, as well as those of the magnetic field at the center of the cell are necessary for the SCN node.
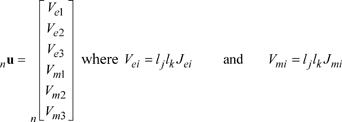
The ai incident voltage vectors and the ar reflected voltage vectors presented at the cell surfaces are given in [2.101].
Each vector consists of 18 voltages, the first 12 of which correspond to the node inputs and the last 6 to the voltages of stubs situated at the center of the cell.
[2.101] 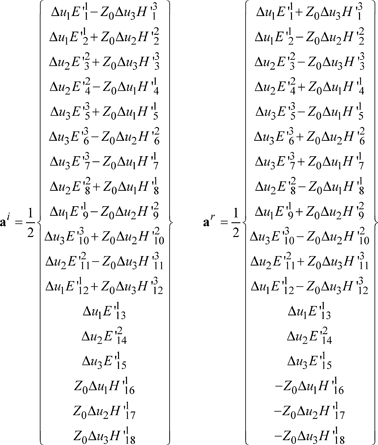
In curvilinear coordinate form, Maxwell’s integral equations are expressed as:
[2.102] ![]()
where:

2.6.2. The TLM algorithm
In order to develop the TLM algorithm from Maxwell’s equations in integral form, firstly six relations between incident voltages and the field at the center of the cell are obtained by integration of the equations for the three main curvilinear surfaces.
Figure 2.15. Contour and surface for approximating the Maxwell–Ampère law for the curvilinear surface surf-u1

Assuming constant field samples along each side, it is possible to approximate the flow of magnetic and electrical fields by integrating equation [2.102] over the time between (n−1/2)Δt and (n+1/2)Δt. From this we obtain:
[2.104] 
T is the backshift operator for a Δt.
In the above expression:

The flux ![]() is calculated based on an average of the field components at the surface edge, to which the contribution of the stub at the center is added.
is calculated based on an average of the field components at the surface edge, to which the contribution of the stub at the center is added.
[2.105] ![]()
in which ![]() is the normal admittance of the reactive branch (short-circuit stub) in the u1 direction, supporting voltage V13. Its value is given by:
is the normal admittance of the reactive branch (short-circuit stub) in the u1 direction, supporting voltage V13. Its value is given by: ![]() .
.
Taking into account [2.101], we finally obtain:
[2.106] ![]()
Repeating this process for the magnetic field flux and then for the other curvilinear surfaces [YOU 08] ultimately leads to the matrix form and to scattering matrices.
2.6.3. Scattering matrices for curvilinear nodes
The scattering matrix of the node [S] and the [Ss] matrix, which takes into account the fictive sources Je and Jm, enable the reflected and incident pulses to be linked at each iteration:
![]() ,
,
where:
The [S] matrix is given in Figure 2.16, where:
[2.107] 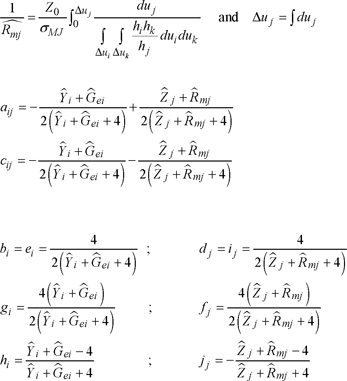
The [Ss] matrix is given in Figure 2.17, where:


Of course, in a volume without sources, the [Ss] matrix is useless.
2.6.4. Stability conditions and the time step
In order to ensure the stability of the process by keeping the time step at a maximum value, impedances must remain positive or null in value. This step is calculated for each set of blocks of similar properties. These conditions are written:
[2.108] 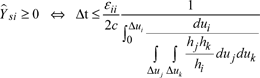

where (i,j, k) ∈ {(1, 2, 3), (2, 3, 1), (3, 1, 2)}.
2.6.5. Validation of the algorithm
Validation is performed on a cylindrical curvilinear mesh fitted with a coaxial resonator (Figure 2.18).
Figure 2.18. Coaxial resonator

The resonance frequencies are given by the formula ![]() .
.
The first three resonance modes are found by varying the height h of the cavity.

The errors committed are equivalent for the three modes. They do not exceed 1.5% when Δl/λ. is less than the generally accepted limit of 0.1. The results are therefore reasonable and the curvilinear node algorithm is validated.
This error over the resonance frequencies comes from the velocity error due to dispersion of the node. Youssef [YOU 08] studied the changes in the velocity error based on different strains which could be applied to the cylindrical cell. His conclusion was that dispersion remains generally low and remains perfectly adequate. He did, however, emphasize that this error is magnified when approaching singularity.
Finally, we note that the insertion of absorbing TLM walls is quite feasible with curvilinear nodes.
2.7. Non-Cartesian nodes
In all time-domain 3D methods, such as the TLM and FDTD, it is often assumed that the cell represents a volume delimited by a rectangular parallelepiped. Generally, users of such algorithms arrange for the structure that they are analyzing to correspond to this description. However, structures which do not include interfaces or slanted or curved boundaries are rare. In this case a stepped mesh must be adopted, which requires a mesh with a significant density, for a good-quality boundary description (i.e. providing highly precise results). Consequently, the rapid increase in computer costs (i.e. CPU time, as well as memory) often becomes prohibitive and prevents analysis, under acceptable conditions, of the device.
It is possible to develop a cell which is able to take this type of boundary into consideration, with a view to obtaining a sufficient level of precision without the need to refine the mesh. Historically, the first cells were developed in 2D. Initial testing on this subject was proposed by Al-Mukhtar and Sitch [ALM 81] and creative works in this direction have been conducted by Johns with a curvilinear cell [MEL 88], whose surfaces follow the benchmark. However, this cell is not entirely general, since it does not enable the meshing of any objects. A second 2D approach consists of creating a non-perpendicular cell (whose surfaces are always flat) from a formulation of the finite element method in the time domain [SIM 95]. However, these two approaches have never been extended to 3D in space. A significant contribution, called AS-TLM (Axi-Symmetric TLM) was recently produced by S. Le Maguer [LEM 01b], regarding the specific classification of structures with axial symmetry (cylindrical or coaxial wave guides, conic antennas) and no discontinuity. AS-TLM proposes a completely new arrangement of the TLM for this type of geometry, thus leading to a significant improvement in computation costs and reducing the size of the 3D SCN node problem (18 voltage components: 12 real and six stubs) to a 2D special AS-TLM node (14 voltage components: eight real and six stubs). In addition, perfectly matched layers which are appropriate to this type of problem have been developed.
Figure 2.20. Hein’s non-orthogonal node
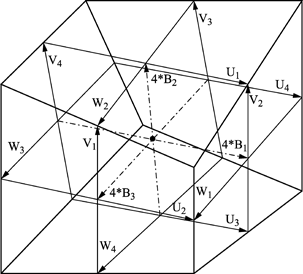
The last solution was finally proposed by Hein, who laid the mathematical foundations for a non-orthogonal 3D TLM algorithm [HEI 94]. This is naturally compatible with the traditional SCN-TLM node network, from where its formulation is derived [HEI 93]. It can thus be considered to be a generalization of the SCN node. Its interest is in the fact that it enables a local non-orthogonal mesh (Figure 2.20), which allows the use of the traditional algorithm over a large part of the computation domain.
A complete and detailed presentation on this algorithm has recently been implemented by Z. Li [LI 05]. This presentation additionally contains the algorithm, an analysis of the numerical dispersion of this node network, validations of this theory using several examples and a performance evaluation compared with the traditional mesh. A big advantage of this node is the potential to only use it locally, which enables a high level of precision to be obtained without also unduly increasing the computation time.