
7
Individuals and Society
The Industrial Revolution of the 19th Century contributed to the birth of modern advertising. The latter first takes the form of advertisements placed in a newspaper. Marking the entry of a part of the Western world into the consumer era, the term advertising takes on the meaning “of all the means used to make a product, an industrial or commercial company known to the public…”. From the end of the 19th Century, various artists, such as Czech painter Alphonse Mucha (1860–1939) contributed to the creation of advertising images (Figure 7.1).
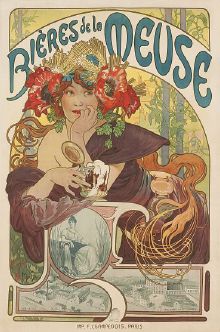
Figure 7.1. Bières de la Meuse, Alphonse Mucha, advertising poster, 1897, Bibliothèque nationale de France, Paris
(source: ©Agence photographique de la Réunion des Musées Nationaux et du Grand Palais)
Twentieth Century advertising made widespread use of posters and harnessed the power of television to give more weight to advertising campaigns. These gradually occupied a considerable amount of space – to the point of sometimes becoming invasive: “The human eye has never been strained so much in its entire history: it was calculated that between birth and the age of 18, everyone was exposed on average to 350,000 advertisements” [BEI 00].
7.1. Calculated choices
In the 21st Century, business and political marketing was being refined using digital techniques, while becoming an increasingly effective tool – something we have experienced with targeted ads received on the Internet or by other means. The French sociologist Dominique Cardon summarizes the way in which data are used: “Algorithms use the traces of our past to know our future…” [CAR 17]. Combining the study of our numerical traces with a statistical analysis of the data of millions of our peers, these algorithms acquire an effective predictive capability. Who was not surprised by the relevance of some of the suggestions made online by a commercial site?
The American journalist Charles Duhhig reports a concrete example [DUH 14]. Based on the statistical processing of consumer data, some data analysts have proposed a model to a supermarket chain that predicts with good reliability the major changes that occur in a household – for example, a future birth. A pregnant woman often unconsciously modifies her food purchases, for example, and the model detects this change. The commercial potential represented by the arrival of a child in a household makes the mother’s pregnancy an ideal period to offer future parents commercial offers by means of discount coupons for all the equipment they cannot do without. The father of a 17-year-old girl, reports Duhhig, was surprised and offended when his daughter received promotional offers that seemed obvious to him by mistake; he complained to the manager of a local store before having a conversation with his daughter and learning more about her hidden life…
The “digital traces” are in particular those left by our activity on the Internet [DUL 17]: videos viewed on YouTube, Google queries, purchases on Amazon, likes on Facebook to name only the most obvious. And these traces can help to build human behavior patterns useful for understanding their preferences, habits, personality and how they achieve certain choices (political, economic, etc.):
“Our findings highlight that people’s personality can be predicted automatically and without involving human social-cognitive skills […] The potential growth in both the sophistication of the computer models and the amount of the digital footprint might lead to computer models outperforming humans even more decisively” [YOU 15].
From the most innocuous to the most fundamental, our lives – and those of the community to which we belong – are made up of choices. According to Yuval Noha Harari, in their sometimes rational appearance, our choices are fundamentally guided by our feelings: “Ninety-nine percent of the decisions we make, including the most important choices about our spouse, our career and our home, are the result of refined algorithms that we call sensations, emotions and desires” [HAR 16]. Harari thus suggests that our feelings are in reality only calculations, and can therefore be accomplished by algorithms that will eventually become “better advice than our feelings…” [HAR 18].
As the Cold War divided the world into two camps, the American mathematician John Nash (Figure 7.2) became theoretically interested in the conditions that might or might not lead humans to cooperate.

Figure 7.2. John Nash (1928–2015)
COMMENT ON FIGURE 7.2.– John Nash’s work is considered one of the most brilliant intellectual contributions of the 20th Century: it has many applications in economics and many fields of mathematics, such as the study of partial differential equations. Part of Nash’s story is told in the film A Beautiful Mind [HOW 01]. Australian actor Russell Crowe plays the role of the mathematician and makes himself the medium of one of his obsessions: to put in equation a real win–win relationship between human beings, a formula that guarantees more harmony.
In 1951, he published the results of his reflections on non-cooperative games, giving a formal framework to the interest of players in making an optimal choice for them, while not knowing the choice of an opponent. These studies have applications in economics: they help to explain competitive or cooperative strategies.
The prisoners’ dilemma illustrates, while simplifying, part of his thinking. A crime has been committed and two suspects, let us call them Faye and Warren, are being arrested by the police, but they have no evidence to charge them. When questioned separately, Faye and Warren are proposed the following offer by the investigators: “If you report your accomplice and he or she does not report you, you will be released and the other will be sentenced to ten months in prison. If you denounce him or her, you will both serve five months in prison. If no one denounces himself or herself, this penalty will be one month in prison for both.” An analysis of this offer can be made in terms of gains/losses. It shows that the proposal is not zero-sum: there is a dilemma because the temptation (to denounce) offers an immediate reward that is stronger than cooperation.
| Faye can…. | |||
| …remain silent | …denounce Warren | ||
| Warren makes the decision to…. | …remain silent | −1/−1 | 10/0 |
| …denounce Faye | 0/10 | −5/−5 | |
Thus, based on a rational analysis, Faye and Warren are led to say to themselves: “Whatever the other’s choice, it is my interest to denounce him/her.” They will probably realize it, whereas this choice is not optimal: by cooperating (by keeping quiet) they both get away with it, with less pain. It should be noted that, in reality, Faye (Dunaway) and Warren (Beatty) do collaborate, for our greatest cinematic pleasure, by bringing Bonnie and Clyde to life [PEN 67].
The choice to cooperate can only arise from a reflection that brings out the common interest and from a trust in each other. This model, which some use to justify an organization of the economic world such as everyone’s war against everyone (and explain the tendency not to cooperate), can also be valuable in giving substance to the win–win option that can emerge from an external analysis of the situation. The prisoners’ dilemma suggests that optimal collective choice is possible beyond the optimal of each other – in other words that cooperation is perhaps also the profound nature of the living [DIA 12, SER 17b, WRI 99].
Understanding individuals or societies using data helps to predict individual or collective choices. Collective investment policy, enterprise development strategy, evaluation of public services, development of commercial offers, operation of networks and infrastructures, regulation of community life: the uses of these models are varied. Based on the knowledge of individuals, made possible by statistical analysis and other means, they contribute to decision-making for the benefit of communities, companies, associations and their respective members. This chapter provides some examples of models that can be applied to certain social issues or contribute to personal or collective decision-making1.
7.2. A question of style
Created in 1892 by the will of the French writer Edmond Goncourt (1822–1896), the literary prize bearing his name is awarded every year in France. Since its first award in 1902 to French-speaking authors, it has helped to promote many writers and major literary works. In 1956, the French writer Romain Gary (1914–1980) received this award for his work Les racines du ciel [GAR 56], and a few years later in 1975, the jurors of the Goncourt Academy awarded the same prize to an unknown author, Émile Ajar, for his novel La vie devant soi [AJA 75]. After Gary’s death, we discover that Ajar was a pseudonym he used to publish other novels and try to renew his style. Organized by the writer with the complicity of his cousin, this literary deception makes Gary the only novelist to have received the Goncourt Prize twice. Publishing about 20 works under his name and almost as many under the pseudonym Ajar, Romain Gary poses an enigma to literary specialists: is it possible for an author to adopt two different styles, to develop two independent literary works and not to be unmasked? Romain Gary himself seems to doubt it. The French researcher Dominique Labbé, specialist in semantic analysis, reports these words from the writer:
“I don’t think there is any possibility of ‘duplication’. The roots of the works are too deep, and their ramifications, when they appear varied and very different from each other, cannot withstand a real examination and what was once called ‘the analysis of texts’…” [GAR 81].
The analysis Gary refers to is the art of literature connoisseurs: the texts and context of a work, style and life of an author are part of their reading grid. At a time when Gary/Ajar were publishing their works, other study tools are also available:
“By the late 1970s, computers already had respectable power and the intellectual tools necessary to ‘unmask’ Ajar were potentially available. Yet no one has thought of using ‘lexical statistics’ to solve this enigma, including researchers” [LAB 08].
Lexical statistics are based on different tools, one of which is the observation of certain characteristic combinations of words. The analysis of the most frequent “repeated phrases” is, from the point of view of author attribution issues, one of the most effective ways:
“A phrase is a stable combination of several terms that each individual chooses in a privileged way and that indicates a certain relationship to oneself, to others and to things. The subject may view these relationships in terms of action (e.g. ‘doing’, ‘going’, ‘saying’), possibility (e.g. ‘enabling’, ‘allowing’, ‘letting’), will (e.g. ‘choosing’, ‘deciding’, ‘wanting’), moral or legal obligation (e.g. ‘duty’), imperative (e.g. ‘must’), knowledge (e.g. ‘experiencing’, ‘knowing’, ‘learning’).”
A dedicated algorithm allows these combinations to be found in written texts: the frequency of phrases is therefore a trace of an author’s style. The analysis of nine novels by Gary/Ajar shows their stylistic proximity according to this criterion (Table 7.2).
Table 7.2. “Repeated phrases” in four works by Émile Ajar and five by Romain Gary [LAB 08]
| Texts signed by Emil Ajar | Texts signed by Romain Gary |
| means 7.20 | means 5.80 |
| be able to be 4.90 | be able to be 3.62 |
| be able to do 4.40 | be able to do 2.97 |
| have to be 3.10 | to be 2.39 |
| go for 2.90 | to go to the 2.20 |
| to be able to live 2,70 | to have 2.13 |
| drop out 2.30 | to be able to say 2.13 |
| to have 2,10 | drop out 1.87 |
| go see 2,00 | let go 1.55 |
| to have to do 1.80 | push 1.49 |
COMMENT ON TABLE 7.2.– The table presents the first 10 “repeated phrases”, as identified by an algorithm, in works by Émile Ajar and Romain Gary. Considering only the first 20 combinations, Dominique Labbé, who carried out the analysis, finds that the texts signed Gary and Ajar share 13 of them, the first five being in the same hierarchical order and with practically the same relative frequencies. Given the immense diversity of possible word combinations, it is very unlikely, if not impossible, to encounter two individuals with the same preferences for several specific combinations, in approximately the same order and with similar densities. According to the researcher, this analysis therefore makes it possible to show that Romain Gary is indeed the author who hides behind the pseudonym of Émile Ajar! However, he adds: “For the time being, almost all researchers are convinced that computers cannot help to recognize the author of a single text; a fortiori the genre or personality of its author is out of reach.”
In the 21st Century, data processing algorithms were reaching an efficiency and precision that allowed some researchers to extend this analytical work, in order to attribute a work to an author, to understand the style of a great master of painting, or even to perform an automatic personality analysis.
7.2.1. Assigning a work to its author
John Lennon (1940–1980) and Paul McCartney (1942–), who together wrote most of the Beatles’ songs, bequeathed to popular culture some of the most famous musical compositions of the last century. Everyone can associate an emotion or a memory with one of the Fab Four’s pieces, whose lyrics and/or melody, although attributed to Lennon and McCartney, are actually designed by one or the other. For some connoisseurs of their music or lovers of their texts, attributing the first or second to its author remains a matter of precision, or a matter of justice! In My Life (Figure 7.3) is, for example, one of the Beatles’ songs for which there is still some doubt about this attribution.
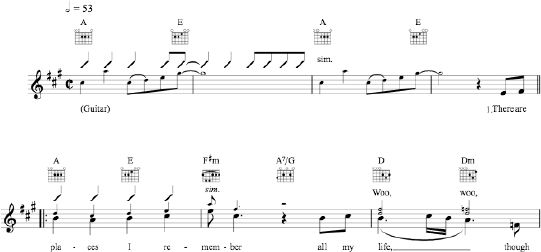
Figure 7.3. First measure of music of In My Life (represented as a tablature for guitar)
COMMENT ON FIGURE 7.3.– Ranked 23rd in 2003 in Rolling Stones magazine’s list of the 500 greatest songs, In My Life was released by the Beatles on December 3, 1965 on the Rubber Soul album. It has been taken up by many performers of very different styles – that of the American Johnny Cash (1932–2003) being undoubtedly one of the most poignant. In this song, John Lennon evokes a search for lost time, recalling those he met, in which places, under which circumstances: “There are places I’ll remember // All my life, though some have changed // Some forever, not for better //Some have gone and some remain //All these places have their moments // With lovers and friends I still can recall // Some are dead and some are living // In my life, I’ve loved them all”. A passage to the piano, of baroque inspiration, was arranged by George Martin (1926–2016), the Beatles’ producer. It contributes to the nostalgic atmosphere of the piece. In My Life is one of the very few songs for which the level of collaboration between John Lennon and Paul McCartney has been disputed since the Beatles split in 1970.
In 2018, three North American researchers used data analysis techniques to find in the songs by Lennon and McCartney characteristics of each other’s musical styles. They use techniques similar to those of lexical analysis, as mentioned above, applied to the musical context:
“For Lennon-McCartney songs of known and unknown authorship written and recorded over the period 1962–1966, we constructed five different bags-of-words representations of each song or song portion: unigrams of melodic notes, unigrams of chords, bigrams of melodic note pairs, bigrams of chord changes, and four-note melody contours. We developed a (statistical) model for dependent bags-of-words representations for classification. The model assumes correlated multinomial counts for the bags-of-words as a function of authorship. Out-of-sample classification accuracy for songs with known authorship was 80%. We demonstrate the results to songs during the study period with unknown authorship” [GLI 18].
In a conference dedicated to statistical analysis, they present the results of a study that allows them to attribute with certainty the authorship of the melody of In My Life to John Lennon.
7.2.2. Understanding a pictorial technique
With regard to the French painter Edgar Degas (1834–1917), Paul Valery wrote these notes on the painter’s work (they can be found in his notebooks where handwritten texts are combined with sketches and mathematical formulas):
“A work for Degas is the result of an indefinite amount of studies; and then a series of operations. I believe that he believed that a work can never be ‘completed’” [Exhibition “Degas, Danse, Dessin”, Musée d’Orsay, Paris, November 28, 2017–February 25, 2018].
For most of his paintings, Degas carried out a large number of drawn studies; rendering of expressions, draperies, light, poses, details: data prior to the production of a work. An approach and work shared by many artists, and by digital engineers. Graphic techniques, such as painting, may be reproduced today by simulation. In 2016, a team of researchers, computer scientists and art specialists from the University of Delft, thus carried out an experiment presented as unique and spectacular: that of entrusting an algorithm with the task of creating an unpublished work, inspired by the Dutch painter Rembrandt van Rijn (1606–1669), master of the chiaroscuro technique.
Based on detailed data on Rembrandt’s paintings (subjects, shape of facial elements, lighting, materials used – canvases and pigments), a master’s style painting was designed using algorithms for data acquisition, analysis and management, learning and 3D printing techniques. The project is told by its authors on the website www.thenextrembrandt.com. No robot or computer with extraordinary capabilities has shown creativity and sensitivity, in the sense that we can understand it for a human artist, to create this painting (Figure 7.4).

Figure 7.4. The Next Rembrandt, a table designed with digital techniques
(source: www.thenextrembrandt.com)
Everyone will be able to compare The Next Rembrandt with the original works that inspired the machine and the humans who programmed it – such as The Union of the Drapery Guild (1662) – and get an idea of its aesthetic quality. Let us read how the authors of the experiment proceeded by imitating Rembrandt’s style using the computer:
“To master his style, we designed a software system that could understand Rembrandt based on his use of geometry, composition, and painting materials. A facial recognition algorithm identified and classified the most typical geometric patterns used by Rembrandt to paint human features. It then used the learned principles to replicate the style and generate new facial features for our painting” [www.thenextrembrandt.com].
The techniques developed in this project make it possible to understand the style of a painter, this mixture of technique and sensitivity explaining his singularity, by means of experiments allowed by a numerical simulation. We can also to some extent look at this project as a numerical experiment based on information other than equations: on data. It shows that numerical simulation is based on other techniques and testifies to the power offered by those of algorithmic learning, implemented for example with specific techniques by programs that have been able to beat humans at different games (Chapter 4 of the first volume) and shape recognition [BLA 17].
7.2.3. Discovering a personality type
The description of human personality and the study of human behavior may also be old – and in some respects more complex – than mathematics. In a text that has been the work of a lifetime, the French moralist Jean de La Bruyère (1645–1696) offers written portraits of his contemporaries, those of the century of Louis XIV. He thus distinguishes among his fellow human beings supposedly universal archetypes [BRU 88]. The ambition to map characters and tell the story of human comedy is constantly renewed by literature, cinema and, in the 21st Century, by television series.
Psychology develops models based on a classification into central character traits that provide a benchmark for the theoretical study of personality. Some psychologists consider that five factors would be sufficient to describe it, using the so-called “OCEAN model” [GOL 93], which some researchers use, for example, to simulate crowd behavior [ALL 08]. According to this model, the dimensions of personality are “Openness” (marked by imagination, intellectual curiosity and the desire for new experiences), “Consciousness” (corresponding to the need for success and involvement in work), “Extroversion” (expressed as a tendency to externalize or act), “Agreeableness” (observed in the willingness to help and trust others) and “Neuroticism” (characterized by emotional instability and a tendency to anxiety or irritability, for example). As a result of observation, the OCEAN model is based, among other things, on a statistical analysis of the vocabulary that participants in behavioral studies use to talk about themselves or others – as the French poet René Char (1907–1988) put it: “The words that will emerge know about us things that we do not know about them” [CHA 77]. Do algorithms know how to discover it better than we do [BACK 18, YAR 10]? If the answer remains difficult to state with certainty today, some researchers are convinced of it: “Recent developments in machine learning and statistics show that computer models are also capable of making valid personality judgements by using digital records of human behavior” [YOU 15].
The approach of establishing character traits, which is partly revealed by semantics, aims to describe the characteristics of an individual and to predict his or her behavior in certain situations. It is used for research purposes in behavioral psychology and is used in other fields of the social sciences. Personality models are among the rational elements of a broader theory of mind. They are a tool that psychologists can use, for healing purposes, in a supportive and collaborative relationship. They are also used for other objectives, such as marketing and recruitment.
Thus, some are based on presented algorithms that are able to grasp the meaning of a text. Let us illustrate our point with a concrete example: an improved version of the personality tests offered by various magazines or online sites. Based on a written document (text, letter, blog article, or even speech or interview), an application developed by IBM aims to define individuals’ personality traits (and their probable corresponding commercial behavior). It provides a systematic analysis based on algorithmic learning techniques. It is able to analyze the implicit content of a text in human language using criteria from the OCEAN model. This way of drawing psychological profiles is in some respects crude and incomplete. Our personality and behavior are indeed complex and are as much the result of our intimate nature, our education, as they are of our life experiences – a set of factors that a model or algorithm cannot yet fully account for. However, some psychological studies suggest its relevance and social science researchers argue that the model is robust enough to be used for predictive purposes, for example, in marketing or human resources, to assess client satisfaction or to develop a personality profile of a candidate for a position [ADA 18, ANA 18, MAC 18, REN 12].
Thus, this type of modeling is implemented using analytical tools to which data processing techniques give a new dimension2. Let us do an experiment with Martin Luther King’s well-known text, I Have a Dream. In just a few seconds, the application produces a personality synthesis in these terms and provides a visual analysis (Figure 7.5). Despite its stereotypical nature, we can find in this description personality traits that are consistent with the overall image we have of a man like Martin Luther King3.
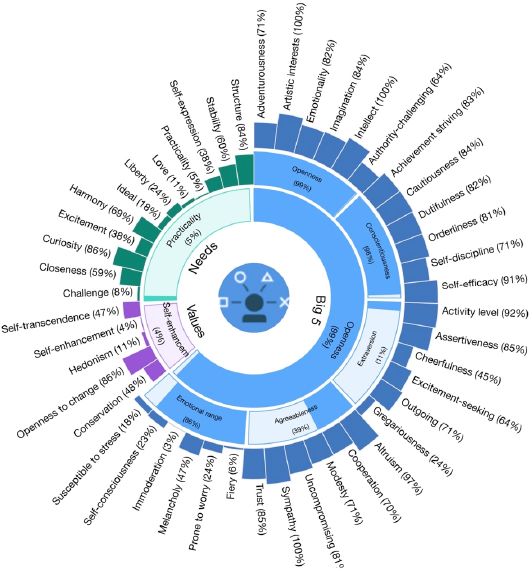
Figure 7.5. An automatic analysis of personality traits. For a color version of this figure, see www.iste.co.uk/sigrist/simulation2.zip
COMMENT ON FIGURE 7.5.– This graphical representation of an automated personality analysis is obtained with the Personality Insight application, developed by IBM (source: https://personality-insights-demo.ng.bluemix.net). It is based on the analysis of the speech delivered by Martin Luther King in 1963, in Washington (source: http://lesgrandsdiscours.arte.tv). The analysis is supplemented with the following comment, automatically derived by the application: “You are analytical, restrained and guarded. You are appreciative of art: you enjoy beauty and seek out creative experiences. You are empathetic: you feel what others feel and are compassionate towards them. And you are philosophical: you are open to and intrigued by new ideas and love to explore them. Your choices are driven by a desire for discovery. You are relatively unconcerned with both achieving success and taking pleasure in life. You make decisions with little regard for how they show off your talents. And you prefer activities with a purpose greater than just personal enjoyment. You are likely to like historical movies, volunteer for social causes, like classical music. You are unlikely to be influenced by social media during product purchases, prefer style when buying clothes, be influenced by brand name when making product purchases” (https://personality-insights-demo.ng.bluemix.net).
Let us remember beyond the anecdote that analysis is produced on the basis of a text and that its only purpose is to draw broad personality lines, which is the objective sought. The tool benefits from different contributions in the social sciences (linguistics, psychology, etc.), coupled with the analysis of massive data. Like psychoanalysts who are interested in the words we use and the associations of ideas they suggest, these algorithms wish to correlate our words with other data and discover aspects of our personality – some of which we would ignore.
7.3. The shape of a city
“The shape of a city changes faster, as we know, than the hearts of mortals”: it is with these words, borrowed from Charles Baudelaire, that the French writer Julien Gracq (1910–2007) begins words in a novel in which he explores his residential school years in the city of Nantes [GRA 85]. He finds in his memories the material of the imagination from which he explores the reality of an urban realm. A mentally reconstructed portrait of a city and its inhabitants whose activities he observes and comments on. Twenty years after Gracq, children created a subjective map of Nantes that proposed their perception of the city (Figure 7.8).

Figure 7.8. Subjective map of the city of Nantes (source: http://www.geographiesubjective.org). For a color version of this figure, see www.iste.co.uk/sigrist/simulation2.zip
7.3.1. Transport
Urban areas are changing as a result of investments made by companies and communities, the behavior of users of networks and means of transport, innovations from research or industry. The social and environmental challenges, as well as the technical challenges of new urban mobility will sculpt the shape of a city in the 21st Century. How? Traffic flows, economic or health statistics, quality of life at work and user testimonies all contribute to analyzing the mobility choices of the inhabitants of a territory. The data allow a diagnosis to be made of road network congestion and help to propose solutions that can be applied at different scales. From the application available on smartphones indicating traffic conditions to investment decisions contributing to spatial planning, their uses are varied.
Innovations in transport are rising (shared car service): simulation makes it possible, for example, to simulate the impact of a new decision or offer before testing it in the field. Reza Vosooghi, researcher at IRT System-X in the field of mobility, explains the principles:
“Some simulations concerning urban transport are based on ‘multi-agent’ models. This is the most recent approach applied in this field and is suitable for studying new travel services, such as Robot-Taxi, on-demand or shared mobility services. These simulations require detailed data on travelers (sociodemographic or socio-professional) and on the urban areas studied (mapping of roads, transport networks or cycle paths, etc.). The information used by such a simulation in France has various origins. In France, they come from INSEE, the ‘Enquête Ménage Déplacement’ (EMD), or the ‘Mode d’Occupation du Sol’ (MOS). The simulation is based on an ‘artificial population’ whose activities (work, leisure, etc.) are reported as accurately as possible…”
The simulation represents modes of travel and trips associated with activities performed by each agent during the day (Figure 7.9). It is based on an algorithm that iteratively seeks to satisfy the mobility needs of all modeled agents over a given period of time.
“For example, we carried out a complete simulation of the Île de France transport network. With 12 million agents represented, which is the actual population of this region, the simulation requires nearly a month of calculation! Reducing computation times is a global challenge for the simulation of large cities and part of our research work consists in developing more efficient methods… Many simulations nowadays use an open source tool, developed in a collaborative way by researchers interested in transport or logistics. The cumulative contributions of each of them to the development of the tool represent more than 30 years of work!”

Figure 7.9. Mobility simulation in the defense district. For a color version of this figure, see www.iste.co.uk/sigrist/simulation2.zip
COMMENT ON FIGURE 7.9.– The model is implemented with the so-called MATSim simulation tool. It makes it possible to visualize the likely mobility choices of a group of inhabitants. The colored dots represent an artificial population, classified into different socioprofessional categories: employed or not, male or female, staying at home or not, student, etc. (source: Reza Vosooghi, IRT System-X).
With the data, researchers can evaluate the choices of users of new vehicle services [VOS 19] or anticipate changes in transport networks and means, in order to make large urban areas a shared and peaceful space. A shape of the city in which the human being is the center? Researchers working on shared mobility modes are heading toward this goal. Develop transport solutions that help reduce the number of vehicles in the city and the energy required to build and use them.
7.3.2. Sound atmosphere
In his novel, Julien Gracq recalls his first encounter with the city of Nantes. His perceptions have left an indelible mark on him and the writer refers in particular to the city’s sound atmosphere, made up of acoustic traces of human activities:
“This was during the years of the 1914-18 war; the tramway, the soap factory, the glorious, majestic parade of the train through the streets, which seemed to miss only the hurdle of acclaim, are the first memory I kept of Nantes. If there is a darker shade at intervals, it is due to the height of the buildings, the surrounding streets, which surprised me; in total, what is left over from this fleeting contact is – rising from its sound, shady and watered streets, from the joy of their agitation, from the crowded coffee terraces of summer, refreshed like a mist by the smell of lemon, strawberry and grenadine, breathed in as you pass by, in this city where the diapason of life was no longer the same, and since then, unforgettable – an unknown, unusual and modern perfume” [GRA 85].
The noise environment is nowadays the focus of public authorities and citizens, in particular because of the health consequences of noise to which city dwellers or people living near industrial installations (airports, stations, factories, wind turbines, etc.) are exposed. Cognitive loss, sleep disorders, stress, cardiovascular risks, etc. Noise conditions our quality of life and in some cases, it can cause extreme suffering. In France, for example, the societal cost of noise pollution is estimated at more than 57 billion euros per year [EY 16], including more than 16 billion for the Île de France. A regulatory corpus is being developed to anticipate risks, protect and inform citizens exposed to noise. For example, a European directive covers the assessment and management of environmental noise:
“As a complement to the abundant Community legislation on noise sources, the European Directive 2002/49/EC, promulgated on 25 June 2002 in the Environment Code, specifies, for large urban areas and major transport infrastructures, the production of so-called ‘strategic’ noise maps. The directive aims to establish a harmonized assessment, in the 25 European States, of environmental noise exposure by means of noise maps. This directive also helps to prevent and reduce excessive noise through action plans, protect quiet areas and ensure that public information and participation are at the heart of the process” [www.bruit.fr].
Noise maps (Figure 7.10) are thus drawn up for European cities with more than 100,000 inhabitants using numerical simulations based on physical models and the use of environmental data (built, ground, road traffic, industrial, air traffic, etc.). The latter constitute the input data of these models and are subject to some uncertainties, which are not without consequence on the assessment of the simulation results, mostly operated using engineering software.

Figure 7.10. Road noise map of the city of Nantes (source: IFSTTAR/CEREMA). For a color version of this figure, see www.iste.co.uk/sigrist/simulation2.zip
COMMENT ON FIGURE 7.10.– Noise maps, available on the Internet, are diagnoses of the noise exposure of populations over a wide area for a given noise source (road, rail, industrial or air noise). French regulations provide for noise maps to be produced according to the types of sources and periods of the day, with noise thresholds translated into quantitative terms. The road noise map of the city of Nantes presented here is obtained with “simplified modeling”. The covered area represents 65 million m2, it contains 1.7 million calculation points and 346 million source points. The simulation is obtained in just above 1 hour of calculation.
Benoît Gauvreau and Gwenaël Guillaume, researchers in environmental acoustics at IFSTTAR* and CERAMA* [GAU 15, GUI 09], explain the stakes of the calculations:
“Acoustic simulations are based on three main elements: knowledge and characterization of sound sources, sound wave propagation models and criteria for analyzing calculation results (indicators, maps). Human and animal activities (conversations, songs, etc.), transport (cars, trams, subways, planes, etc.) or industrial installations (factories, wind turbines, heat pumps, etc.): there are many sources of noise in the environment. Each has its own characteristics, in terms of duration, level, stationarity or directivity, and covers a certain frequency range. The accessible data make it possible to model more or less accurately some of the various noise sources present in our environment (road, rail, air, industrial traffic).”
The propagation of sound waves obeys multiple physical mechanisms, such as their reflection or absorption on surfaces (vertical or horizontal), their diffraction on the edges of obstacles, their refraction by the propagation medium (atmosphere).
“These effects are taken into account more or less advanced mathematical models and numerical methods, offering a more or less detailed description of the physical phenomena involved. So-called ‘reference models’ are developed in the time or frequency domain. They may be coupled with each other or even with other models, for example with sound source models and/or atmospheric dynamics models at different scales.”
Simulations are used to represent noise sources and to evaluate sound propagation in spatial areas and at given time or frequency intervals. The use of calculation data raises many questions, in particular about the analysis criteria to be used:
“Modeling gives access to the level of pressure in the air. This ‘gross’ physical quantity must be interpreted in order to reflect a level of risk or acoustic comfort in the environment. Several treatments are possible: retain a maximum value or an average value in time, in space, associate a number or a duration of exceeding a threshold, etc. The current regulations, for example, translate the sound level in terms of frequency-weighted sound pressure: they thus reflect the human ear’s perception of sound. Research in environmental acoustics allows us to explore other criteria. With fine modeling, it is possible, for example, to evaluate other indicators such as the reverberation time of waves: the speed with which they fade can be an analytical criterion that complements that of their level.”
Simulations are based on “detailed modeling” or “simplified modeling”:
- – the former take into account the geometric complexities of the propagation medium and the majority of physical phenomena influencing sound propagation in spaces constrained in terms of spatial extent (street, microdistrict). They therefore require significant computing resources;
- – the latter, using approximate models, allows global data to be obtained more quickly, on larger spatial and temporal scales. These are used, for example, to map noise (road, rail, air, industrial) over a city.
“Reference models” take into account many physical phenomena and represent them in a detailed way. The propagation of sound waves in the air depends on temperature, wind and humidity, so the finest models integrate meteorological data and their evolution in time and space.
Since the reflection, diffraction or absorption of sound waves is influenced by many elements of the urban environment, the most accurate models take into account the presence of protective screens, vegetation [GUI 15] or architectural ornamentation, and thus reflect their influence on sound propagation (Figure 7.11).

Figure 7.11. Acoustic propagation simulations with “detailed modeling”. For a color version of this figure, see www.iste.co.uk/sigrist/simulation2.zip
COMMENT ON FIGURE 7.11.– The figures provide results of acoustic simulations and represent the pressure field on very short time scales. The latter is obtained using calculations made by means of “detailed modeling”. They account for the main physical phenomena involved in the propagation of sound waves, such as reflection and diffraction by a building with a straight screen (top) and absorption by green facades in a street (bottom). In the first example, the simulation allows to compare different architectural choices (presence of the screen and influence of its shape, presence of absorbent surfaces and influence of their characteristics). In the second example, the calculation represents the sound pressure levels in the street, without (left) and with (right) vegetated facades. It highlights the positive influence of plants on noise reduction in the street for this configuration. Noise levels are represented in color, from red (louder) to blue (quieter). Research on this subject was carried out by IFSTTAR between 2010 and 2014, as part of the “VegDUD” project4. This multidisciplinary collaborative project addresses the influence of plants in sustainable urban development through an approach that combines issues related to climatology, hydrology, energy and environmental management. It makes it possible to quantify the influence of alternative practices for collective and private spaces on their acoustic atmosphere, in particular through classical physical indicators such as sound levels and reverberation times (source: IFSTTAR).
The three main fields, source characterization, propagation modeling and perception analysis, of environmental acoustics are the subject of continuous research, helping to evaluate and propose effective solutions to the challenges of noise control and reduction. Involving multidisciplinary teams and often carried out in a collaborative context (combining physical and engineering sciences and the humanities and social sciences), this research benefits the entire community and contributes to the development of public policies.
7.3.3. Businesses
The location of urban businesses also influences the shape of a city and the lifestyles of its inhabitants, such as the prosperity of merchants. Are there privileged locations in a city for a given business? Is the proximity of one store favorable or unfavorable to another? Is it possible to account for an attraction or repulsion of one trade with another in the same way as Coulomb’s law in electrostatics? (Figure 7.12).
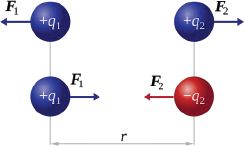
Figure 7.12. The electrostatic force is attractive or repellent depending on the sign of charges carried by two particles
(source: www.commons.wikimedia.org)
COMMENT ON FIGURE 7.12.– Established at the end of the 17th Century by the French physicist Charles-Augustin Coulomb (1736–1806), the law bearing his name forms the basis of electrostatics. Expressing the force of the electrical interaction between two electrically charged particles, it is written as:
where q1 and q2 is the charge carried by two particles, F is the electrostatic force exerted by one on the other, r is the distance between them, ε0 is the permitivity of the void and u is an arrow carried by the line connecting the two particles. Coulomb’s law may be stated as follows: “The intensity of the electrostatic force between two electrical charges is proportional to the product of the two charges and is inversely proportional to the square of the distance between the two charges. The force is carried by the line passing through both loads.”
Pablo Jensen, a physicist at the École Nationale Supérieure de Lyon, has developed a model that reflects the attractiveness of a location for a given type of business [JEN 06]:
“The modeling principle I proposed is based on the analysis of data showing the distribution of businesses in the city of Lyon and identifying locations that are favorable and unfavorable to one type of business or another. The proposed approach uses a calculation formula adapted from physics to social systems. It consists schematically in comparing the actual distance between the shops, classified by given categories, and the distances resulting from a random distribution of these shops throughout the city. This makes it possible to calculate the ‘attraction’ and ‘repulsion’ coefficients of the businesses between them. For example, calculations show that at a distance of 150 meters from a bakery, there are twice as many bakeries and twice as many butchers: bakeries repel bakeries but attract butchers…”
The analysis of data prioritizing and categorizing the types of businesses for the entire city makes it possible to build a table archiving all the attraction or repulsion coefficients. By quantifying the influence of businesses on each other, they make it possible to map out the location areas that are favorable to the opening of a particular store (Figure 7.13).
As with many data processing algorithms, the proposed approach seeks to predict without explaining – no equation, similar to that expressing Coulomb’s law, reflecting the attractiveness of the businesses between them:
“The figures that measure these spatial structures do not seek to understand their origin. They transform the reality of the field into quantitative information, in an attempt to answer important questions for traders and planners […]. This approach is not intended to explain: it proposes an original interpretation of existing location data and draws predictions from it. Its logic is simple: a good location to open a new store is a location that resembles those where other stores of its kind are located…” [JEN 18].

Figure 7.13. The best places to open a bakery in Lyon (source: Pablo Jensen, École Normale Supérieure de Lyon). For a color version of this figure, see www.iste.co.uk/sigrist/simulation2.zip
COMMENT ON FIGURE 7.13.– Based on data on the location of shops in the city of Lyon in 2003, a model predicts the best 10% locations to open a bakery. The areas concerned are identified in red on the city map: few of its places already have a bakery – these are identified by black dots.
7.4. A question of choice
American biologist Thomas Seeley has spent much of his scientific life studying bees [SEE 10]. For example, he explains how an insect community organizes itself to make decisions that affect its survival: fetch food and find another place to live when the one it occupies is no longer suitable. While each of its members has only fragmentary information on a given situation, a swarm, a community, is able to make a decision that is relevant to everyone’s destiny. According to Yuval Noah Harari, it is even this very advantage that humans have exploited: “What has made us […] the masters of the planet is not our individual rationality, but our unparalleled ability to think together in large groups (when individuals) know terribly little about the world” [HAR 18].

Figure 7.14. A swarm of bees
(source: www.shutterstock)
COMMENT ON FIGURE 7.14.– With more than 1 million described and currently existing species, insects constitute the largest share of animal biodiversity. The study of insect societies (ants, bees, termites) contributes to the development of individual and collective behavioral models [JEN 18]. Some research, such as that reported by biologist Thomas Seeley on bees, testifies to the fact that animals together produce optimal organizational modes from which we can learn and some of which are used, for example, to produce data processing algorithms. It should be noted that the scientific community is concerned about the possible disappearance of bees, particularly because of their poisoning by certain pesticides [ARC 18]. Impaired learning, orientation and navigation skills: the consequences of this exposure are multiple. They also threaten the pollination role played by bees, which is essential to many ecosystems.
From his observations, Seeley shows how a form of order emerges from chaos and how a group of individuals may make an optimal decision. It also highlights how this decision is reached through interactions between different members of the community and how the energy of a group to defend an option can change the final choice, a form of democratic process. This is part of this researcher’s thesis. Without inviting us to adhere to the myth of an organization as “perfect” as a swarm and to defend the illusion of reproducing its functioning for human communities, the researcher however suggests, based on his observations, that an optimal decision is generally based on:
- – a diversity of knowledge about possible options;
- – a sincere and honest sharing of information on possible options;
- – independence in the evaluation of options by everyone;
- – a confrontation of everyone’s opinions on these different options;
- – leadership that encourages discussion, without the intention of dominating it.
These principles are in part what some citizens expect from a genuine democratic process and Seeley claims to apply them to decisions concerning the life of his laboratory (recruitment of a researcher, promotion of another, response to a call for projects, etc.).
Rich in some lessons from the mechanics of hives, let us now move on to the mechanics of the Web, while keeping in mind the question of the choices of societies. With social networks and the mass of data they convey [AME 17], it is possible to observe, in the manner of an entomologist, how certain political communities are structured. Noé Gaumont, a young computer researcher studying the structure of dynamic networks [GAU 16], explains:
“An increasing amount of data is available to researchers to study and model animal or human societies. I am interested in graph analysis algorithms, which make it possible to detect ‘communities’ (political, religious, scientific, sports, etc.) within sets of relationships. A community is characterized by a set of nodes that are strongly connected to each other and weakly connected to the network within which it operates.”
The study of graphs is a specific branch of mathematics, initiated in the 18th Century when Leonard Euler proposed a mathematical solution of the problem of the “seven Königsberg bridges”. From a given point in the city, it is a question of finding a walk that brings you back to that point by passing once and only once through each of the seven bridges in the city of Königsberg. The problem turns out to be that there is no solution. In order to show this result, Euler reasoned in the absurd, using a graph to represent the desired walk and reach an impossibility. A graph G = (V, E) consists of a set of points (V) and a set of links (E) between these points. It can be represented by a matrix M whose component mij is 1 when the nodes Vi and Vj are linked and 0 if not. Matrix algebra thus provides a formal framework for the study of graphs, which model complex systems:
“The matrix description makes it possible to represent a graph statically, but not to account for their dynamics. My research has thus contributed to the development of a new matrix representation of graphs, integrating their evolution over time – discretely (at given times) or continuously (over a time interval).”
This work, which is essentially theoretical, has found practical applications, particularly in the context of the 20175 French presidential election campaign. They have helped to highlight how certain communities are structured on the Internet, around political themes and issues.
“We analyzed the data from the Twitter network to understand the dynamics of the 2017 French presidential campaign and to visualize how political communities are structured over time. We followed the publications of some 3,500 politicians (elected officials, party members, etc.) and the reactions they generated among other users of the network (retweet, quotation, response, etc.). Out of 2,500,000 accounts interacting with these personalities, we have selected 200,000 accounts to establish a fairly clear political affiliation with a particular candidate for election. This small panel is then used for our analyses of the dynamics of political communities on a social network.”
A social network on the Internet lends itself quite naturally to a mathematical description according to graph theory. Each account being a node, the challenge of the mathematical representation of the network is to find a relationship between the nodes:
“The criteria leading to the identification of a relationship between nodes are numerous. In our model, we chose to connect two nodes when the first node relayed at least three tweets from the second node over a two-week period. We describe a graph dynamically and then use a ‘community detection’ algorithm. This is obtained by partitioning the nodes in the graph according to the following principle: ‘each node in the community belongs to a single community and is more strongly connected to this community than to the rest of the network’. Assuming that this identified community is a ‘political’ community, we are looking for some of its own characteristics.”
Among these, the semantics used during the campaign. What are the themes that interest this community most? How are ideas conveyed? Which keywords are most commonly used? The data provide interesting insights for researchers to understand the expectations of each community. They can also be used to draw a group portrait:
“Are the identified communities ‘open’ or ‘closed’? It is for example by understanding how they seek and disseminate information that we can propose to characterize a political community. Data analysis highlights the dynamics of the campaign, the anchoring of a discourse within a community, the loyalty of members to a political program, etc.”
Inventing, relaying, propagating and exploiting false information, rumors, but also fighting them, refuting them, contradicting them, is perhaps a phenomenon inherent in any political campaign. If it acquires a new dimension with social networks, served by an ever-increasing speed of propagation or scope of diffusion, this phenomenon is not new. The summer of 1789 in the Kingdom of France gives, with “La Grande Peur” (“The Great Fear”), an example of the rapid propagation of unverified information (Figure 7.15). Using their analysis tool, the researchers were therefore also interested in the different uses of the digital information sources that the communities observed with their algorithm use (Figure 7.16).
“This is an example of an application of our algorithm, with which we followed the distribution of ‘fake news’ during the 2017 French campaign. For the exercise, we used as a basis for our work a list of false information compiled by journalists from the French daily Le Monde in a section dedicated to their refutation. While this reference is not exhaustive, it has allowed us to highlight the divisions and polarizations that misinformation generates among the political communities participating in the campaign.”
The algorithm developed by the researchers is not universal and it is used with knowledge of its limitations:
“The definition of the ‘political community’ we have proposed is questionable: in particular, we assume that it is characterized by the candidate around whom the users of the Twitter network are structured. Our methodology does not allow us to identify all communities and remains limited to a single social network, Twitter representing only a part of the community of citizens. The model we use is also sensitive to the criteria for evaluating relationships between Internet users: for example, relaying a tweet does not necessarily mean adhering to the information concerned…”
Figure 7.15. A historical example of the rapid spread of unverified information during the summer of 1789 in France
COMMENT ON FIGURE 7.15.– The strange episode of the French Revolution, known as the “Great Fear”, illustrates certain mechanisms for the dissemination of news and the formation of popular movements [LEF 73]. It questions the mysterious alchemy that history sometimes gives birth to. In the summer of 1789, an unexpected revolt of the countryside took place in many provinces of the Kingdom of France. Despite the collection of grievance books and the meeting of the States-General, none of the concerns of the vast majority of small farmers had been raised. The feudal and seigniorial regime, perpetuating the privileges of the nobility and the clergy, the piling up of multiple tax floors, the status of the land – and quite simply the misery of a large number, reinforced by a subsistence crisis had been growing for more than a year and causing numerous agrarian disorders. What was happening in Versailles and Paris encouraged action. In the second half of July, rumors spread that hordes of bandits, who were thought to be perhaps instrumentalized by the aristocrats, were causing damage to villages and crops. People armed themselves with forks and shotguns, and the tocsin sometimes sounded the alarm. When the emptiness of this fear broke out, it turned into an insurrection. Some castles were attacked by peasants – some burned because people were trying to find the documents establishing the many seigneurial rights. How was all this possible in a large part of the Kingdom of France and in such a short time? How were the news, false and true, circulating there? By mail coming from Versailles or Paris in a few days. Thanks to the visits at long distances between families and friends. By the distant echoes of the tocsins, the smoke of burning castles, visible from afar in the countryside, and the newcomers from neighboring towns. Peddlers, who traveled the Kingdom’s roads by the thousands, had long been the “social networks of the time”. They disseminated or invented information that went with the times. The times were hostile to the nobles, who were also feared, while they were less respected. One of the remarkable consequences of this episode was the night of August 4, 1789 – abolishing certain privileges, but not resolving the issue of peasant property. From this example, we can conceive that the peddlers of yesterday and the social networks of today appear more as vectors of certain social and political movements, but are not their root causes.

Figure 7.16. Analysis of information relayed on Twitter during the French presidential campaign in 2017 [GAU 18]. For a color version of this figure, see www.iste.co.uk/sigrist/simulation2.zip
COMMENT ON FIGURE 7.16.– The figure represents an analysis of the information relayed on Twitter by different accounts, identified in community by an algorithm, during the 2017 French presidential campaign. Each community is associated with a color (red, pink, violet, blue, purple, brown). A list of false information is taken as a reference. Their diffusions (yellow dots) and rebuttals (green dots) are monitored over the period from February to April 2017.
Intended for social and political science, the tool, coupled with other algorithms, also makes it possible to understand and evaluate the influence of automated and simulated accounts. As the Agora of the 21st Century is being digitized, algorithms make it possible to understand its driving forces and they also find applications in other fields:
“Algorithms identifying groups of networked users are nowadays receiving the attention of many private companies in order to develop online commerce. It is also part of the arsenal of tools contributing to improving the reputation and digital reputation of brands, companies, etc.”
7.5. What about humans?
At the zenith of an afternoon of full sunlight, a man stands at the crossroads of two highways, bordered by fallow fields and expanses of wheat. Strange place for an appointment: long minutes of waiting, deafening silence and heavy light. A car or a truck pass by without stopping and then this small plane flying at low altitude appears on the horizon. Running for his life, the man had to flee from this biplane that was angry with him for a reason that was still unknown [HIT 59]. Stress and the race for life are embodied by the American actor Cary Grant (1904–1986), in this masterful scene of the masterpiece of British director Alfred Hitchcock (1899–1980), North by Northwest. No dramatic music for an action taking place in full light: the usual cinematographic codes are shaken up and the spectator’s anxiety rises to the highest level! Cary Grant simulates the marks of fear on his face: the character he plays is supposed to go from anxiety to terror in this scene, experiencing all the modulations of this emotion, which the website www.atlasofemotions.org lists (Figure 7.18).
The site was created by the American psychologist Paul Ekman, who, since the late 1970s, has been studying human emotions. His research has led him to publish numerous books on the subject [EKM 03], as part of a humanistic approach. Empathy, the understanding of emotions and the ability to adapt to them, is, according to him, one of the keys to greater harmony among human beings. Emotions are also for them a matter of individual survival [CUR 14] and collective life [RIC 13], also underpinning our decision-making and action: “Emotions are essential for humans to guide reasoning and allow adaptation – they define a goal and maintain a state to achieve it…” [TIS 18]
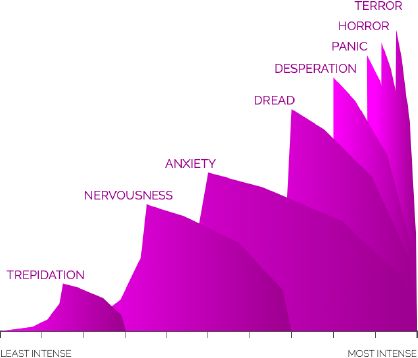
Figure 7.18. The different forms of fear
(source: www.atlasofemotions.org)
Paul Ekman wishes to list all human emotions, and classify them according to their intensity, their duration. He makes these data available in order to name emotions, in all their subtleties and nuances. In 2015, an animation film produced by Pixar Studios was inspired by his research and staged these emotions [DOC 15]. According to Ekman, recognizing them in oneself and in others helps to bring human beings closer together.
Fear, joy, anger, sadness, surprise and disgust would be six emotions common to all human beings that would affect human faces in different ways. In order to identify similarities (or differences), he helped develop a digital tool, the Facial Action Coding System [EKM 78, EKM 80, EKM 93], used today by many psychological researchers (Figure 7.19).

Figure 7.19. Examples of Action Units (AU) from the Facial Action Coding System for human expressions
COMMENT ON FIGURE 7.19.– According to Ekman, facial expressions, elements of human communication, imprint on an individual’s face his internal emotional state, and, in some situations, can betray his hidden intentions. Emotions are communicated by almost imperceptible changes in one or a few facial features: anger is manifested, for example, by a narrowing of the lips, sadness by a downward movement of the corner of the lips. The so-called FACS software has been developed to automatically detect the subtlety and variety of human emotions, and certain nonverbal communication traits. It is based on the empirical observation of human faces through analyzed slow-moving video recordings. In this way, researchers establish a classification of facial expressions, coded in the FACS as Action Units (AU), that can occur individually or simultaneously [DU 14]. The figure above gives some examples, based on the observation of muscle movement around the eyes and lips. It should be noted that, doing so, psychological researchers refer to facial expression modeling.
Facial expressions were studied before Ekman by the painter Charles Le Brun (1619-1690) in the 17th Century. His drawings of the features on human faces were published posthumously in 1727 (Figure 7.19). In the 19th Century, the French physician Guillaume-Benjamin Duchenne (1807–1875) helped to establish a map of facial expressions. He used a device that produced electrical impulses and stimulated facial muscles (Figure 7.20).

Figure 7.20. Observing and reproducing facial expressions
Duchenne published in 1862 the Mécanisme de la physionomie humaine – ou l’analyse électro-physiologique de l’expression des passions. From his researches for instance, Duchenne has shown that a real smile is not only characterized by the contraction of the muscles of the mouth, but also by the contraction of the muscles surrounding the eye. This contraction would be almost impossible to perform voluntarily and not spontaneously, so that a sincere smile would be distinct from a sneer and would be impossible to simulate.
Duchenne in the 19th Century and Ekman in the 20th Century initiated work that extended into the 21st Century with digital techniques. At the confluence of psychology, computer science, neuroscience, automation, behavioral and learning sciences, some researchers are developing systems with the capacity to recognize, express, synthesize and model human emotions [PIC 97, JEO 17]. This new branch of computing is called affective computing, the computing of emotions. For example, it aims to design machines capable of decoding human emotions6 and adapting to them.
Research in affective computing has potential applications in many areas [CAM 16], such as marketing and advertising. Created in 2009, the American company Affectivia (www.affectiva.com) develops and markets, for example, Affdex emotion recognition software, analyzing facial expressions and tone of voice. The company claims to have the most extensive database to date on the emotional responses of Internet users or viewers watching digital content (advertisements, music videos, ads, etc.). These data allow the software to predict the effectiveness of an advertising message according to different criteria (geographical, social, cultural, ethnic or generational) in order to propose targeted campaigns [CAM 16]. In the United States, the Emotion Computing Group at the University of California (www.emotions.ict.usc.edu) and the Emotion Research Group at MIT (www.affect.media.mit.edu) are among the pioneers of this field of research, which is developing in many countries (including France, China, India and Iran) that organize conferences dedicated to this subject. The company mentioned above is a start-up created by MIT and its research teams in this field. In France, several laboratories are interested in affective computing, including LIMSI, where French researcher Laurence Devillers works. She thus defines the objective of its work:
“To make interaction with the machine more natural, we try to build the profile of the person we are talking to by detecting emotions – anger, fear, joy, sadness – which allows the machine to adapt its response…” (remarks reported by [LEG 18]).
This research is undertaken above all to improve the complementarity between human and digital intelligence [GAR 06, KAL 17], for example in order to develop a “social robot”. Simulating the characteristics of living organisms, the latter is designed to replace the human. To do this, it has a set of computer equipment and programs that allow it to perceive their environment and interpret perceived signals – in particular the recognition of human speech and emotions. The robot is designed to make decisions based on perceived, recognized, and also stored information from the environment, based on dedicated algorithms. Using mechanical devices it performs different actions in the physical world, such as producing oral responses through speech synthesis. It can thus potentially perform surveillance, assistance and social interaction tasks, particularly with people suffering from psychological (such as depression) or neurological (such as Alzheimer’s) diseases [RIV 13, CHI 17]:
“A robot expressing empathy can be used to explain, educate, reassure the people with whom the machine interacts. [It can contribute to] the cognitive stimulation of elderly people with diseases such as Alzheimer’s disease. A robot can react with pseudo-affective behaviors. The patient then plays with the robot as if it were a pet, which stimulates him emotionally and creates a social bond” (remarks reported by [LAU 18]).
The social robot remains, for the researcher, a machine. It is far from replacing humans in what is specific to them: “Robots feel nothing, have no emotions or intention. This is a simulation. Even if (we) manage to produce a ‘benevolent’ robot, (it) is only modeling…” (statement reported in [LEG 08]). The development of social robots has led some researchers to rethink the relationship between humans and machines:
“Seeing emotions manifested by humans or robots activates the same areas of the brain in a relatively similar way. We will have to live with machines with which we interact as with humans, knowing that they are not humans” [TIS 18].
Despite advances in mechanics, automation and computer science, robots are still distant cousins of humans, whose memory, body and face remain to this day of unique beauty and complexity. While traveling through the California desert of the Death Valley in the late 1970s, French photographer Jeanloup Sieff (1933–2000) filmed the features of Vaugnet Rollins, a cook he met in a snack bar [SIE 11]. Expression lines and the intensity of his gaze are rendered by a print that highlights them (Figure 7.21). The photograph materializes a portrait that would have aged at the same time as its model, unlike Dorian Gray’s face, frozen in a smooth, cynical and eternal youth [WIL 90], like that of the robots that will one day become our companions. It offers to imagine the life of this woman, contemplating the grooves dug on her face by the time and emotions that have been imprinted on it.
Some scientists use these traits to create robots that look like them. In 2017, Japanese robotician Hiroshi Ishiguro introduced Erica, a humanoid robot of his creation, according to him, the most successful to date. The British newspaper The Guardian has even dedicated a mini-documentary video to her7. Erica is 23 years old. She interacts with humans by answering their questions, she expresses herself in a crystal-clear voice and sometimes lets slip a little mechanical laughter suggesting that she captures human humor. A sophisticated learning program allows her to adapt to the conversation. If her silicone face is not marked by emotions, she has a small smile on her face. Equipped with infrared sensors, she detects the presence of humans beside her and recognizes their facial expressions. She is capable of movements enabled by a system articulated at 20 degrees of freedom (the first simulation models used by mechanical engineers included as many before reaching several hundred thousand nowadays). Erica may present a TV news program [GAR 18]… Its creator wonders: “What does it mean for us to be ‘human beings?’”
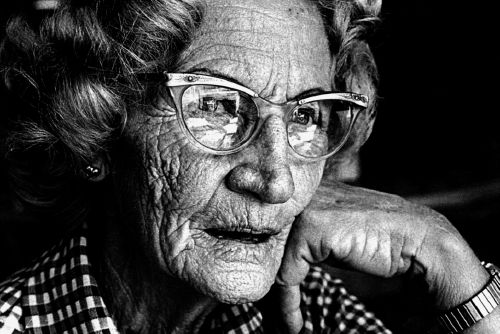
Figure 7.21. Vaugnet Rollins, Jeanloup Sieff, 1977
(source: © Jeanloup Sieff)
In the early 1950s, when modern concepts of artificial intelligence were born, the American writer Ray Bradbury (1920–2012) imagined a futuristic world where omnipresent screens overwhelmed the imagination and the critical sense [BRA 53]. Permitted by books, imagination and reflection become suspicious, as do the paper materials they use. Firefighter Montag was assigned to a special unit, collecting and destroying books, whose pages burned before his eyes at a temperature of 451°F. This act, like the society in which he operates, goes against his deep identity. His quest for freedom led him to find the Hommes-Livres, preserving human knowledge, memory, sensitivity and creativity by memorizing the lines of the greatest works of literature and adopting their title as his middle name. Making mistakes – of judgment, analysis or interpretation – and basing some of our choices on criteria that cannot be reduced to an equation or data, in other words, claiming our subjectivity, freedom and imperfection, might be a first step in answering the question posed above.
The mechanical prowess of robots or the numerical prowess of algorithms will not immediately and irreparably divert us from those of humans. The beauty of a rugby or football match lies in the richness, diversity and fluidity of coordinated human actions as well as in the uncertainty of their achievement. Some movements, considered perfect, such as the kick of an extraordinary sportsman like Jonny Wilkinson, are acquired at the cost of efforts and sacrifices made by humans who are often extraordinary, at the limits of their bodies and psyche [WIL 01].
Some photographs of the French photographer Henri Cartier-Bresson (1908–2004) are models of mastery of space and time, at the service of the emotion and beauty of a suspended moment. Gifted with an extraordinary sense of composition, he says he was influenced in his formative years by the work of Romanian mathematician and diplomat Matila Ghyka, The Golden Number. Cartier-Bresson pays particular attention to the lines that structure an image in some of his photographic compositions. And sometimes in a mathematical way, he researches on certain cliché elements of geometry in order to make his art a science of the living. He also explains the notion of the decisive moment, which can be understood as a presence in time and space, as well as mechanics: “Composition must be one of our constant concerns, but when it comes to photography, it can only be intuitive, because we are dealing with fleeting moments when relationships are shifting…” [CAR 96]. The golden number seems unconsciously engraved in the viewfinder of his Leica camera, with which he captured the fleeting moments. One of his photographs, Ile de Sifnos, published in the collection Les Européens [CAR 97, p. 115] is a model of composition based on forms and a furtive moment when a silhouette breaks in. Looking at it, I find it reasonable to believe that imagination, intuition, sensation and emotion – some would say consciousness [KOC 12] – will remain the hallmark of human beings and their freedom, whether or not assisted by technology.
- 1 Some examples testify to the current power of algorithms, and allow us to glimpse their future capabilities, which we can imagine for various uses. While our century is witnessing the concrete achievements of these algorithms, some thinkers seem to have anticipated their possible drifts. Thus the French philosopher Simone Weil (1909--1943) estimated, in the last century, that “(money,) machinism (and) algebra (would be) the three monsters of the present civilization” [WEI 47]. Also making possible the large-scale surveillance of citizens and societies for the benefit of public or private interests [LAR 18] or the advent of a world governed by algorithms for the benefit of a minority of humans [DUG 16], some of their uses can help to embody the Orwellian nightmare [ORW 49]. As our purpose here is not to address this dimension, we suggest that the reader completes his reflection with the authors exploring it in depth [CAR 14, CAR 16, HAR 17, HAR 16, HARA 18, SAD 13, SAD 15, SAD 18].
- 2 It should be noted that the requirements of marketing are not those of medicine or engineering, for example, areas in which high predictive reliability is expected, whereas in mass marketing, the quantity of profiles analyzed can somehow compensate for the quality and effectiveness of the purchase suggestion.
- 3 The pastor of Montgomery, engaged in a political struggle for civil rights in the United States in the 1960s, is a public and historical personality whose words, world view, thoughts and actions are generally known (non-violence, altruism and compassion, political and spiritual commitment, intellectual courage and curiosity, political voluntarism and militant action, etc.). We use his text for the purpose of the demonstration, hoping to learn no more than we already knew. The way some historians view his personality and action is still the surest way to get to know both. Note that the analysis algorithm does not recognize the speech delivered by Martin Luther King, nor its author, what another program (or a human!) would be able to achieve. We can also ask ourselves how he would have been able to analyze a text as rich, imaginative and intriguing as James Joyce’s Ulysses [JOY 22].
- 4 Available at: https://irstv.ec-nantes.fr/environnement-sonore-urbain/.
- 5 For this type of study, researchers respect legal obligations and obviously take precautions – hence, the data collected are anonymized and stored in a secure manner. “Such research, carried out between February and April 2017, i.e. before the entry into force of the DGMP and a change in the terms of use of the Twitter network, would no longer be possible as it stands today”, stresses Noé Gaumont.
- 6 It should be noted that emotions can also be detected indirectly, for example with the analysis of physiological data [GOU 11, NAE 16, RAG 17, WIO 17] or vocal expressions [BAZ 15, JOH 06, COW 18] – or even the composition of tears, as shown by the work of the American photographer Rose-Lynn Fischer [FIS 17].
- 7 Available at: https://www.theguardian.com/technology/ng-interactive/2017/apr/07/meeterica-the-worlds-most-autonomous-android-video/.