
3
Flat-Cladding Fiber Bragg Grating Sensors for Large Strain Amplitude Fatigue Tests
Abstract
We have successfully developed a flat-cladding fiber Bragg grating sensor for large cyclic strain amplitude tests of up to ±8000 με. The increased contact area between the flat-cladding fiber and the substrate, together with the application of a new bonding process, significantly increased the bonding strength. In push–pull fatigue tests of an aluminum alloy, the plastic strain amplitudes measured by three optical fiber sensors differed by only 0.43% at cyclic strain amplitudes of ±7000 με and 1.9% at cyclic strain amplitudes of ±8000 με. We also applied the sensor on an extruded magnesium alloy for evaluating the peculiar asymmetric hysteresis loops. The results obtained were in good agreement with those measured from the extensometer. The flat-cladding fiber Bragg grating sensors were then applied to the measurement of the localized strain variations in a friction stir–welded sample and to the characterization of asymmetric fatigue deformation of the extruded magnesium alloy. In the first case, significant differences in the deformation behavior of different zones were observed. In the second case, drastic asymmetric stress–strain hysteresis loops were observed.
Keywords
Deformation; Fatigue; Fiber Bragg grating sensor; Flat-cladding fiber; Friction stir welding; Large strain measurement; Metal alloy
3.1. Introduction
In the design of mechanical components, the fatigue properties of materials are of particular importance as 80%–90% of metal failures in practice arise from fatigue [1]. The fatigue life of components is generally determined from low-cycle fatigue tests at large strain amplitudes and high-cycle fatigue tests at low strain amplitudes. To accurately predict the fatigue life, it is critical to measure the strain in push–pull fatigue tests, especially under the large strain amplitude that induces significant plastic deformation. However, the conventional thin-film strain gauge cannot take large cyclic strain amplitudes; and the extensometer, though capable of taking large strain amplitudes, is relatively large in size, unsuitable for the measurements at the boundary of dissimilar materials or for localized strain measurements.
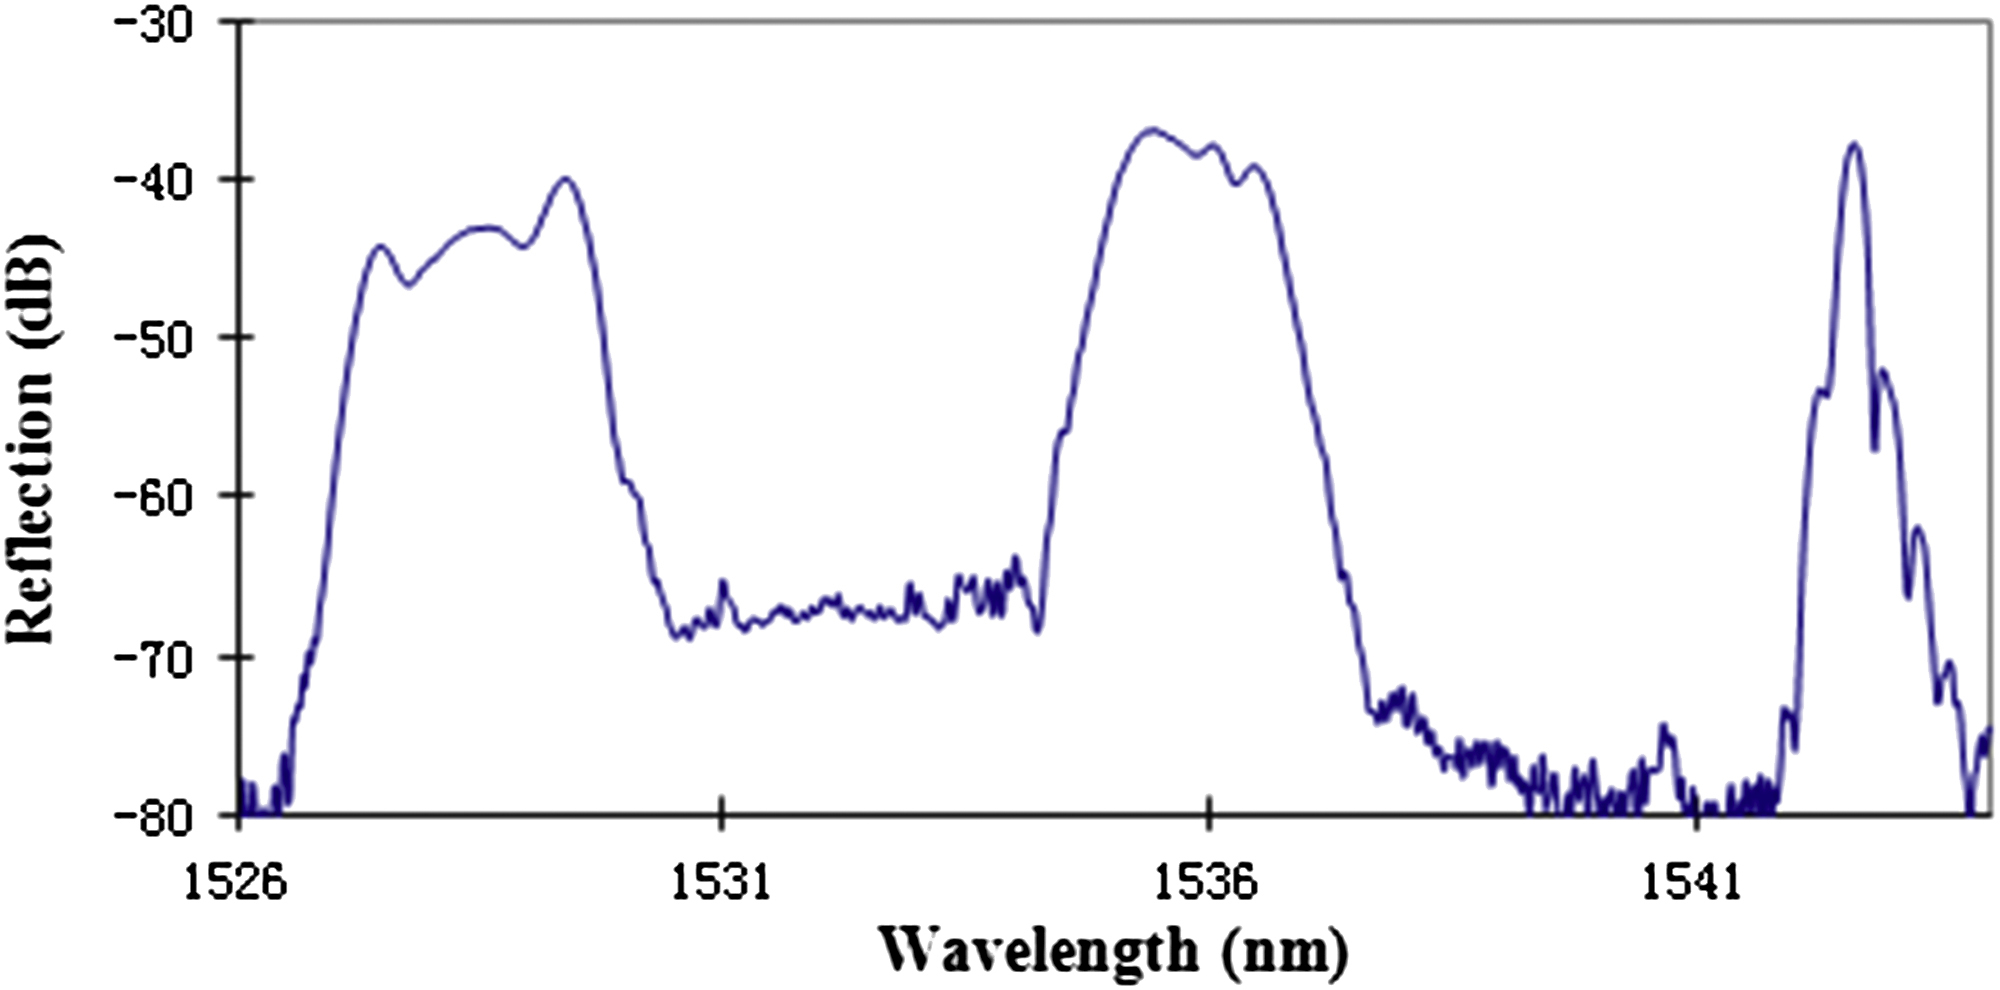
Fiber optic sensors, particularly fiber Bragg gratings (FBGs), have become increasingly popular because of their wide dynamic range, immunity to electromagnetic interference, and multiplexing capability. The FBG sensor, inscribed in the core of an optical fiber of 125 μm in diameter, could be made as short as 2–5 mm in length and has been used in localized strain measurements, such as on a flip-chip ball grid array that was not accessible to conventional strain gauges [2]. Despite the success of FBGs in strain sensing and in structure health monitoring, there are few reports on their applications in fatigue tests of materials, especially in large cyclic strain amplitude tests. When an FBG fiber is bonded to a substrate with epoxy, the substrate strain is transferred to the fiber sensor by the shear stress of the epoxy. Owing to the limited contact area between the circular fiber and the flat substrate and the shear modulus of the epoxy, large substrate strain often causes the fiber to slip, rendering the FBG strain reading to be less than the true substrate strain. With FBGs inscribed on the circular fiber, significant chirp in the reflective peaks of the FBG spectra could occur, as shown in Fig. 3.1, when the sample was fatigued for 100 cycles at a strain amplitude of ±5000 με. This problem severely limited the applications of the FBG sensors in mechanical tests involving large strain amplitudes. The FBG chirp or reflective peak split is mainly due to uneven slippage between the FBG and the substrate at large strain amplitudes. Ref. [3] analyzed in detail the geometric parameters of the adhesive on the substrate strain transfer to FBG, but only at low strain levels. Typically the FBG sensor is used when the strain variation is less than 3000 με [4]. For example, surface-mounted FBG sensors were subjected to a mean strain of 1100 or 2250 με in a reliability test of the FBG sensors installed on a carbon fiber reinforced polymer cable used in a suspension bridge in Switzerland [5]. To overcome this limitation, it is essential to develop a new type of surface-mounted FBG sensor and a new bonding process for the measurement of large dynamic strain amplitudes in fatigue tests and in other material tests such as crack initiation detection and crack closure evaluation.
In this chapter, the development of a flat-cladding FBG sensor that significantly increased the FBG's strain measurement range is presented. With a new fiber type and bonding process, the sensor is demonstrated to measure reliably large strain amplitudes of up to ±8000 με in aluminum alloys, which is the highest strain amplitude reported that the surface-mounted FBG sensors can withstand. The calibration and the bonding process of the sensor are described in detail and the application of this sensor in fatigue tests of magnesium alloy samples is also presented.
3.2. Experiments
The FBG sensors were fabricated on hydrogen-loaded flat-cladding fiber (Prime Optical Fiber Corp., Taiwan, ROC) with a collimated KrF excimer laser (Lumonics, Model PM 844) emitting laser pulses at 248 nm. The laser beam was focused on a horizontally positioned fiber through a phase mask. The FBGs were apodized with a SINC function with an effective length of 3 mm. All FBGs were annealed at 150°C for 15 h after FBG inscription to ensure their long-term stability.
The flat-cladding fiber has a diameter of 125 μm and a thickness of 83 μm that provides a substrate contact width of 93.5 μm, as shown in Fig. 3.2. To ensure that the fiber sensor was bonded to the substrate with a uniformly thin layer of epoxy, we used the following procedure. A dog-bone-shaped aluminum alloy, used as the base metal, was ground with No. 320 and then No. 600 sandpaper in the direction perpendicular to the fiber axis. Two strips of aluminum tape ∼0.10 mm thick were placed alongside the fiber to form a trench about 1.5 mm wide. After the trench was filled with epoxy (Part No. 353ND, EPO-TEK), a strip of nonstick paper and then a thin rubber sheet were used to cover the trench and fiber. A rectangular-shaped weight was placed on the top of the rubber sheet to press the fiber uniformly against the substrate (Fig. 3.2). The assembly was then placed in an oven for curing at 80°C for 45 min.
The metallic samples tested had a gauge length of 25 mm (or parallel length of 32 mm) and were 6 × 6 mm2 in cross section. The FBG array with three FBG sensors at 1528.94, 1536.10, and 1543.20 nm, respectively, as shown in Fig. 3.3, was bonded to the front flat surface of the sample. The reflective peaks of the FBG sensors showed a high optical signal-to-noise ratio of ∼30 dB. The bonding process caused the blue shift of the FBG wavelengths by ∼2 nm. However, the bandwidth and the reflectivity of each FBG remained the same.
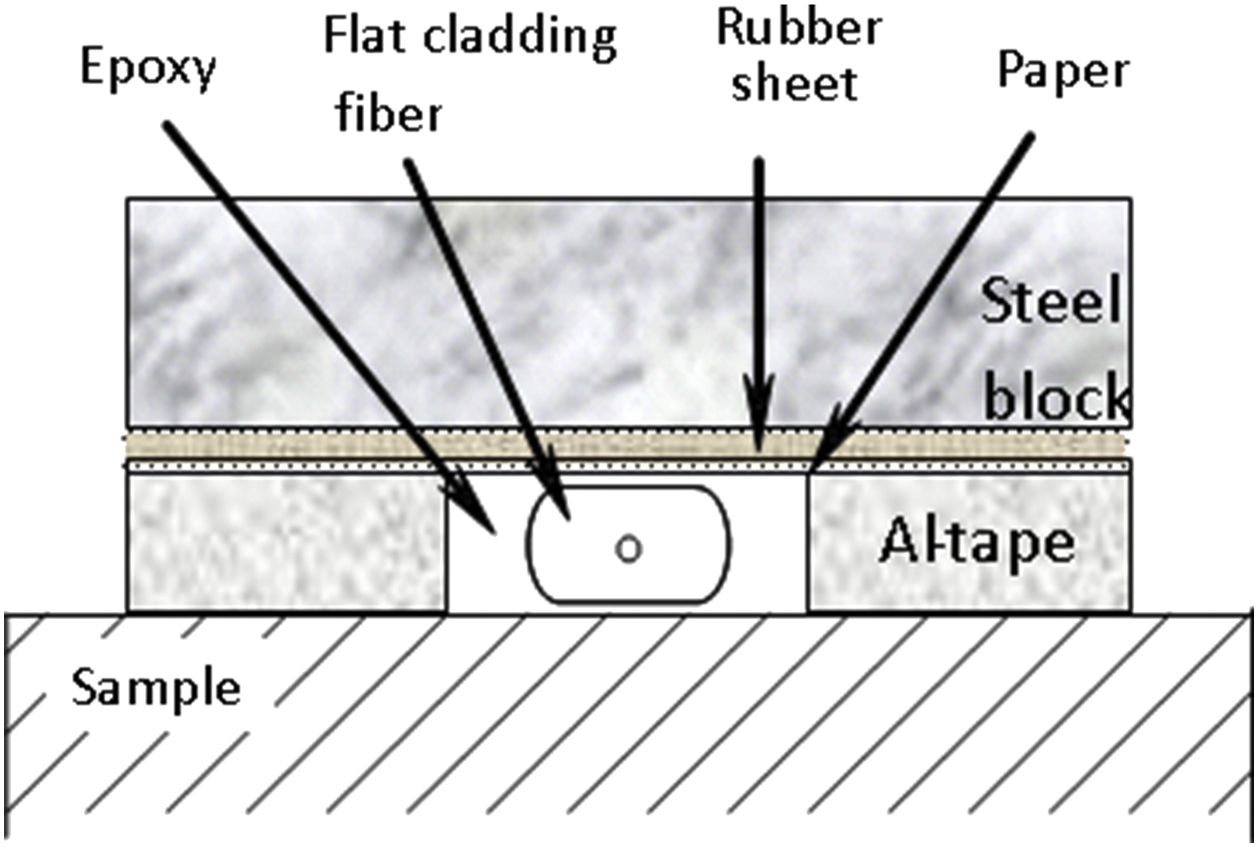
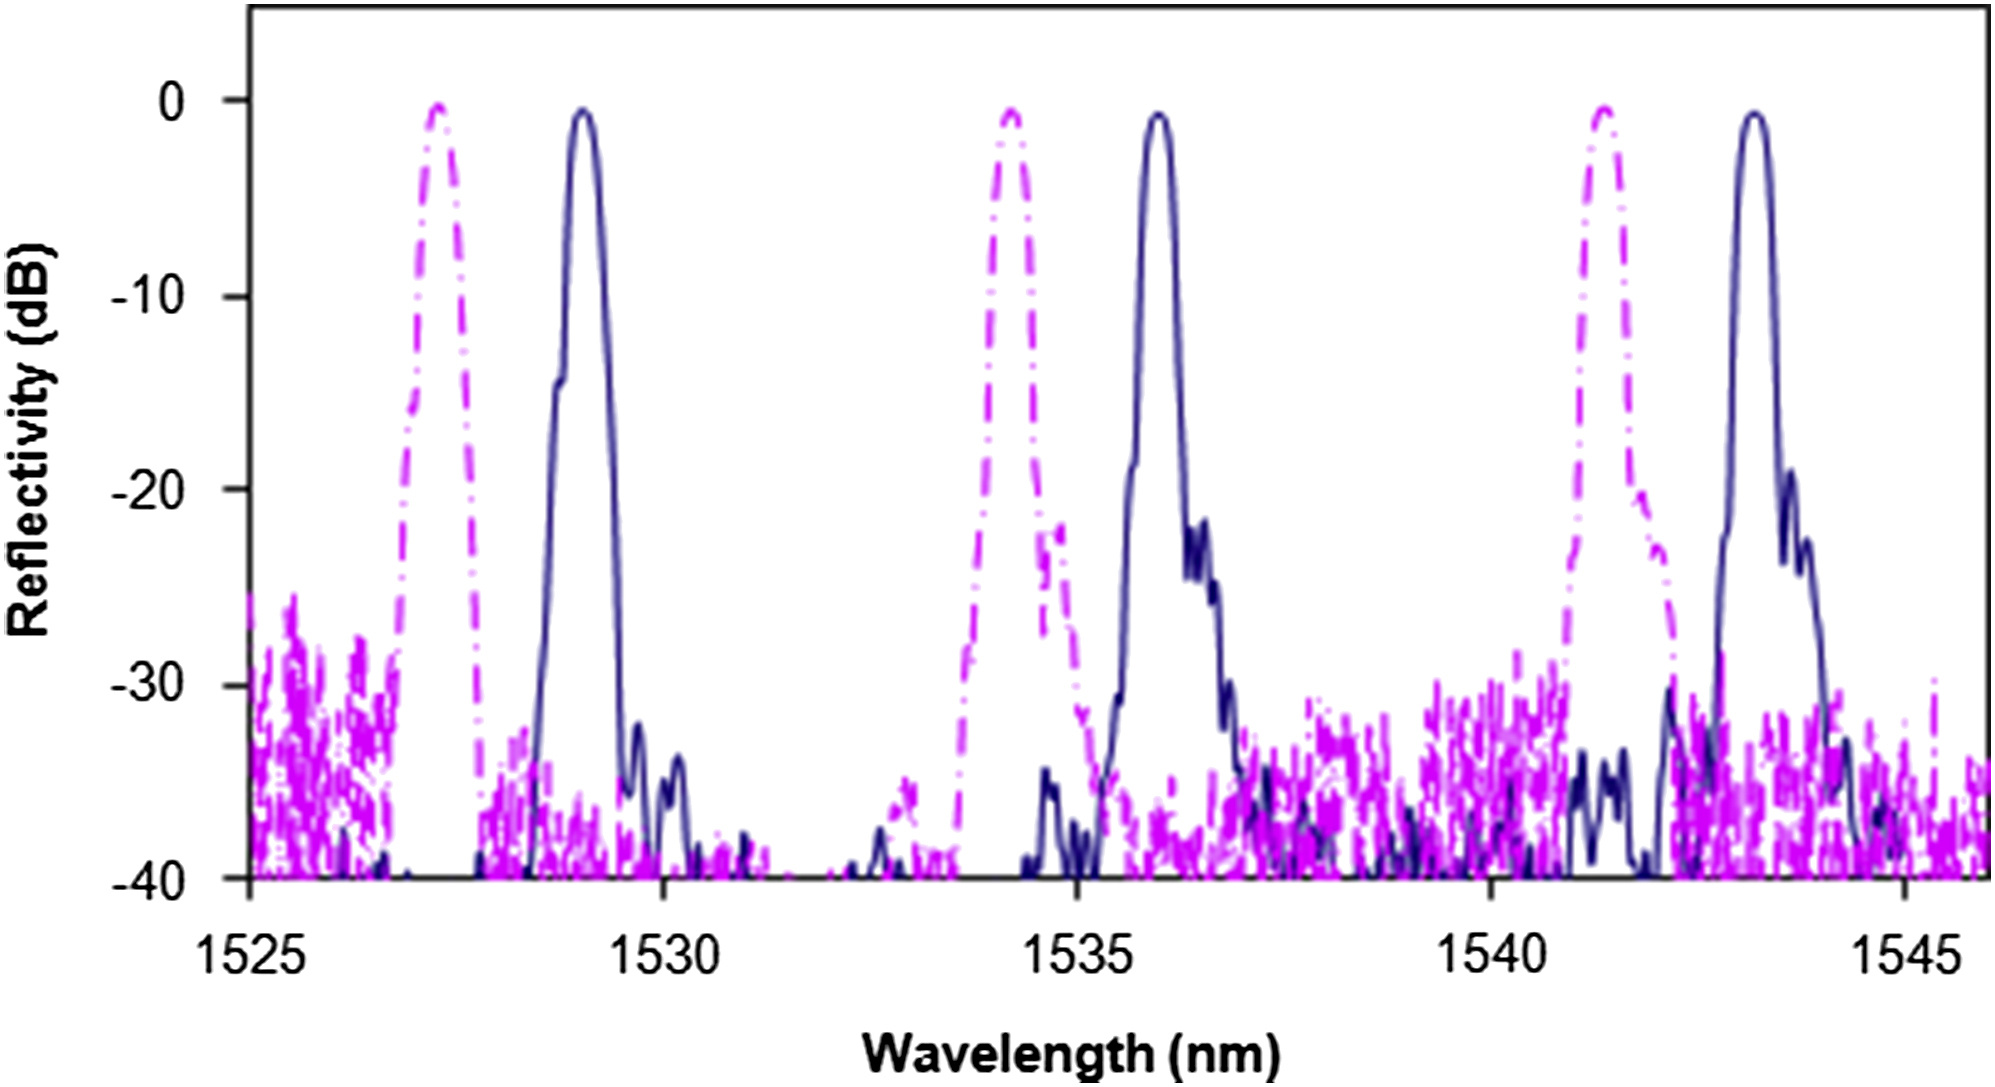
Figure 3.3 Reflection spectra of a fiber Bragg grating sensor array before (solid line) and after (dashed line) being bonded to an aluminum sample.
Strain-controlled, push–pull-type fatigue tests were carried out using a computerized fatigue testing system (Instron, Norwood, MA, USA). The sample was tested for 100 cycles at strain amplitudes varying from ±2000 to ±9000 με at increments of ±1000 με. An extensometer of 25-mm gauge length was used to measure the strain and provide feedback to the system under strain control. The wavelength shifts of the FBGs were recorded by a sensor interrogation system (Model si425, Micron Optics) and then converted to the strain by a gauge factor of 1.25 pm/με. The applied load was recorded simultaneously from an analog output port of the Instron system using an analog-to-digital data acquisition card (Model USB-6215, National Instruments) and was converted into the stress. Thus, both strain and stress values were recorded as a function of time for each fatigue cycle.
3.3. Sensor Validation Results
3.3.1. Fatigue Test of Aluminum Alloy
In the fatigue tests of below ±4000 με strain amplitude, the stress dependence on the strain was basically linear, as expected, and the plot of stress versus strain showed a straight line. As the strain amplitude increased, a hysteresis loop of the stress versus strain developed owing to the occurrence of cyclic plastic deformation. The hysteresis loops became obvious when the cyclic strain amplitude exceeded ±6000 με. We measured the width of the hysteresis loop at zero load, i.e., plastic strain amplitude (an important parameter in the low-cycle fatigue tests), for each cycle as the cycling progressed.
Fig. 3.4A shows typical hysteresis loops of the 10th cycle measured by three FBG sensors (labeled a1s1, a1s2, and a1s3) in an array on the aluminum sample at a cyclic strain amplitude of ±7000 με. The hysteresis loop measured from the extensometer was also plotted for comparison (labeled FT). One can see that the results from the FBG sensor matched very well with that from the extensometer. When the measured plastic strain amplitudes from the three FBG sensors were compared with that from the extensometer for all 100 cycles, as shown in Fig. 3.4B, a good agreement was also observed, not only in the magnitude but also in the trend of plastic strain variation reflecting cyclic hardening–softening behavior of materials. The largest difference in the plastic strain amplitude measured by the three FBG sensors was about 0.003%, which was only 0.43% of the cyclic strain amplitude of ±7000 με. This clearly validated that flat-cladding FBG sensors can be used to measure large strain amplitudes in fatigue tests.
To determine if the bonding between fiber sensor and substrate was still intact, we measured the spectra of the FBG array at zero, maximum, and minimum load after each cyclic loading test. The reflective spectra of the array after 100 cyclic loads at ±7000 με strain amplitude are shown in Fig. 3.5. We see no change in the relative wavelength spacing between the sensors at three loads, indicating no slippage between the flat-surface sample and the optical fiber. In contrast to Fig. 3.1, we also see no bandwidth broadening in any of the three sensors, indicating that no chirp occurred in any of the FBGs, i.e., the strain had transferred uniformly along the fiber. The compression of the sample at the minimum load did reduce the reflectivity of the FBG sensors by 1–2 dB compared with no load or the tensile condition. Nevertheless, the reduced reflectivity would not affect our strain measurement because the strain was determined by the wavelength shift, not by the intensity of the FBG peak.
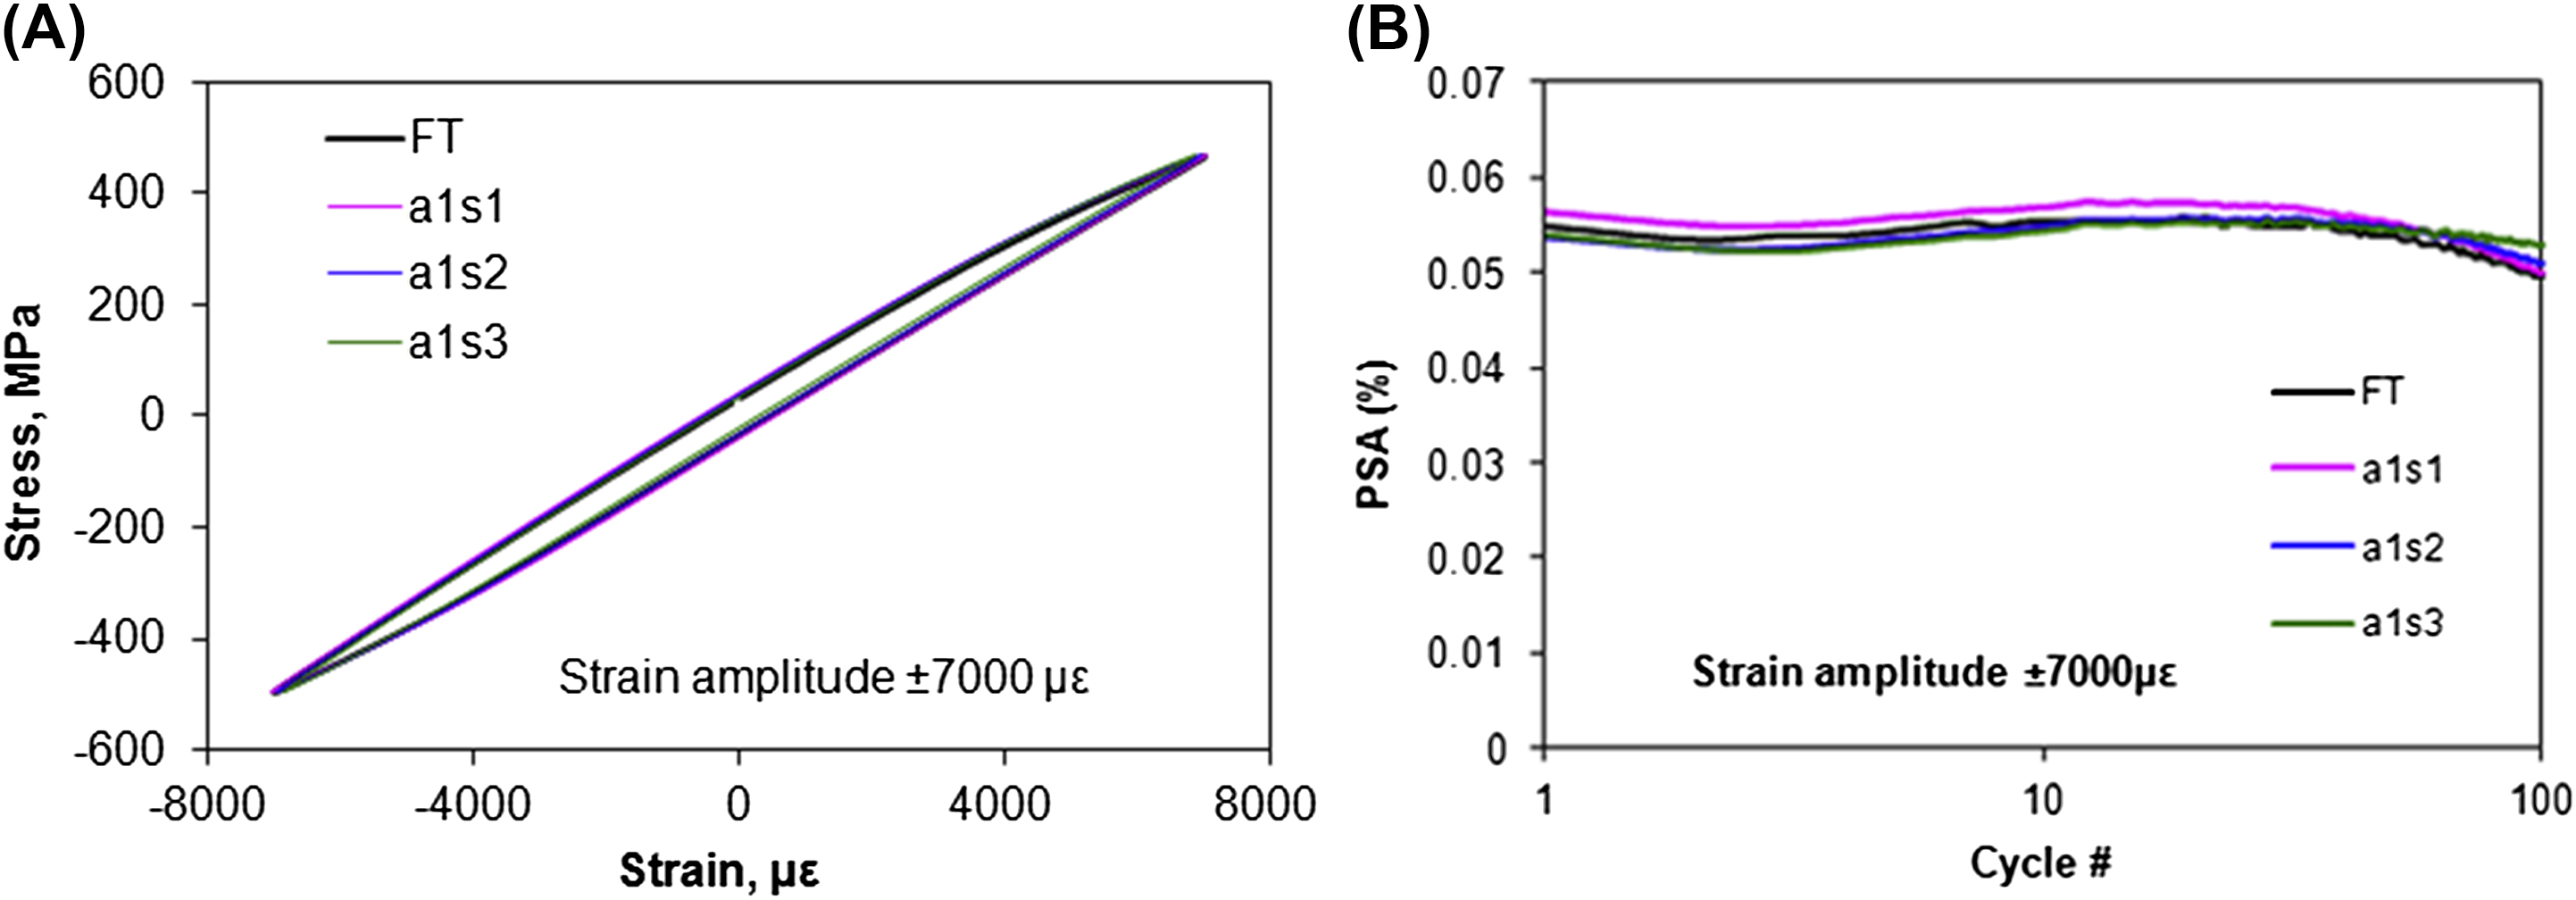
Figure 3.4 (A) Fiber Bragg grating sensors measured stress as a function of applied strain at the 10th cycle at ±7000 με strain amplitudes. (B) Plastic strain amplitude (PSA) of three sensors at ±7000 με strain amplitude from the 1st to the 100th cycle. a1s1, sensor 1 of array 1 data, and so on for a1s2 and a1s3; FT, extensometer data.
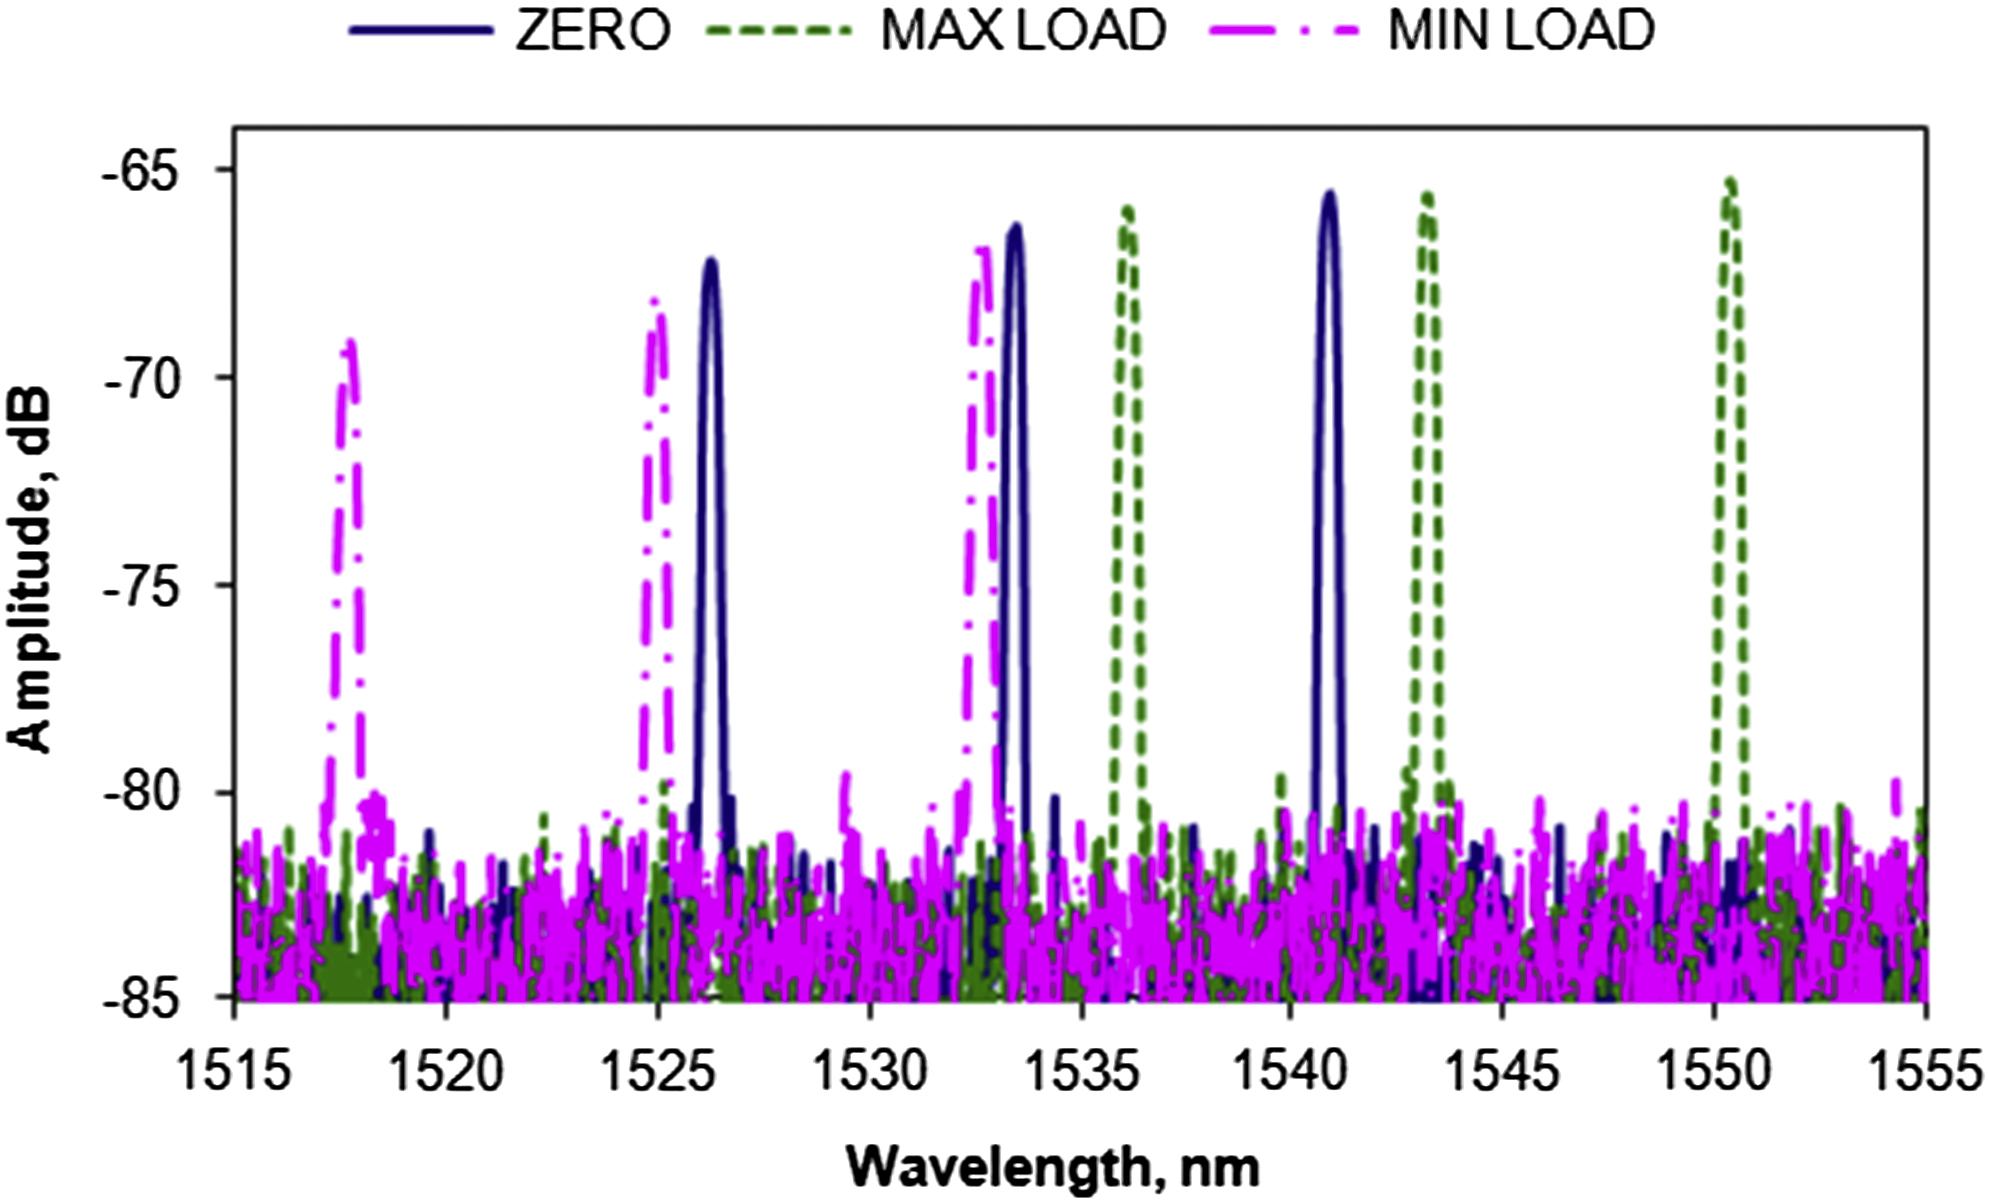
Figure 3.5 The spectra of the array at three different loads after 100 cycles at ±7000 με strain amplitude.
We also tested the same sample at cyclic strain amplitudes of ±8000 με for 100 cycles. The measured plastic strain amplitudes from the three FBGs agreed with that from the extensometer as well. However, the difference in the plastic strain amplitudes from the three FBG sensors increased to 0.019%, i.e., 1.9% of the strain amplitude at ±8000 με. We also observed the bandwidth broadening of the FBG peaks by 10%–15% compared with the bandwidth of the FBGs after 100 cycles under ±7000 με. The bandwidth broadening indicated that strain transfers started to become nonuniform along the fiber as the strain amplitude increased to ±8000 με. The aluminum sample broke at the ninth cycle in the ±9000 με strain amplitude tests. Based on these data, we can conclude that the upper limit of the strain measurements using the flat-cladding FBG sensor was around ±8000 με on this type of sample. This limit could be further extended by improvement of the bonding material and process, such as using epoxy with a high shear modulus.
3.3.2. Fatigue Test of Magnesium Alloy
To further validate the flat-cladding FBG sensor, we also bonded a sensor array on an extruded AZ31 magnesium alloy sample and conducted the fatigue tests. The magnesium alloy is a lightweight structural material with a peculiar and large asymmetric hysteresis loop under cyclic loading [6]. In the strain-controlled fatigue test, we observed plastic deformation even at the low cyclic strain amplitude of ±2000 με and the deformation became more prominent with increasing strain amplitude.
Fig. 3.6 compares the hysteresis loops measured from three FBG sensors on an array bonded to an extruded AZ31 magnesium alloy sample, with the hysteresis loop measured from the extensometer at ±5000 με strain amplitude. One can see that the stress–strain curves measured by all three FBG sensors matched almost perfectly with that from the extensometer. The large asymmetric loop, especially the plastic deformation in its compressive and decompressive/tensile phases, helps to understand the microscopic changes (i.e., twinning–detwinning) in the magnesium alloy during fatigue deformation.

Figure 3.6 Hysteresis loop of the AZ31 magnesium alloy at the 10th cycle and a strain amplitude of ±5000 με. The inset shows the enlarged compression– decompression corner. a1s1, sensor 1 of array 1 data, and so on for a1s2 and a1s3; FT, extensometer data.
These results clearly validated this new FBG-based sensor for the measurement of large cyclic strain variations. The large contact area between the flat-cladding and the flat substrate, along with the application of a new bonding process, significantly increased the bonding strength, which provided a proper transfer of the strain from the substrate to the optical fiber. Our test data showed that the flat-cladding FBG sensors can be used to measure cyclic strain amplitude as large as ±8000 με in dynamic fatigue tests under the current test conditions. This represents a remarkable increase in the strain measurement that could make the FBG sensor a vital tool in low-cycle fatigue tests at large strain amplitudes. Other than FBG sensors embedded inside carbon fiber reinforced polymers, we are not aware of any surface-mounted FBG sensors that could withstand such high cyclic strain amplitudes. Furthermore, owing to its small size, the FBG sensor could be used to measure localized strain variations, for example, in welding joints; detect fatigue crack initiation; and determine the crack closure effect during fatigue crack propagation. Next we present applications of this sensor to the measurement of the localized strain variation in a friction stir–welded sample and to the characterization of asymmetric fatigue deformation of an extruded magnesium alloy.
3.4. Application in the Fatigue Test of a Friction Stir–Welded Aluminum Alloy
3.4.1. Motivation
In mechanical structure design, the requirement of weight reduction has prompted more and more adoption of lightweight materials, such as aluminum and magnesium alloys. For these materials, rivets and other attaching mechanisms are often used in the industry because of their relatively poor weldability. Friction stir welding (FSW), developed at The Welding Institute of the United Kingdom in 1991 [7], offered an innovative solution to the joining of some difficult-to-weld materials. FSW has many advantages compared with conventional fusion welding [8–10]. In the FSW process, the temperature is kept much below the melting point of the metals, which eliminated defects of the casting structure associated with fusion welding, such as gas occlusion, shrinkage, and hydrogen voids [8]. Friction stir–welded joints, in general, have a longer fatigue life than fusion-welded joints [9]. However, despite the success of FSW, tensile tests showed that FSW joints have about 80% of the ultimate tensile strength of the base metal (BM), and the fatigue life is also reduced compared with that of the BM. To ensure the integrity and reliability of friction stir–welded joints, it is necessary to study their fatigue properties, especially in low-cycle fatigue (LCF) tests at high strain amplitudes.
Friction stir–welded joints fractured often at the boundary between the thermomechanical-affected zone (TMAZ) and the heat-affected zone (HAZ). Microstructural examinations and hardness tests revealed significant differences in grain sizes and hardness values in the nugget zone (NZ) and in the TMAZ, respectively [11,12]. Nonuniformity across the friction stir–welded joints would be expected, which would lead to the different deformation characteristics. It is thus of great interest to identify the deformation characteristics in these zones separately, to understand the failure mechanism. However, the conventional thin-film strain gauge cannot be used to measure large strain during cyclic deformation; and the extensometer, while capable of gauging large strain amplitudes, is relatively large in size, so it measures only averaged strain over its gauge length.
As presented above, we had successfully developed flat-cladding FBG sensors for the measurement of large strain amplitudes of up to ±8000 με in LCF tests [13]. The FBG sensors, made as short as 2–5 mm in length and 125 μm in diameter, can be surface mounted relatively easily for the measurement of localized strains or strains across the boundaries of different zones.
While there are some publications on the fatigue life of friction stir–welded joints [14–16], to the authors' knowledge, no cyclic deformation characteristics in different zones of friction stir–welded joints have even been reported. In this section, we report the application of a flat-cladding FBG sensor array to characterize the fatigue deformation of friction stir–welded samples in LCF tests at high strain amplitudes. FBG sensors of 3 mm in length were surface mounted in the NZ and across the boundary between the TMAZ and the HAZ (3/4 in TMAZ and 1/4 in HAZ). We observed significant differences in the fatigue deformation characteristics in the NZ and at the boundary between the TMAZ and HAZ.
3.4.2. Sample Preparations
The rolled aluminum alloy plates of 6.35-mm thickness (Type 7075Al-T651), with a composition of 5.6 Zn/2.5 Mg/0.5 Fe/0.16 Cu/0.23 Cr/0.3 Mn/0.2 Ti (wt%), were friction stir welded along the rolling direction using an FSW machine (China FSW Center, Beijing). A steel tool with a shoulder of Φ20 mm and a cylindrical threaded pin of Φ8 mm was used. The tool's rotational rate was 1000 rpm and the welding speed was 400 mm/min. A microhardness profile was produced along the bottom line on the cross section of the weld using a computerized Buehler hardness tester under a load of 300 g for 15 s. Subsized fatigue specimens were machined perpendicular to the FSW direction, following ASTM E8 standards with a gauge section of 25 mm × 6 mm × 5.6 mm. Fig. 3.7 shows a typical cross-sectional image of the friction stir–welded 7075Al-T651 joint in which four zones, namely, NZ, TMAZ, HAZ, and BM, can be identified.
The FBG array had three FBG sensors at 1528.94, 1536.10, and 1543.20 nm, respectively. The array was bonded to the back of the dog-bone-shaped friction stir–welded sample with a uniform thin layer of epoxy (353ND, EPO-TEK). After that the assembly was placed in an oven for epoxy curing for 45 min at 80°C.
Strain-controlled, push–pull-type fatigue tests were carried out using a computerized Instron fatigue testing system (Instron, Norwood, MA, USA). In the fatigue testing, a triangular waveform with a strain ratio of R = −1 was applied at a constant strain rate of 1 × 10⁻² s−1. The sample was tested for 100 cycles starting from the strain amplitude of ±2000 με until failure, with a strain amplitude increment of ±1000 με. An extensometer of 12.5-mm gauge length was used to measure the strain and provided feedback to the system under strain control. During the LCF tests the wavelength shifts of the FBGs were recorded by a sensor interrogation system (Model si425, Micron Optics) and then were converted into the strain by a gauge factor of 1.25 με/pm. The shift of the Bragg wavelength, λB, with the strain, ε, can be expressed as [4]
The applied load was recorded from the analog output port of the Instron system using an analog-to-digital data acquisition card (Model USB-6215, National Instruments) and was then converted into the stress. Thus, both strain and stress values were recorded simultaneously as a function of time for each fatigue cycle.

3.4.3. Results and Discussion
To validate the consistency of the three FBG sensors, we first bonded them to an unwelded BM and conducted the strain-controlled fatigue tests. When the strain amplitude was below ±4000 με, the stress dependence on the strain was basically linear, as expected. As the strain amplitude increased, a hysteresis loop of the stress versus strain started to develop owing to the occurrence of cyclic plastic deformation. The hysteresis loops became very prominent when the cyclic strain amplitude reached ±6000 με.
We compared the measured plastic strain amplitudes (the half-width of the stress versus strain hysteresis loop at zero) from the three FBG sensors (labeled as a1s1, a1s2, and a1s3) with that from the extensometer for all 100 cycles at the cyclic strain amplitude of ±7000 με (Fig. 3.8). Good agreement was demonstrated not only in magnitude but also in the trend in strain variation, reflecting the cyclic hardening–softening behavior of materials. The largest difference in the plastic strain amplitudes measured by the three FBG sensors was about 0.003%, which was only 0.43% of the cyclic strain amplitude of ±7000 με applied. This clearly validated the FBG sensors for fatigue testing.

Figure 3.8 Variation in plastic strain amplitude of the base metal fatigue tested at a strain amplitude of ±7000 με measured via three fiber Bragg grating sensors and an extensometer from the 1st to the 100th cycle. a1s1, sensor 1 of array 1 data, and so on for a1s2 and a1s3; EXT is the extensometer data.
For measurement of the deformation behavior in the different zones of the friction stir–welded joint, an FBG array with three sensors was bonded to the back surface of the sample. The middle sensor was placed at the center of the NZ, the other two sensors were bonded across the boundary of the TMAZ and the HAZ symmetrical with the center. The fatigue tests were conducted with the same parameters as for the BM. We observed that the plastic deformation started at a low strain amplitude of ±4000 με and the deformation increased with increasing strain amplitude. As the strain amplitude increased to ±5000 με, we detected very different hysteresis loops in the NZ and in the boundary area. The plastic strain amplitude was much smaller in the NZ (Fig. 3.9A) compared with that in the boundary (Fig. 3.9B). The hysteresis loops measured from the two sensors located mostly in the TMAZ were close to each other, with the maximum difference in the loops' width being ∼66 με, i.e., 1.3% of the cyclic strain amplitude of ±5000 με. This result revealed that the NZ was harder than the boundary area at the beginning of the fatigue test. We also plotted the hysteresis loop measured by the extensometer for comparison, and noticed that its plastic strain amplitude was smaller than that in the boundary area but larger than that in the NZ. Considering that the two blades of the extensometer extended 12.5 mm, covering both the NZ and the TMAZ, it was clear that the extensometer only measured the average strain response of the friction stir–welded joint.
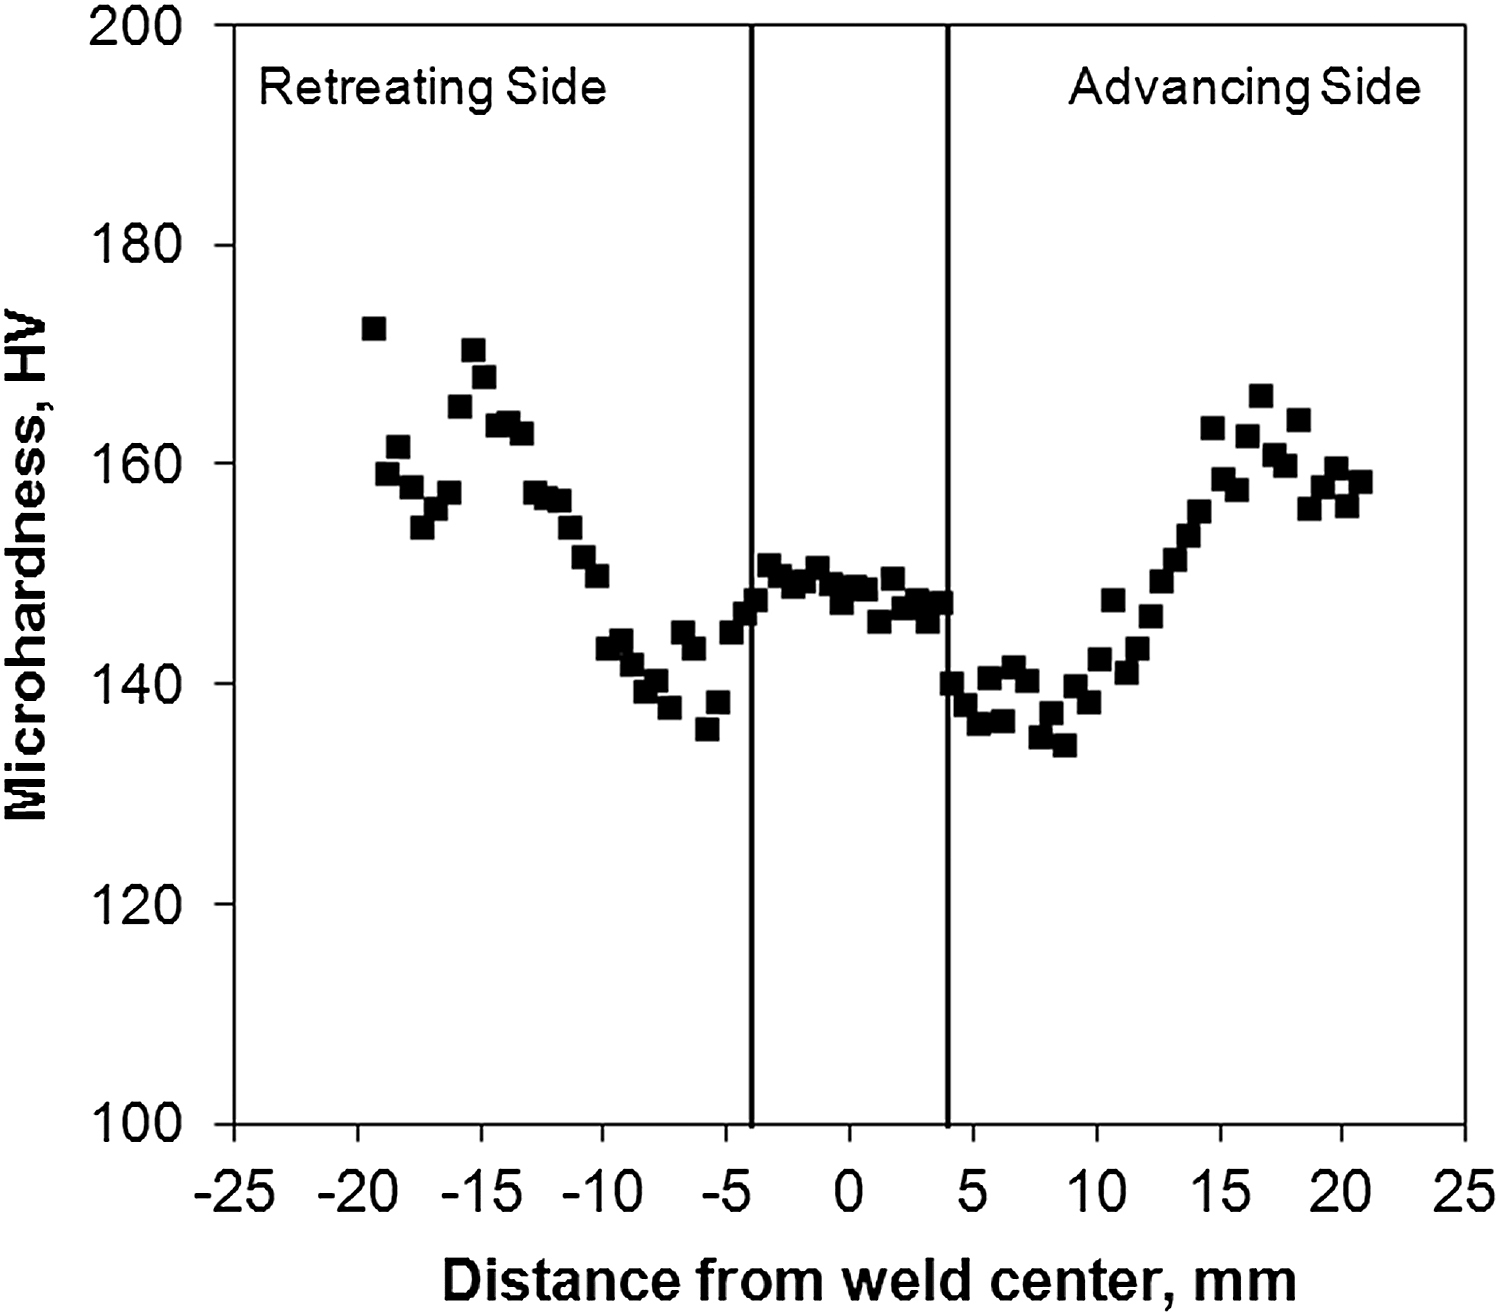
The widths of the hysteresis loops in the NZ and TMAZ could be correlated well with the hardness profile (Fig. 3.10), in that a significant decrease in the hardness from HV 150 in the NZ to HV 135 at the boundary between the TMAZ and the HAZ was observed. The hardness of the BM was measured to be about HV 165. This measurement confirmed that the NZ was harder than the boundary area at the beginning of fatigue cycling. Because the difference in the cyclic deformation behavior in the NZ and TMAZ would directly affect the fatigue lifetime of the friction stir–welded joints, the FBG measurements could provide valuable information for the improvement of the FSW process. For example, FSW parameters could be selected that minimize the hardness difference between the NZ and the TMAZ.

Figure 3.9 Hysteresis loops of the 10th cycle at a strain amplitude of ±5000 με. (A) Measured by the fiber Bragg grating sensor at the center of the nugget zone (NZ), and (B) measured by two sensors across the thermomechanical-affected zone and the heat-affected zone. EXT, extensometer data; TMAZ, thermomechanical-affected zone.
We further compared the measured plastic strain amplitudes from the three FBG sensors with that of the extensometer for all 100 cycles (Fig. 3.11A and B). A remarkable difference in the fatigue properties in different zones was observed. In the boundary between the TMAZ and the HAZ, the plastic strain amplitude decreased from 0.16% at the 1st cycle monotonically to 0.024% at the 100th cycle, while in the NZ it increased gradually from ∼0.01% at the 1st cycle, reaching a maximum value of 0.053% at approximately the 80th cycle, and then slightly decreased toward the 100th cycle. These results indicated that cyclic softening occurred in the initially harder NZ, while cyclic hardening occurred in the initially softer boundary area. Our measurements were in agreement with the results reported in the literature [14,15] that the occurrence of cyclic hardening or softening was dependent on the initial state of the test material. In the recrystallized soft state, cyclic hardening occurred, while in the hardened state, cyclic softening occurred [15]. From the hardness measurement, the TMAZ–HAZ boundary had a lower hardness value in comparison with the NZ (Fig. 3.10); thus cyclic hardening would be expected to occur. While the cyclic hardening or softening in different zones could be generally understood from the hardness variation, this study represents an initial exploration of localized cyclic deformation behavior of friction stir–welded joints via optical fiber sensors. Further detailed studies on the dislocation substructure evolution and texture development during cyclic deformation are needed.
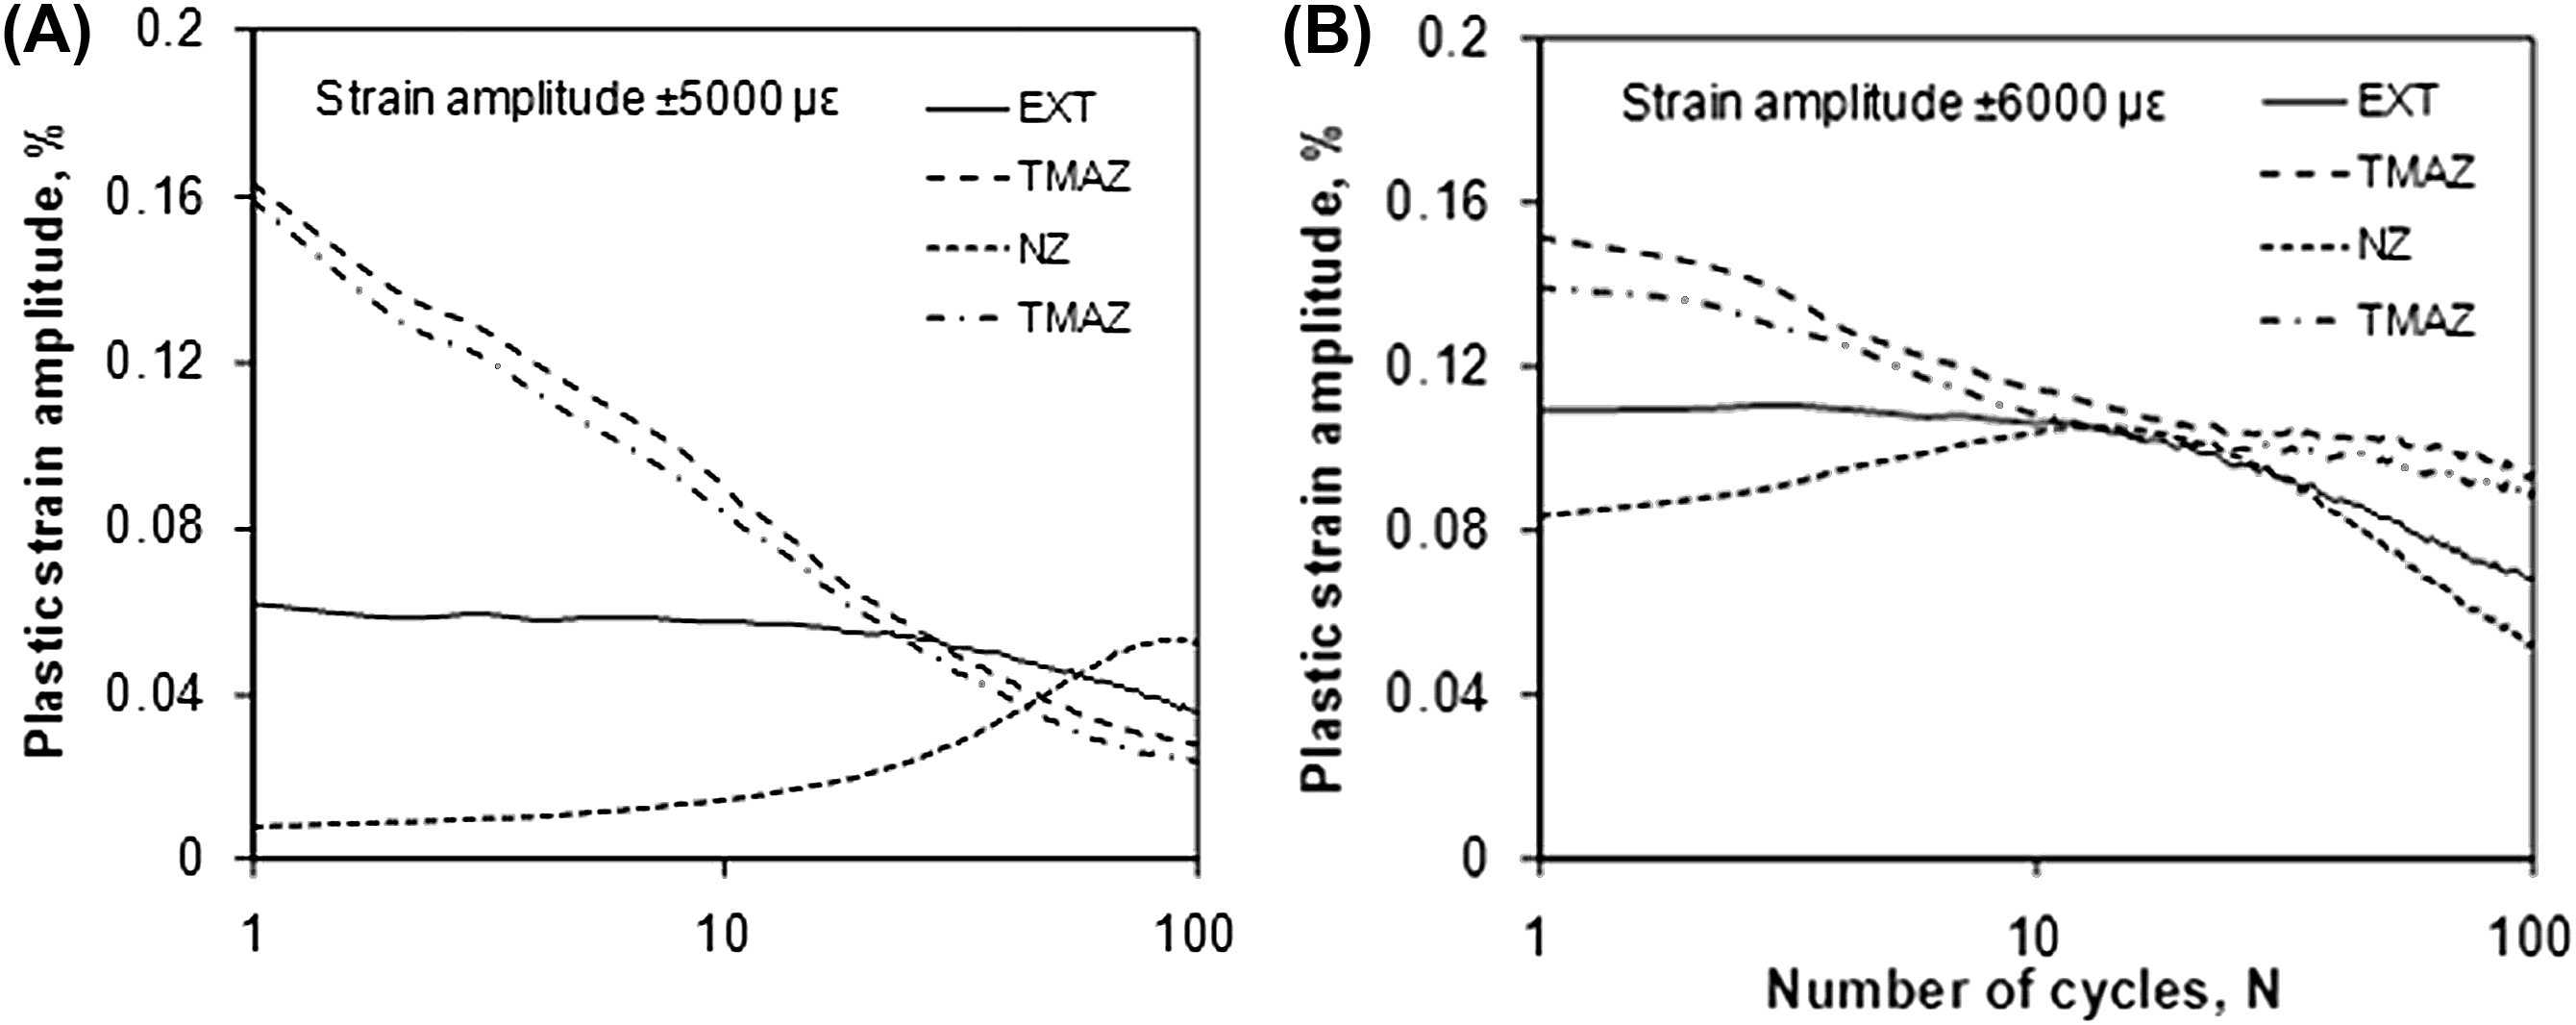
Figure 3.11 Variation in plastic strain amplitude of the friction stir–welded joint measured via three fiber Bragg grating sensors and an extensometer from the 1st to the 100th cycle at strain amplitudes of (A) ±5000 με and (B) ±6000 με. EXT, extensometer data; NZ, nugget zone; TMAZ, thermomechanical-affected zone.
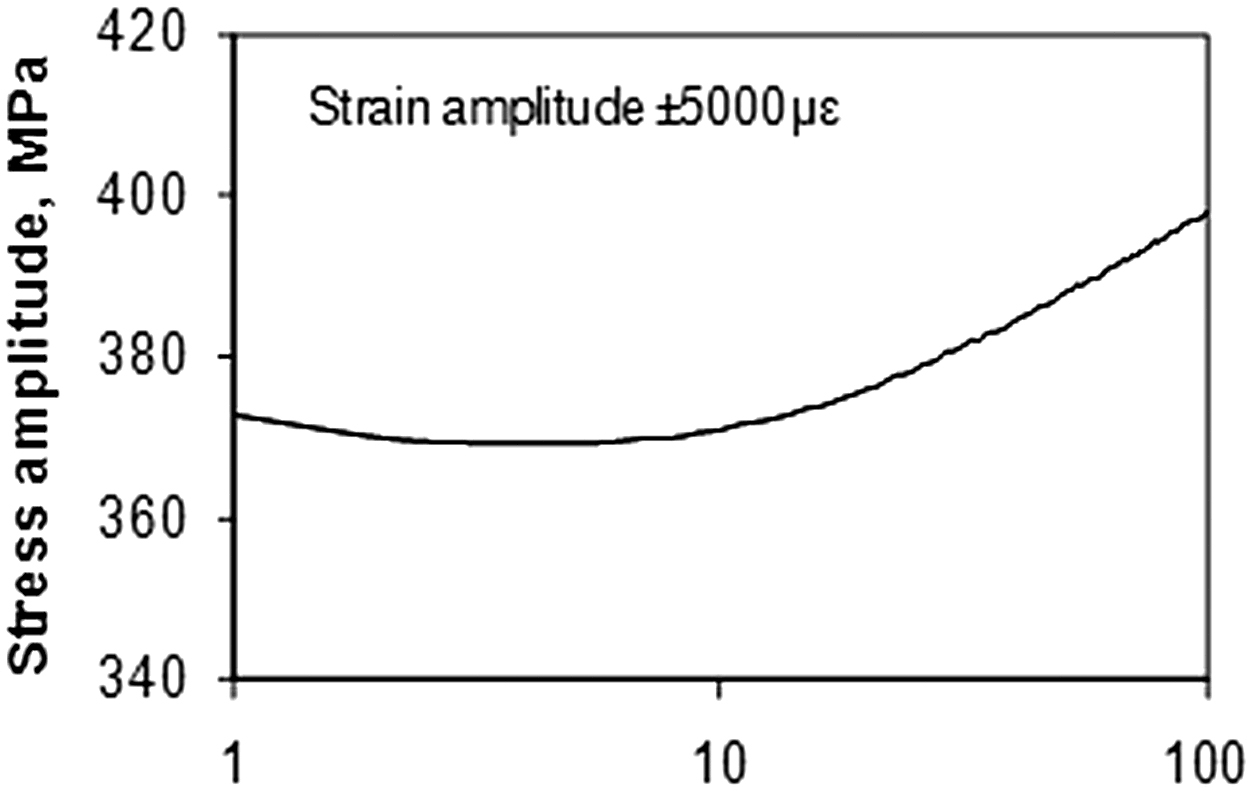
It can be seen from Fig. 3.11A and B that the plastic strain amplitude measured by the extensometer basically lay in between those measured in the NZ and in the boundary area, representing an average value over its gauge length and showing an overall decreasing trend (cyclic hardening). The overall cyclic hardening, after the initial approximately three cycles, was confirmed by the plot of stress response as a function of cyclic numbers (Fig. 3.12). As cyclic hardening occurred, the stress amplitude had to increase to keep the strain amplitude constant.
Because plastic deformation is basically not a reversible process, modifications to the structure of the weld joint could occur during cyclic strain. Different fatigue behaviors in the NZ and the TMAZ could be explained by their different initial material states after welding, as seen in Fig. 3.10. As the phenomenon of strain softening following by strain hardening in the NZ was not reported before, we propose the following explanation. Because the NZ experienced a higher temperature in the FSW process, there was an accumulation of residual stress in the NZ. The residual stress could affect significantly the mechanical properties, particularly the fatigue properties. Previous studies indicated that both longitudinal and transverse residual stresses exhibited an M-shaped distribution across the friction stir–welded joint. The maximum tensile residual stresses were located away from the weld centerline, i.e., the HAZ [8]. The fatigue cycling released the residual lattice strain that led to the strain softening observed. Once the strain-free condition in the NZ was reached, the strain hardening process would start, like in the rest of the FSW joint. This explanation was corroborated by the cycling test at the strain amplitude of ±6000 με (Fig. 3.11B), in which the strain softening was also observed in about 10 cycles in the NZ, reaching a maximum earlier at approximately the 20th cycle, since the fatigue cycling was carried out at large strain amplitudes. The difference in plastic strain amplitudes between the two zones was reduced to 0.07%, which can be explained by the fact that the same sample had been cycled at a lower strain amplitude from ±2000 to ±5000 με. It is interesting to note that the two zones reached the same hardness at approximately the 20th cycle. Strain hardening in fatigue cycling is generally caused by the mutual obstruction of dislocations gliding on the intersection systems.
3.4.4. Summary
We have demonstrated successfully the in situ measurement of localized strain in friction stir–welded samples during fatigue tests using a flat-cladding FBG sensor array. The 3-mm-long FBG sensors were surface mounted in the NZ and across the boundary between the TMAZ and the HAZ. Our experimental data showed significant differences in the deformation characteristics in the NZ and across the TMAZ–HAS boundary: cyclic hardening in the TMAZ and softening and then hardening in the NZ. The information obtained will help us to better understand the relationship between fatigue properties and FSW parameters for the purpose of optimizing the FSW process. This study also validated the effectiveness of the flat-cladding FBG sensors as a vital tool for the in situ measurement of localized strain to provide information that cannot be obtained from the conventional strain gauge or extensometer.
3.5. Application in Asymmetric Fatigue Deformation of a Magnesium Alloy
3.5.1. Motivation
Because of their light weight, high strength-to-weight ratio, and high specific stiffness, wrought magnesium alloys have become more attractive than the conventional structural materials, i.e., steel and aluminum alloys [17–19]. Although numerous studies have been conducted on the tensile and compressive properties of magnesium alloys, only a limited amount of work has been done on strain-controlled LCF and cyclic deformation behavior [20–22], which are required in the design and life estimates of automotive structural components. While the presence of strong tension–compression asymmetry was reported for extruded magnesium alloys when loaded in the extrusion direction, systematic studies are still lacking. In cyclic deformation tests an extensometer is normally used to measure the strain. It is unclear if the deformation within the gauge length of the extensometer is uniform, because of the presence of strong crystallographic texture in the extruded magnesium alloys. It is thus necessary to measure and examine the strain distribution and variation within the gauge length of the extensometer, especially at larger strain amplitudes. The conventional thin-film strain gauge cannot be used to measure large strains during cyclic deformation; and the extensometer, while capable of gauging large strain amplitudes, is relatively large in size, so it measures only an averaged strain value over its gauge length. Optical fiber sensors, particularly FBG sensors, owing to their wide dynamic range, immunity to electromagnetic interference, and multiplexing capability, have become increasingly popular in mechanical tests since about 2005 [4]. An FBG optical fiber sensor with a diameter of 125 μm could be made as short as 2–5 mm in length. In 2010 we reported newly developed flat-cladding optical FBG sensors for the measurement of large strain amplitudes of up to ±8000 με in LCF tests [13]. The sensors were successfully applied to the characterization of localized cyclic strain variations in a friction stir–welded aluminum alloy [23].
In this section, we report the application of flat-clad FBG optical fiber sensors in the study of fatigue properties of an extruded magnesium alloy during cyclic deformation. The large asymmetric fatigue deformation characteristics at strain amplitudes of up to ±6000 με are presented here and discussed.
3.5.2. Sample Preparations
Magnesium alloy plates 7 mm thick (commercial AZ31), with a composition of 3.1 Al/1.05 Zn/0.54 Mn/0.0035 Fe/0.0007 Ni/0.0008 Cu and the balance Mg (wt%), were extruded in a temperature range of 360°C–382°C at an extrusion exit speed of 50.8 mm/s. The applied extrusion ratio was ∼6, and the alloy was air cooled after extrusion.
The FBG array had three FBG sensors at 1528.94, 1536.10, and 1543.20 nm, respectively. Following ASTM E8 standards, subsized fatigue specimens were machined and ground with SiC papers up to grit 600 to remove the machining marks and to achieve a consistent and smooth surface. Total strain-controlled, push–pull-type LCF tests were carried out on the computerized Instron fatigue testing system. In the fatigue testing, a triangular waveform with a strain ratio of R = −1 was applied at a constant strain rate of 1 × 10⁻² s−1. The sample was tested from a cyclic strain amplitude of ±1000 με for 100 cycles with an increment of ±1000 με at each cyclic strain amplitude level. An extensometer 25 mm in gauge length was used to measure the strain and provide feedback to the fatigue system under strain control. During the LCF tests the wavelength shifts of the FBGs were recorded via a sensor interrogation system (Model si425, Micron Optics) and then were converted into the strain by a gauge factor of 1.25 με/pm.
To ensure that the surface-mounted flat-cladding FBG sensors would not chirp or slip under the large strain amplitude, we first bonded three FBG sensors to an aluminum-based alloy and measured their spectra at zero, maximum, and minimum load after 100 cycles at a strain amplitude of ±7000 με [13]. The spectra displayed no obvious bandwidth broadening nor changes in spectral shape or relative wavelength spacing between the FBGs, which validated that there was no chirp or slippage occurring between the fiber sensor and the substrate at the three load levels.
3.5.3. Results and Discussion
3.5.3.1. Stress–Strain Hysteresis Loops of AZ31 Extruded Magnesium Alloy
The hysteresis loops of the AZ31 extruded magnesium alloy sample measured via the FBG sensor array are illustrated in Fig. 3.13 at different total strain amplitudes. One can see that at the lower cyclic strain levels (such as ±1000 and ±2000 με), the alloy showed almost no plastic deformation and the compressive stress was almost the same as the tensile stress. With increasing total strain amplitude, the asymmetry between the tensile and the compressive stresses started to appear and then grew progressively. At the higher strain amplitudes (such as ±5000 and ±6000 με) a significant difference between the tensile and the compressive stresses was observed. This was basically due to the activity of twinning in compression in the descending phase and subsequent detwinning in tension in the ascending phase [22,24,25]. At strain amplitudes higher than ±6000 με, chirp and slippage of the FBG sensors were observed.

Figure 3.13 Hysteresis loops of AZ31 extruded magnesium alloy measured via the fiber Bragg grating sensor array at the (A) 1st cycle, (B) 2nd cycle, (C) 10th cycle, and (D) 100th cycle at different total strain amplitudes from ±1000 to ±6000 με.
Another feature observed was that the hysteresis loops of the initial cycles (first and second cycles, Fig. 3.13A and B) at higher strain amplitudes were more skewed (i.e., more twisted clockwise) than those of the subsequent cycles (e.g., 100th cycle, Fig. 3.13D). That is, the skewness of the hysteresis loops became less obvious with increasing number of cycles, with a typical example shown in Fig. 3.14. This phenomenon was associated with the presence of cyclic hardening [22], in which the occurrence of twinning in more grains enhanced the resistance of further twinning and dislocation movement, since twin boundaries can act both as dislocation barriers and as multipliers during plastic deformation.
More details can be obtained from Fig. 3.14, which shows the variation in hysteresis loops of the extruded magnesium alloy sample at four different cycle numbers tested at a total strain amplitude of ±5000 με. It is observed that the peak tensile stress (maximum stress) increased from 147 MPa at the first cycle monotonically to 178 MPa at the 100th cycle, while the peak compressive stress (minimum stress) decreased from −117 MPa at the first cycle to −125 MPa concurrently. The change in the peak tensile stress of 31 MPa was much higher than that in the peak compressive stress (8 MPa). Indeed, the ratio of compressive to tensile stress reduced with increasing number of cycles, from 0.79 for the first and second cycles, down to 0.77 for the 10th cycle and further down to 0.69 for the 100th cycle. This suggested that the cyclic hardening was stronger in tension than in compression as cyclic deformation progressed. The possible explanation behind this would be that the formation of residual twins became more saturated in the later cycles. As mentioned earlier, twinning occurred in compression and partial detwinning occurred in tension [22–29]. Twinning and detwinning at the crack tip of pure aluminum have been observed as well during tensile straining under a transmission electron microscope [30]. Molecular dynamics simulations indicated that twin boundaries act as obstacles to the movement of dislocations that lead to the strengthening of nanotwinned polycrystalline materials under tensile loading [31–33]. In particular, a 2009 study using an X-ray diffraction method revealed that the basal and prismatic slips of dislocations were mainly activated during tensile deformation, while the twinning and basal slip of dislocations were mainly activated during compressive deformation [27]. At the initial stage of compressive deformation, the twinning accommodated a large portion of the applied strain. Such a twin activation was responsible for the relatively low flow stress and relatively small hardening rate at the initial stage of compressive deformation. As the compressive deformation proceeded, most of the compressive deformation was accommodated by the basal slip [27]. The skewness of the observed hysteresis loops and the evolution of the tension–compression asymmetry are thus related to the difference in the deformation mechanisms between tension and compression as well as the interaction between the residual twins and the slip of dislocations.

3.5.3.2. Plastic Strain Amplitude
Plastic strain amplitude (the half-width of the stress–strain hysteresis loops at zero stress) is a key parameter in LCF tests, because it is directly associated with the fatigue life of structural components via the well-known Coffin–Manson relationship [34]. Thus we compared the measured plastic strain amplitudes from three FBG optical fiber sensors (labeled as a1s1, a1s2, and a1s3) with that from the extensometer (labeled as EXT) for all 100 cycles at both high cyclic strain amplitude of ±6000 με and intermediate cyclic strain amplitude of ±3000 με in Fig. 3.15. Good agreement was observed not only in the magnitude but also in the trend of strain variation. The monotonic decrease in the plastic strain amplitude with increasing number of cycles reflected that cyclic hardening occurred in the entire process, from the first cycle at a high strain amplitude of ±6000 με (Fig. 3.15A). However, at a lower strain amplitude of ±3000 με the plastic strain amplitude first increased within the initial 10–20 cycles, and then decreased as the cyclic deformation progressed (Fig. 3.15B). This indicated that cyclic softening occurred initially, followed by cyclic hardening. Such variation characteristics evaluated from the three FBG optical fiber sensors are in good agreement with those reported in Ref. [13]. The largest difference in the plastic strain amplitudes measured via three FBG optical fiber sensors was about 0.005%, which was only about 0.83% of the cyclic strain amplitude of ±6000 με applied. This clearly demonstrated the consistency and reliability of FBG optical fiber sensors used for fatigue testing.
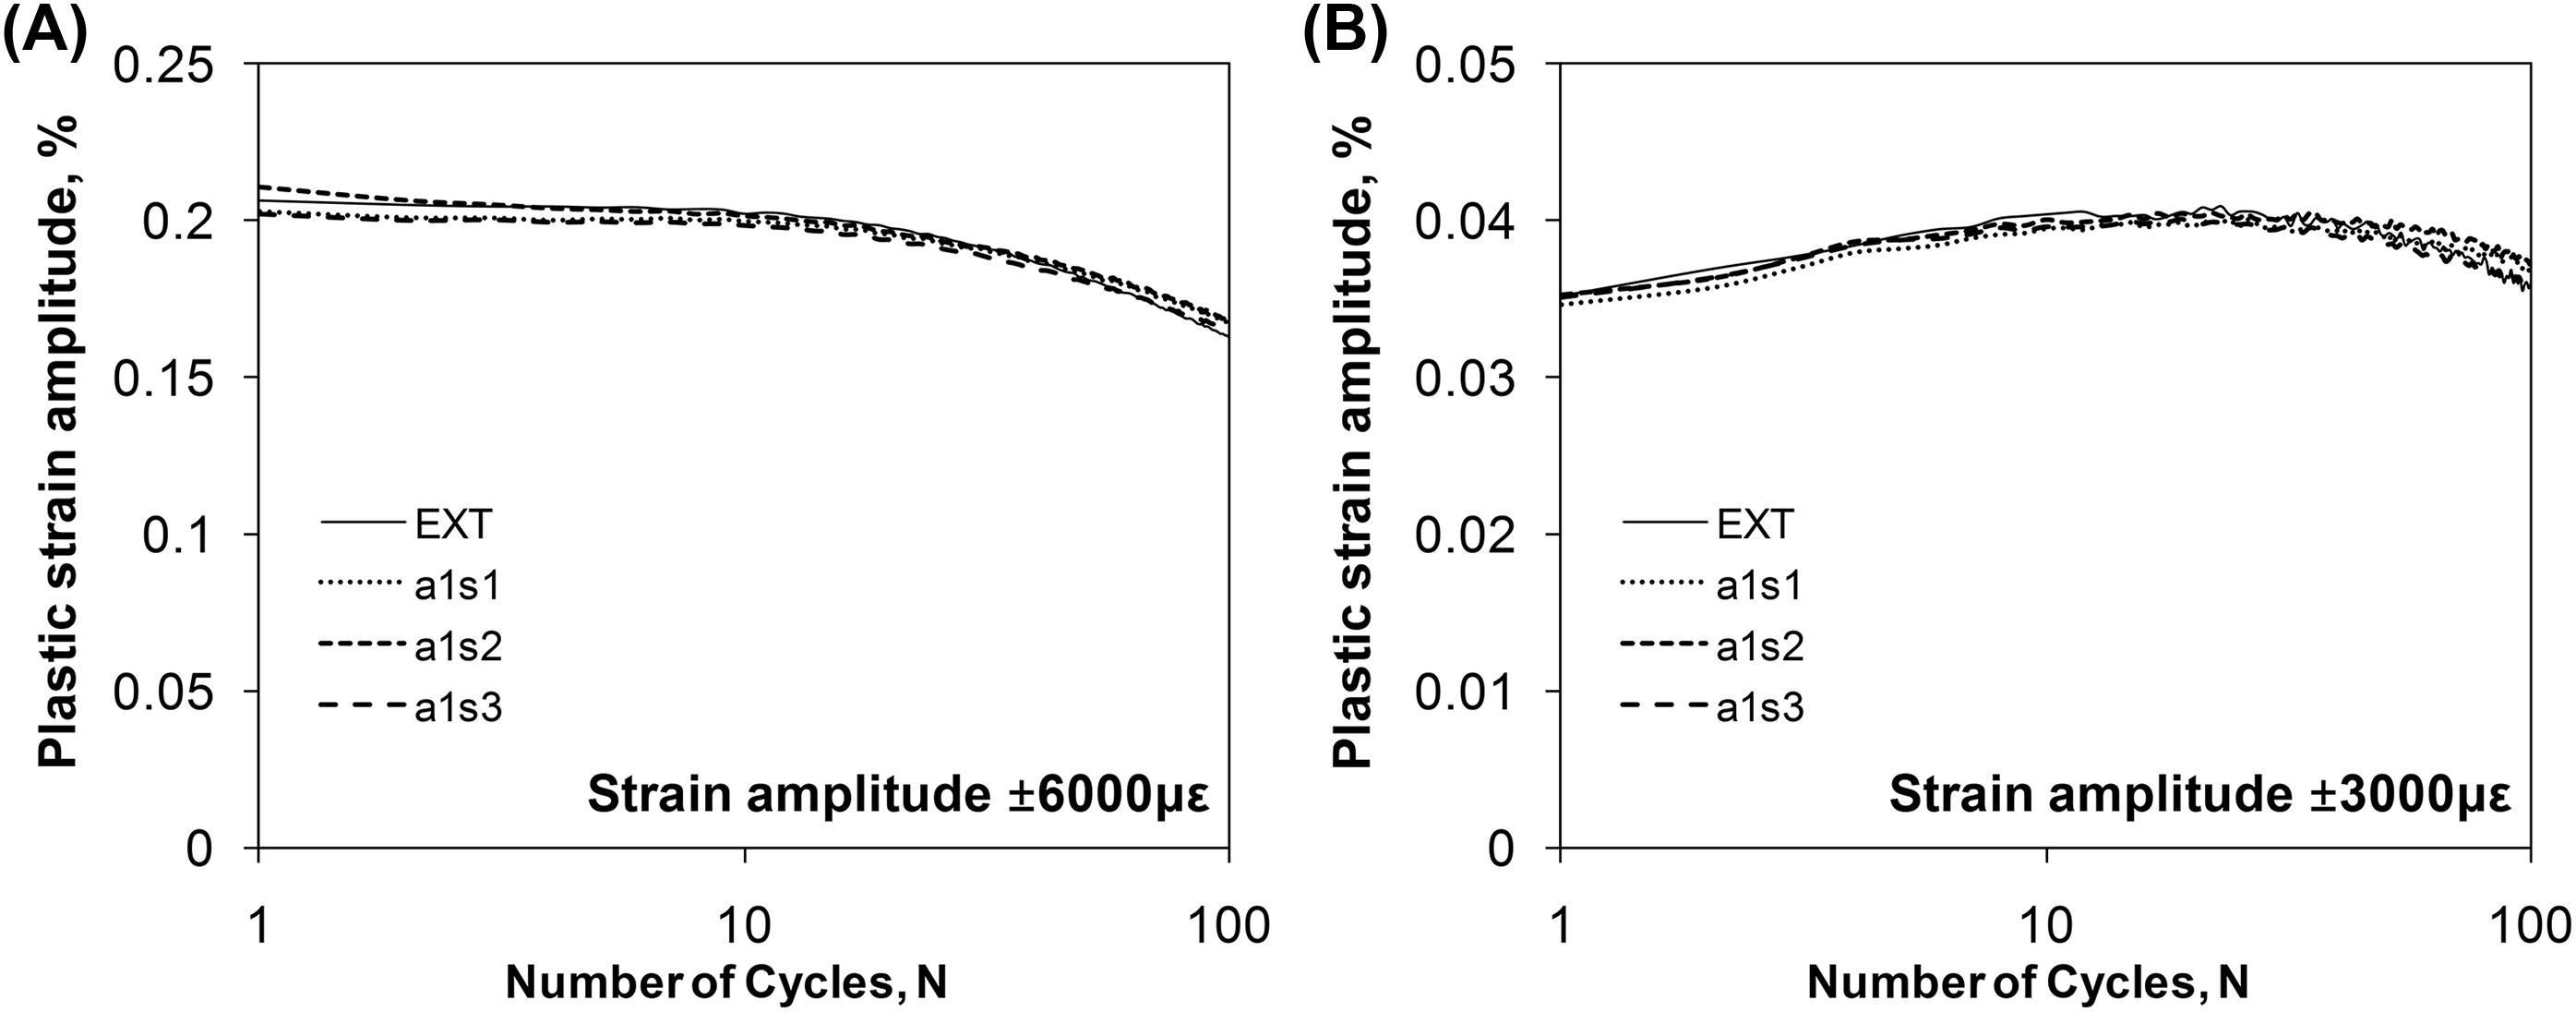
Figure 3.15 Plastic strain amplitudes of AZ31 extruded magnesium alloy measured by fiber Bragg grating optical fiber sensors at strain amplitudes of (A) ±6000 με and (B) ±3000 με. a1s1, sensor 1 of array 1 data, and so on for a1s2 and a1s3; EXT, extensometer data.
The measurements from FBG optical fiber sensors indicated that at lower total strain amplitudes (±1000 and ±2000 με), the plastic strain amplitudes from both the FBG optical fiber sensors and the extensometer were essentially the same and remained nearly constant from the 1st to the 100th cycle. At a total strain amplitude of ±3000 με, while the cyclic hardening–softening could be identified, the plastic strain amplitudes from both the FBG sensors and the extensometer exhibited a relatively small variation between 0.035% and 0.040% from the 1st to the 100th cycle (Fig. 3.15B). Then, as the total strain amplitude increased, the initial plastic strain amplitude increased, and during cyclic deformation it decreased more significantly. For instance, at a total strain amplitude of ±6000 με, the plastic strain amplitude started from 0.21% at the first cycle and ended at 0.17% at the 100th cycle, representing a 20.4% reduction in the initial plastic strain amplitude.
The occurrence of cyclic hardening was also reflected by the increase in stress amplitude, as shown in Fig. 3.16. It can be seen that at a lower strain amplitude of ±3000 με, the stress amplitude showed a slight decrease or very little change for the initial cycles and then increased only slightly as cyclic deformation proceeded, while at a higher strain amplitude of ±6000 με, the stress amplitude increased noticeably from 137 to 164 MPa during 100 cycles. The agreement between the plastic strain amplitude values measured via the three FBG optical fiber sensors and the extensometer at different levels of total strain amplitude indicated that the application of FBG sensors in characterizing cyclic deformation characteristics of an extruded AZ31 magnesium alloy is feasible and successful.
3.5.4. Summary
We have successfully applied a flat-cladding FBG sensor array for the characterization of cyclic deformation of an extruded AZ31 magnesium alloy in LCF tests. Asymmetric stress–strain hysteresis loops were observed to increase with increasing strain amplitude. The information obtained helped us to understand better the twinning and detwinning behavior of the extruded magnesium alloy in the presence of strong crystallographic texture during cyclic deformation. The results obtained via FBG optical fiber sensors also demonstrated the skewness of the hysteresis loops, and validated that cyclic hardening occurred at higher strain amplitudes. Last but not least, the data of plastic strain amplitudes determined from the FBG optical fiber sensors showed a nearly perfect agreement with those obtained from the extensometer. The agreement validated that the flat-cladding FBG optical fiber sensor array can be a vital tool for researchers and engineers in the measurement of large cyclic or dynamic strain amplitudes to evaluate the fatigue properties of new materials and estimate the fatigue life of key structural components.

3.6. Conclusions
We have successfully demonstrated new flat-cladding FBG sensors for the measurement of large cyclic strain variations. The large contact area between the flat-cladding and the flat substrate, along with the application of a new bonding process, has significantly increased the bonding strength, which provides a proper transfer of the strain from the substrate to the optical fiber. Our test data showed that the flat-cladding FBG sensors can be used to measure cyclic strain amplitude as large as ±8000 με in dynamic fatigue tests under the current test conditions. This represents a remarkable increase in the strain measurement that could make the FBG sensor a vital tool in LCF tests at large strain amplitudes. To the best of our knowledge, other than the FBG sensors embedded inside carbon fiber reinforced polymers, there is no surface-mounted FBG sensor that could withstand such high cyclic strain amplitudes. Furthermore, owing to their small size, FBG sensors could be used to measure localized strain variations, for example, in welding joints; detect fatigue crack initiation; and determine crack closure effect during fatigue crack propagation. We have reported the application of this sensor to measure localized strain variation in a friction stir–welded sample [23] including high strain amplitude tests and the bonding process. So far the flat-cladding FBG sensors were used in two applications: (1) in the measurement of localized strain variation in a friction stir–welded sample, in which we observed significant differences in the deformation behavior of different zones, and (2) in the characterization of asymmetric fatigue deformation of an extruded magnesium alloy, in which drastic asymmetric stress–strain hysteresis loops were observed. The results from these applications show that this sensor can be used as a new tool for researchers and engineers in the development and testing of new materials and mechanical structures for which the testing and monitoring of large cyclic strain amplitudes are critically needed.
..................Content has been hidden....................
You can't read the all page of ebook, please click here login for view all page.