
oradebug
There are various ways in which one session can affect how another session behaves. One of the oldest and easiest is the oradebug utility, which you can take advantage of if your account has sysdba privileges. Many of the things you can do with oradebug you can also do by setting events, so some of the tricks listed in this section will reappear in different guises later on.
Suspending Processes
Some of the things I did to get a better understanding of dbwr and lgwr required those processes to stop. Oradebug allows you suspend and resume a process. The first thing to do is to attach to an Oracle process, which I tend to do by using the pid from v$process. There are many simple queries you can write to find the process id for a background process, and the following is an example that probably works across many versions of Oracle (though there are simpler options from 10g and later):
select

        prc.pid

from

        v$bgprocess    bgp,

        v$process      prc

where

        bgp.name = 'LGWR'

and     prc.addr = bgp.paddr

;
On the system I'm looking at right now this query returns the value 6, which I use as follows (warning: do not do this on a system that anyone else is using—you may find that the instance crashes, or that the process can't be made to resume):
SQL> oradebug setorapid 6

Windows thread id: 1052, image: ORACLE.EXE (LGWR)

SQL> oradebug suspend

Statement processed.

SQL> -- get some other session to do a little work and commit

SQL> -- it will hang on the commit, waiting on log file sync.

SQL> oradebug resume

Statement processed.

SQL>
Suspending lgwr is particularly risky. Don't forget that there may be some recursive SQL going on that will make sessions hang; for example, if you have database auditing enabled with audit connect, any ordinary end-user sessions trying to connect or disconnect will hang because their connection will try to commit after inserting or updating a row in sys.aud$.
One particular use I made of the suspend mechanism was to demonstrate that one of my long-held assumptions (that pmon detected local instance deadlocks) was wrong. I had actually made this observation in the original manuscript, and one of my reviewers pointed out that I was wrong—so I suspended pmon, set up a deadlock situation, and waited for the ORA-00060 "Deadlock detected" error; sure enough, even with pmon suspended, the deadlock was still trapped and reported within the (fairly standard) 3 seconds.
Dumps
You can use oradebug to dump memory structures to trace files. When I do this I usually connect as sys and then attach oradebug to my own process to generate the dumps. Once you're in oradebug, there is a command to show the trace file name, but it seems to work only after the first use of the trace file; however, you can modify the trace file name by setting the tracefile_identifier, and this counts as a first use:
SQL> oradebug setmypid

Statement processed.

SQL> oradebug tracefile_name

Statement processed.

SQL> alter session set tracefile_identifier = xxx;


Session altered.


SQL> oradebug tracefile_name

c:oracleadmind10gudumpd10g_ora_2256_xxx.trc

SQL>
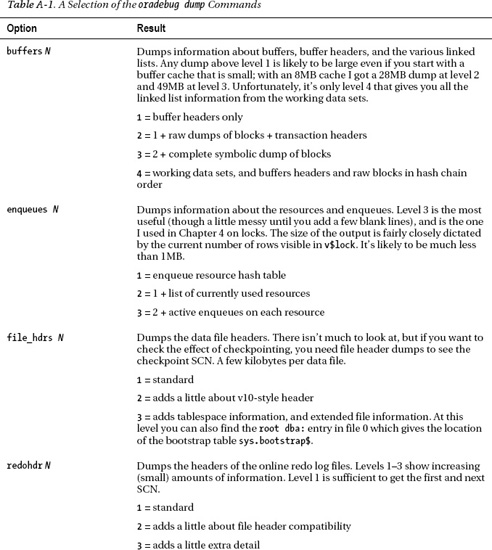
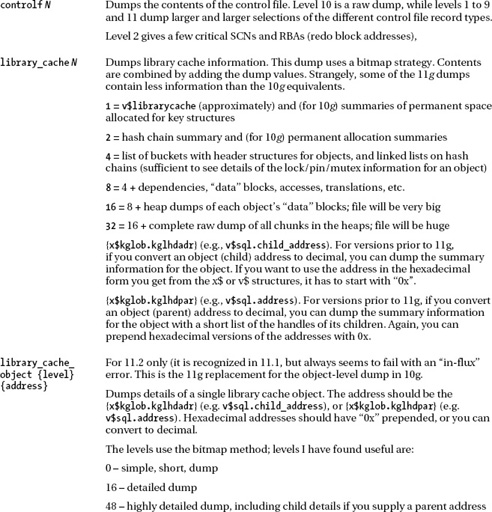
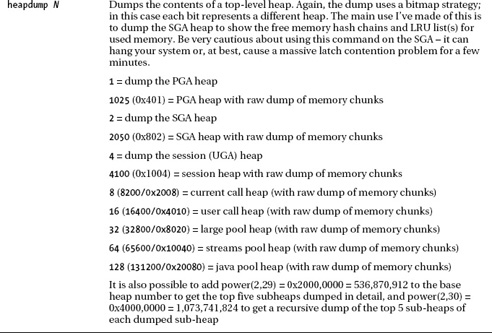
If you want to see a list of all the available dumps, the command is oradebug dumplist. Many dump commands take two parameters—the name of the dump and the level at which to dump. The dump level then tends to follow two patterns: one is simply the higher the level the more that gets dumped; the other is a bitmap approach, where different powers of 2 result in different dumps. Table A-1 lists the dump commands I used in the course of writing this book. The effects are not consistent across versions; this table covers 10g+.
Peeking at Memory
There are two main strategies I use to examine the contents of particular memory locations: knowing the names and peeking at memory. If you know the name of an Oracle variable, you can use the dumpvar command to see its value. For example, I happen to know that there is a variable called kcbnhb (kcb is about the buffer cache, nhb is the number of hash buckets) in the SGA, so I can use oradebug as follows:
SQL> oradebug setmypid

Statement processed.

SQL> oradebug dumpvar sga kcbnhb

uword kcbnhb_ [3D387B4, 3D387B8) = 00008000

SQL>
Generically, that's dumpvar {area} {variable}. So, for example, since I know that the current session value for use_stored_outlines is in a variable called ugauso_p, I can do the following:
SQL> alter session set use_stored_outlines = rule_based;


Session altered.


SQL> oradebug setmypid

Statement processed.

SQL> oradebug dumpvar uga ugauso_p

qolprm ugauso_p [7867A44, 7867A68) = 00000001 5552000A 425F454C 44455341

SQL>
If you know your hex and ASCII you will be able to see the text "RULE_BASED" in the last 12 bytes of the dump, starting with the length of 10 (0x000A).
If you need to find out the names of the variables in the SGA, you can query the structure x$ksmfsv (in this example I've picked a subset, but there are several thousand to choose from) and start making guesses about what the names and types mean:
select

        *

from        x$ksmfsv

where        ksmfsnam like 'kcbn%'

;


ADDR      INDX INST_ID KSMFSNAM     KSMFSTYP KSMFSADR KSMFSSIZ

-------- ----- ------- ------------ -------- -------- --------

034F9E50   2285      1 kcbnbh_      word     03D37B28            4

034F9E60   2286      1 kcbnbha_     word *   03D37B2C            4

034F9E80   2288      1 kcbnwp_      word     03D37B34            4

034FAF00   2552      1 kcbnbf_      word     03D387B0            4

034FAF10   2553      1 kcbnhb_      uword    03D387B4            4

034FAF20   2554      1 kcbnhbsft_   uword    03D387B8            4

034FB090   2577      1 kcbnpg_      ub4      03D38814            4

034FB160   2590      1 kcbnchkl_    ub1      03D38868            1

034FB170   2591      1 kcbnchk_     int      03D3886C            4

034FBA40   2732      1 kcbnf01_     uword    03D38CE0            4

034FBA50   2733      1 kcbnf02_     uword    03D38CE4            4
Each row in x$ksmfsv holds the starting address of a variable (you will notice that the names—ksmfsnam—in this view have an underscore at the end, which you have to remove when you use them with the dumpvar option).
![]() Note If you don't want to query
Note If you don't want to query x$ksmfsv (that's kernel services – memory – fixed SGA variables, by the way), there is a special dump command for it, and for the equivalent structure in your PGA and UGA: oradebug dump global_area N, where—like the heapdump references in Table A-1, but with a short list of legal values—N is 1 for the PGA, 2 for the SGA, and 4 for the UGA. (You can also multiply each by 1025 to see a raw dump of the large structures referenced by the various pointers.)
We could access the variables by name using dumpvar, but most of these variable are simple numbers (although one is a pointer to a number) so we have two other strategies to access them very easily. First, we can peek at the address—remembering to show that it is a hex value. For example, here's another way to check the number of hash buckets is
SQL> oradebug setmypid

Statement processed.

SQL> oradebug peek 0x03D387B4 4

[3D387B4, 3D387B4) = 00008000
The peek command takes two mandatory parameters and one optional one. The first two are the address and length, the last is a flag to tell Oracle to dump the result to your trace file. In this example I've told Oracle to display 4 bytes (which is the minimum on this platform anyway) but not send the result to the trace file.
But if you've got the address, you can query memory directly. The structure x$ksmmem is indirectly a memory map of the SGA, so we can query the contents of memory 4 bytes at a time. Here's another check on the number of hash buckets:
SQL> select * from x$ksmmem where addr = hextoraw('3D387B4'),


ADDR       INDX INST_ID KSMMMVAL

-------- ------ ------- --------

03D387B4  12069       1 00008000


1 row selected.
You have to be very careful in the way you use x$ksmmem. If you use an address that isn't currently mapped, your session will crash with Oracle error ORA-03113, "end-of-file on communication channel," and the same will happen if your SQL manages to produce an execution path with any predicate that Oracle can't turn into addr = raw_value.
The option to query memory directly may seem fairly limited, but there aren't any good methods to query memory from, which is why some companies (and adventurous individuals) have written low-level programs that attach directly to Oracle's memory to read it. However, I did feel the need to check the content of the log buffer from time to time while writing this book, so when I wanted to look at it, peeking was a good enough start.
Here's a little SQL that will extract a few details about the public redo threads:
select

        first_buf_kcrfa,

        last_buf_kcrfa,

        pnext_buf_kcrfa_cln,

        next_buf_num_kcrfa_cln

from

        x$kcrfstrand

where

        last_buf_written_kcrfa != '00'

order by

        indx

;

FIRST_BU LAST_BUF PNEXT_BU NEXT_BUF_NUM_KCRFA_CLN

-------- -------- -------- ----------------------

05450000 057A4800 05552E00a                  2070

057A4A00 05AF9200 05AF9400                   6820


2 rows selected.
The first_buf_kcrfa and last_buf_kcrfa are the addresses of the first and last buffers (i.e., pages matching the log file block size) of the two public log buffers in my system. The pnext_buf_kcrfa is the address of the next buffer that will be used and then written to disk. With this information I could, with a little effort, and after getting some easily identifiable data into the log buffer, use oradebug to peek at the contents of the log buffer. Since each page in the log buffer is 512 bytes (which is more than Oracle will display onscreen) I would normally use oradebug peek {address} 512 1 to dump the data to the trace file one page at a time; but for the purposes of the book, here's a dump of the next few buffer pages, showing only the first 16 bytes of each page—which happen to be the header bytes for the page:
SQL> oradebug peek 0x05552e00 16

[5552E00, 5552E10) = 00002201 000022BE 000002E9 D67F80A8

SQL> oradebug peek 0x05553000 16

[5553000, 5553010) = 00002201 000022BF 000002E9 9B6B8010

SQL> oradebug peek 0x05553200 16

[5553200, 5553210) = 00002201 000022C0 000002E9 509980D0

SQL>
You will notice that the third word in each page (000002e9) evaluates to 745, which is the sequence# of my current redo log. The second word is the block id within the log file that this page of memory will be written to. (Unfortunately, I have no idea what the leading 00002201 represents.) I was more interested in checking the data, and cross-checking the raw dump of memory with the symbolic dump from the file—which we will be coming to shortly.