
THE PMP EXAM CONTENT FROM THE MONITORING AND CONTROLLING THE PROJECT PERFORMANCE DOMAIN COVERED IN THIS CHAPTER INCLUDES THE FOLLOWING:
Ensure Project Deliverables Conform to Quality Standards
Measure Project Performance
Verify and Manage Changes to the Project
Monitor All Risks

I'll cover the Monitor and Control Risks, Control Costs, Control Schedule, Perform Quality Control, Verify Scope, and Control Scope processes in this chapter.
Monitor and Control Risks monitors the project for risks and monitors the risk response plans that have been put into action or might need to be put into action. The Control Cost and Control Schedule processes are similar to Perform Integrated Change Control, which we discussed in the last chapter. Remember when you're reading these sections that the information from the Perform Integrated Change Control process applies to these areas as well.
The Perform Quality Control process involves several new tools and techniques that might show up on the exam. Take some time here to understand the tools and techniques in the Perform Quality Control process and to differentiate them from the tools and techniques associated with the Plan Quality and Perform Quality Assurance processes.
Verify Scope involves verifying and accepting work results. Control Scope is like the change control processes I discussed in Chapter 10 and is concerned with controlling changes to project scope.
The Monitor and Control Risks process involves implementing response plans, tracking and monitoring identified risks, and identifying and responding to new risks as they occur. You will examine performance information, and use the tools and techniques of this process, to analyze and implement other functions of this process, including the following:
Evaluating risk response plans that are put into action as a result of risk events
Monitoring the project for risk triggers
Reexamining existing risks to determine if they have changed or should be closed out
Monitoring residual risks
Reassessing project assumptions and determining validity
Ensuring that policies and procedures are followed
Ensuring that risk response plans and contingency plans are put into action appropriately and are effective
Ensuring that contingency reserves (for schedule and cost) are updated according to the updated risk assessment
Evaluating the overall effectiveness of the Risk processes
Monitor and Control Risks is a busy process. During the course of the project, risk responses, which were developed during the Planning process group, have been implemented and have reduced or averted the impact of risk events (or you hope they did).
Risk register
Project management plan
Work performance information
Performance reports
You'll recall that the risk register tracks and ranks individual risks, identifies the risk owner, describes risk triggers and residual risks, and lists the response plans and strategies you should implement in the event of an actual risk event. Keep in mind that some risk events identified in risk planning will happen and some will not. You will have to stay alert for risk event occurrences and be prepared to respond to them when they do occur. This means you should monitor the risk register regularly.
Work performance information includes information that may help you identify that a new risk event is about to occur, or it may assist you in monitoring previously identified risks. Work performance information includes elements such as the status of deliverables, costs to date, cost changes, schedule progress to date, schedule changes, and/or scope changes.
Performance reports include information such as status reports, performance measurements, and forecasts. These should also be examined from the perspective of risks or risk response plans that might need close monitoring or changes to the response plans to coincide with the performance reports data.
Additional risk response planning might be needed to deal with the new risks or with expected risks whose impact might be greater than expected. This might require repeating the Plan Risk Responses process to create new contingency plans or alternative plans to deal with the risk, or it might require modification to existing plans.
The tools and techniques of Monitor and Control Risks are used to monitor risks throughout the life of the project. You should perform periodic reviews, audits, and new earned value analyses to check the pulse of risk activity and to make certain risk management is enacted effectively.
The tools and techniques of this process are as follows:
You'll look at risk reassessment, risk audits, and technical performance measurements next. You've examined all the other tools and techniques of this process in discussions of previous processes.
Periodic, scheduled reviews of identified risks, risk responses, and risk priorities should occur during the project. The idea here is to monitor risks and their status and determine whether their consequences still have the same impact on the project objectives as when they were originally planned. Every status meeting should have a time set aside to discuss and review risks and response plans.
Risk identification and monitoring is an ongoing process throughout the life of the project. Risks can change, and previously identified risks might have greater impacts than originally thought as more facts are discovered. Reassessment of risks should be a regular activity performed by everyone involved on the project. Monitor the risk register, including those risks that have low scores, and risk triggers. You should also monitor the risk responses that have been implemented for their effectiveness in dealing with risk. You might have to revisit the Perform Qualitative and Perform Quantitative Risk Analysis processes when new risk consequences are discovered or risk impacts are found to be greater than what was originally planned.
Risk audits are carried out during the entire life of the project by risk auditors. Risk auditors are not typically project team members and are expertly trained in audit techniques and risk assessment. Risk audits are specifically interested in examining the implementation of response plans and their effectiveness at dealing with risks and their root causes.
This tool and technique compares the technical accomplishments of project milestones completed during the Executing processes to the technical milestones defined in the project Planning processes. Variances might indicate that a project risk is looming, and you'll want to analyze and prepare a response to it if appropriate. For example, a technical milestone for a new computer software project might require that the forms printed from a particular module include a bar code at the bottom of the page. If the bar code functionality does not work once the module is coded, a technical deviation exists, which means you should reexamine project risks. In this particular example, project scope is likely at risk.
Monitor and Control Risks should occur throughout the life of the project. Identified risks are monitored and plans are reexamined to determine whether they will adequately resolve the risk as it approaches during this process. Several outputs might come about as a result of monitoring risks:
Risk register updates
Organizational process assets updates
Change requests (recommended corrective and preventive actions)
Project management plan updates
Project document updates
I've discussed these outputs before, so I'll just bring to your attention the new points you need to know here about risk register updates and change requests.
The risk register should be updated under two conditions. The first condition is when a risk audit or risk reassessment concludes that some element of the original risk information has changed—for example, the impact or probability scores are updated to reflect new conditions, the priority of the risk has changed, or the response plan has been updated. The second condition for updating the risk register is when the risk needs to be closed. If a risk event occurs, you'll record that in the risk register along with the effectiveness of the response plan. This information becomes an input to the Close Project Process, which I'll cover in the next chapter.
Change requests must be processed through the Perform Integrated Change Control process. You might find that a workaround is needed when implementing a requested change or recommended corrective action. A workaround is an unplanned response to a negative risk event. It attempts to deal with the risk in a productive, efficient manner. If no risk response plan exists (this might be the case when you accept a risk event during the Planning process) or an unplanned risk occurs, workarounds are implemented to deal with the consequences of the risk.
The Control Costs process monitors the project budget and manages changes to the cost baseline. It's concerned with monitoring project costs to prevent unauthorized or incorrect costs from being included in the cost baseline. This means you'll also use Control Costs to assure that the project budget isn't exceeded (resulting in cost overruns). If a change is implemented, you'll have to make certain the budget for the changed item stays within acceptable limits. All budget changes should be agreed to and approved by the project sponsor where applicable (the criteria for approvals should be outlined in the change control system documentation). Stakeholders should also be made aware of budget changes.
The following list includes some of the activities you'll be involved in during this process:
Monitoring changes to costs or the cost baseline and understanding variances from the baseline
Monitoring change requests that affect cost and resolving them in a timely manner
Informing stakeholders of approved changes and their costs
Assuring the project budget does not exceed acceptable limits by taking action when overruns are imminent
The Control Costs process includes the following inputs:
Project management plan
Project funding requirements
Work performance information
Organizational process assets
These inputs are examined using the tools and techniques of this process to determine whether revised cost estimates or budget updates are required. One thing you should note regarding the project management plan input is that it includes the cost performance baseline and the cost management plan. You'll use the cost performance baseline to compare actual expenditures to date on the project to the baseline. The cost management plan details how costs should be monitored and controlled throughout the life of the project. I've covered each of these inputs in previous chapters.
The tools and techniques of the Control Costs process are as follows:
Earned value measurement (EVM)
Forecasting
To-complete performance index (TCPI)
Performance reviews
Variance analysis
Project management software
We'll look at each of these next with the exception of project management software. This output has been discussed previously, but you should know that in this process it can help automate and calculate the formulas we're going to examine next. It can also display the results in graphical form for status reporting purposes.
You can accomplish performance measurement analysis using a technique called earned value measurement (EVM). Simply stated, EVM compares what you've received or produced to what you've spent.
The EVM continuously monitors the planned value, earned value, and actual costs expended to produce the work of the project (I'll cover the definition of these terms shortly). When variances that result in cost changes are discovered (including schedule variances and cost variances), those changes are managed using the project change control system. The primary function of this analysis technique is to determine and document the cause of the variance, to determine the impact of the variance, and to determine whether a corrective action should be implemented as a result. We'll walk through various examples of how to determine these variances later in this section.
EVM looks at schedule, cost, and scope project measurements together and compares them to the actual work completed to date. It is the most often used performance measurement method. EVM is performed on the work packages and the control accounts of the WBS. To perform the EVM calculations, you need to first gather the three measurements mentioned earlier: the planned value (PV), actual cost (AC), and earned value (EV).
Note
If you do any research on your own regarding these values, you might come across acronyms that are different from what you see here. I've included their alternate names and acronyms at the end of each description. They are also noted in the glossary of the PMBOK® Guide. I recommend you memorize planned value (PV), actual cost (AC), and earned value (EV) and make certain you understand the meaning of each before progressing.
Let's take a look at some definitions of these key measurements before diving into the actual calculations:
- Actual cost
Actual cost (AC) is the cost of completing the work component in a given time period. Actual costs might include direct and indirect costs but must correspond to what was budgeted for the activity. If the budgeted amount did not include indirect costs, do not include them here. Later you'll see how to compare this to PV to come up with variance calculation results. AC is also called actual cost of work performed (ACWP).
- Earned value
Earned value (EV) is the value of the work completed to date as it compares to the budgeted amount (PV) assigned to the work component. EV is typically expressed as a percentage of the work completed compared to the budget. For example, if our budgeted amount is $1,000 and we have completed 30 percent of the work so far, our EV is $300. Therefore, EV cannot exceed the PV budget for the activity. EV is also called budgeted cost of work performed (BCWP).
According to the earlier definition, EV is the sum of the cumulative budgeted costs for completed work for all activities that have been accomplished as of the measurement date. For example, if your total budget is $1,000 and 50 percent of the work has been completed as of the measurement date, your EV would equal $500. You can plot all the PV, AC, and EV measurements graphically to show the variances between them. If there are no variances in the measurements, all the lines on the graph remain the same, which means the project is progressing as planned. Figure 11.1 shows an example that plots these three measurements.
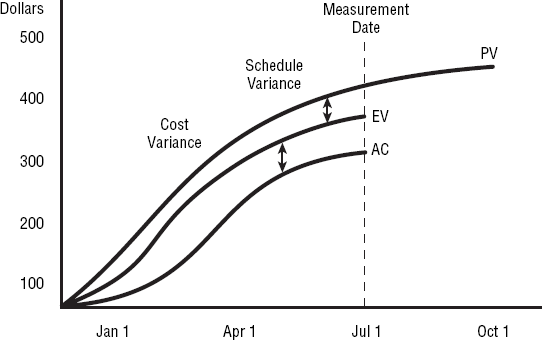
All of these measurements include a cost component. Costs are displayed in an S curve because spending is minimal in the beginning of the project, picks up steam toward the middle, and then tapers off at the end of the project. This means your earned value measurements will also take on the S curve shape.
Now you can calculate whether the project is progressing as planned or if variances exist in the approved baseline by using a variety of formulas discussed in the following sections. Use Figure 11.1 as your example for the formulas that follow. The Figure 11.1 totals are as follows: PV = 400, EV = 375, AC = 325.
Cost variance is one of the most popular variances that project managers use, and it tells you whether your costs are higher than budgeted (with a resulting negative number) or lower than budgeted (with a resulting positive number). It measures the actual performance to date or during the period against what's been spent.
The cost variance (CV) is calculated as follows:
CV = EV – AC
Let's calculate the CV using the numbers from Figure 11.1:
375 – 325 = 50
The CV is positive, which means you're spending less than what you planned for the work that you have completed as of July 1 (which Figure 11.1 shows because AC is less than EV).
If you come up with a negative number as the answer to this formula, it means that costs are higher than what you had planned for the work that was completed as of July 1 and these costs are often not recoverable.
Schedule variance, another popular variance, tells you whether the schedule is ahead or behind what was planned for this period. This formula is most helpful when you've used the critical path methodology to build the project schedule. The schedule variance (SV) is calculated as follows:
SV = EV – PV
Let's plug in the numbers:
375 – 400 = −25
The resulting schedule variance is negative, which means you are behind schedule, or behind where you planned to be as of July 1.
Together, the CV and SV are known as efficiency indicators for the project and can be used to compare performance of all the projects in a portfolio.
Cost and schedule performance indexes are primarily used to calculate performance efficiencies, and they're often used to help predict future project performance.
The cost performance index (CPI) measures the value of the work completed against actual cost. It is the most critical of all the EVM measurements according to the PMBOK® Guide because it tells you the cost efficiency for the work completed to date, or at the completion of the project. If CPI is greater than 1, your spending less than anticipated. If CPI is less than 1, you are spending more than anticipated for the work completed.
The schedule performance index (SPI) measures the progress to date against the progress that was planned. This formula should be used in conjunction with an analysis of the critical path activities to determine if the project will finish ahead or behind schedule. If SPI is greater than 1, you are ahead of schedule. If SPI is less than 1, you are behind schedule.
The cost performance index (CPI) is calculated this way:
CPI = EV / AC
Let's plug in the numbers and see where you stand:
375 / 325 = 1.15
This means cost performance is better than expected. You get an A+ on this assignment!
Cumulative CPI is a commonly used calculation to predict project costs at the completion of the project. It also represents the cumulative CPI of the project at the point the measurement is taken. First you need to sum the earned value calculations taken to date, or cumulative EV, and the actual costs to date, or cumulative AC. The formula looks just like the CPI formula only it uses the cumulative sums as follows:
Cumulative CPI = cumulative EV / cumulative AC
The difference between this and the CPI formula earlier is that the CPI formula is used for a single work period whereas the cumulative CPI is calculated using the sum of all the costs of every work component for the project. Additionally, you might also use cumulative CPI to calculate the total cost of a work component such as a deliverable, for example. Let's say you have a deliverable that has five work packages. You would total the EV and AC at the measurement date for all five work packages to determine the cost performance index for the deliverable.
The schedule performance index (SPI) is calculated this way:
SPI = EV / PV
Again, let's see where you stand with this example:
375 / 400 = .94
Uh-oh, not so good. Schedule performance is not what you expected. Let's not grade this one.
Cumulative SPI predicts schedule performance at the completion of the project. Like cumulative CPI, it also represents the cumulative SPI of the project at the point the measurement is taken. The formula is as follows:
Cumulative SPI = cumulative EV / cumulative PV
Forecasting uses the information you've gathered to date and estimates the future conditions or performance of the project based on what you know when the calculation is performed. Forecasts are based on work performance information (an output from the Executing process group) and your predictions of future performance.
The forecasting formulas you'll see later in this section are called estimate at completion (EAC). EAC estimates (or forecasts) the expected total cost of a work component, a schedule activity, or the project at its completion. This is the probable final value for the work component (or project). EAC is most often calculated by using actual costs incurred to date plus a bottom-up ETC estimate. The formula for the most typical EAC looks like this:
EAC = AC + bottom-up ETC
The bottom-up estimate to complete (ETC) is an estimate provided by the members of the project team actually working on the project activities. They provide the project manager with an estimate of the amount of effort remaining (and therefore the cost of the effort) based on the activities they have completed to date and what they believe will occur in the future. Their estimates are summed to come up with a total ETC. We'll look at two other ETC formulas at the end of this section.
There are three EAC forecasting formulas outlined in the PMBOK® Guide that we'll look at next. They reference a new parameter you haven't seen yet called budget at completion (BAC). BAC is the sum of all the budgets established for all the work in the work package, control account, schedule activity, or project. It's the total planned value for the work component or project.
The first EAC formula is called "EAC forecast for ETC work performed at the budgeted rate." I know that's a mouthful. Here's what you should know. This formula calculates EAC based on the actual costs to date and the assumption that ETC work will be completed at the budgeted rate. The formula looks like this:
EAC = AC + BAC – EV
Let's assume your AC to date is $800, BAC is $1,200, and EV is $600. EAC, assuming work ETC will be completed at the budgeted rate, is as follows:
$800 + $1,200 – $600 = $1,400
In English, you'll spend $1,400 to complete this work component, assuming the remaining work is performed at the budgeted rate.
The next EAC formula is called "EAC forecast for ETC work performed at the present CPI." I didn't make up these titles! Here's what you need to know. This forecast assumes that future performance will be just like the past performance for the project. The formula looks like this:
EAC = BAC / cumulative CPI
For this example, let's assume that BAC is $2,200 and cumulative CPI is 1.2. The formula looks like this:
$2,200 / 1.2 = $1833.33
This formula predicts you will spend less than the originally budgeted amount for the project.
The last formula is called "EAC forecast for ETC work considering both SPI and CPI factors." This formula assumes two things: there is a negative cost performance to date and the project schedule dates must be met. The formula looks like this:
EAC = AC + [(BAC – EV) / (cumulative CPI * cumulative SPI)]
Let's assume AC is $1,000, BAC is $1500, EV is $900, cumulative CPI is .97, and cumulative SPI is 1.05. Here's the resulting EAC:
$1,000 + [($1,500 – $900) / (.97 * 1.05)] = $1,598.10
Based on the assumption that cost performance to date is negative and we must meet the project schedule date, EAC is $1,598.10.
In addition to the bottom-up ETC, there are two other formulas for calculating ETC that you should be aware of for the exam. They are discussed next.
When you believe that future cost variances will be similar to the types of variances you've seen to date, you'll use this formula to calculate ETC:
ETC = (BAC – cumulative EV) / cumulative CPI
Assuming your cumulative earned value (cumulative EV) is 725, cumulative CPI value is 1.12, and BAC is 1,000, plug in the numbers:
(1,000 – 725) / 1.12 = 245.5
Therefore, at the measurement date, you need $245.50 to complete all the remaining work of this work component (or project if you're using project totals), assuming variances in the future will be the same as they have been to date.
When you believe that future cost variances will not be similar to the types of variances you've seen to date, you'll use this formula to calculate ETC:
ETC = (BAC – cumulative EV)
Now calculate your value:
(1,000 – 725) = 275
In this case, you need $275 to complete all the remaining work of this work component, assuming variances in the future are different than they have been to date.
To-complete performance index (TCPI) is the projected performance level the remaining work of the project must achieve in order to meet the BAC or EAC. It's calculated by dividing the work that's remaining by the funds that are remaining.
The formula for TCPI when using the BAC is as follows:
(BAC – EV) / (BAC – AC)
Assume for this example that BAC is $1,000, EV is $700, and AC is $800.
($1,000 – $700) / ($1,000 – $800) = 1.5
This means you'll need to reach a CPI rate that's 1.5 times what you've experienced to date in order to meet the BAC goal. If the result is less than one, future work does not have to be performed as efficiently as past performance.
When the BAC is no longer attainable, the project manager should calculate a new EAC and this new estimate becomes the goal you'll work toward once it's approved by management. The TCPI formula when EAC is the goal you're aiming for is as follows:
(BAC – EV) / (EAC – AC)
We'll use the same assumptions as we did in the formula earlier and note that EAC is $1,200. The formula looks like this:
($1,000 – $700) / ($1,200 – $800) = .75
There is one last thing to note regarding this formula. If cumulative CPI falls below one, all future project work must be performed at the TCPI
Performance reviews compare cost performance over time and the estimates of funds needed to complete the remaining work. Three types of analyses are associated with performance reviews: variance analysis, trend analysis, and earned value performance.
According to the PMBOK® Guide, trend analysis determines whether project performance is improving or worsening over time by periodically analyzing project results. These results are measured with mathematical formulas that attempt to forecast project outcomes based on historical information and results. You can use several formulas to predict project trends, but it's outside the scope of this book to go into them. For the exam, you're expected to understand the concept behind trend analysis, not the formulas used to calculate it. You'll want to remember that you can use the results you've analyzed using trend analysis formulas to predict future project behavior or trends.
I've already covered earned value performance and variance analysis is its own technique, so we'll look at it next.
Variance analysis in the Control Costs process examines the difference between the performance cost baseline and actual performance. One formula you can use with this technique is called variance at completion (VAC). This calculates the difference between the budget at completion and the estimate at completion. It looks like this:
VAC = BAC – EAC
If the result is a negative number, it means you're not doing as well with costs as you anticipated and that variance exists. Assuming your project performance is improving, as the project progresses, variances will become smaller.
Note
You'll be given some scratch paper when you go into the exam. I recommend that you write these formulas down on a piece of your scratch paper before you start the exam and keep it handy. That way, the formulas are off your mind and you've got them in front of you to reference when you get to the portion of the exam where these questions appear. You might want to use this tip for other items you've memorized as well. If you write them down before you begin, you don't have to jog your memory on every question. If you forget something, leave a blank space where it goes and as soon as you remember it or see a question that reminds you what it is, fill in the blank.
The Control Costs process has six outputs:
Work performance measurements
Budget forecasts
Organizational process assets updates
Change requests
Project management plan updates
Project document updates
I've discussed most of these before, or they are self-explanatory.
Note
Problems with costs come about for many reasons, including incorrect estimating techniques, predetermined or fixed budgets with no flexibility, schedule overruns, inadequate WBS development, and so on. Good project management planning techniques during the Planning processes might prevent cost problems later in the project. At a minimum, proper planning will reduce the impact of these problems if they do occur.
Always inform appropriate stakeholders of revised budget or cost estimates and any changes of significant impact to the project. Keep them updated on changes, status, and risk conditions during regularly scheduled project meetings.
The Control Schedule process involves determining the status of the project schedule, determining whether changes have occurred or should occur, and influencing and managing schedule changes. In the following sections, you'll look at this process's inputs, tools and techniques, and outputs.
Control Schedule inputs include the following:
Project management plan
Project schedule
Work performance information
Organizational process assets
I've covered each of these inputs previously. Keep in mind that the Control Schedule process works hand in hand with the Perform Integrated Change Control process we covered in Chapter 10 (as all the change control processes do).
Note
Keeping the schedule on track means you're monitoring and controlling time—one of the classic triple constraints.
The tools and techniques of the Control Schedule process are as follows:
We've covered all of these tools and techniques previously. I'll give you a few new points you should know regarding performance reviews.
Performance reviews in this process examine elements such as actual start and end dates for schedule activities and the remaining time to finish uncompleted activities. If you've taken earned value measurements, the SV and SPI will be helpful in determining the impact of the schedule variations and in determining if corrective actions are necessary.
The PMBOK® Guide notes that if you're using the critical chain method to construct the schedule, you should compare the amount of buffer needed to the amount of buffer remaining to help determine if the schedule is on track. This will also indicate whether corrective actions are necessary to adjust the schedule.
In the Control Schedule process, because you're dealing with time issues, it's imperative that you act as quickly as possible to implement corrective actions so that the schedule is brought back in line with the plan and the least amount of schedule delay as possible is experienced.
Note
Schedule changes might be potential hot buttons with certain stakeholders and can burn you if you don't handle them correctly. No one likes to hear that the project is going to take longer than originally planned. That doesn't mean you should withhold this information, however. Always report the truth. If you've been keeping your stakeholders abreast of project status, they should already know that the potential for schedule changes exists. Nevertheless, be prepared to justify the reason for the schedule change or start dusting off your résumé—maybe both, depending on the company.
Make sure to examine the float variance of the critical path activities when monitoring the schedule. Thinking back to the Develop Schedule process, you'll recall that float is the amount of time you can delay starting an activity without increasing the amount of time it takes to complete the project. Because the activities with the least amount of float have the potential to cause the biggest schedule delay, examine float variance in ascending order of critical activities.
Keep in mind that not all schedule variances will impact the schedule. For example, a delay to a noncritical path task will not delay the overall schedule and might not need corrective action. Use caution here, though—if a delay occurs on a noncritical path task or its duration is increased for some reason, that task can actually become part of the critical path. Delays to critical path tasks will always cause delays to the project completion date and require corrective action. Careful watch of the variances in schedule start and end dates helps you control the total time element of the project.
The Control Schedule process has the following outputs:
Work performance measurements
Organizational process assets updates
Change requests
Project management plan updates
Project document updates
Project management plan updates include making updates to the schedule baseline and the cost baseline. Changes to the cost baseline may be necessary when you've used a schedule compression or crashing technique. Changes to approved schedule start and end dates in the schedule baseline are called revisions. These generally occur as a result of a project scope change, or changes to activity estimates, and might result in a schedule baseline update. Schedule baseline updates occur when significant changes to the project schedule are made like the changes just mentioned. This means a new schedule baseline is established that reflects the changed project activity dates. Once the new baseline is established, it is used as the basis for future performance measurements. Never rebaseline a schedule without first having it approved by the project sponsor and archiving a copy of the original baseline and schedule.
Note
Take care when rebaselining a project schedule. Don't lose the original baseline information. Why do you care? Because the original baseline serves as historical information to reference for future projects. Make a backup copy of the original schedule so that you have a record of the original baseline as a reference. Even though some project management software allows you to save several baselines plus the original, it's still good practice to make a backup copy of the original.
Changes to the project schedule might or might not require updates to other elements of the project plan as well. For example, extending a schedule activity involving a contractor might impact the costs associated with that activity.
The project document updates output may require updates to either the schedule data or project schedule or both. For example, project schedule network diagrams require updates as a result of schedule model data updates. Don't forget to document these changes and inform your stakeholders.
Plan Quality, Perform Quality Assurance, and Perform Quality Control are part of the project Quality Management Knowledge Area. These processes work together to define and monitor the work of the project and to make certain the quality activity results meet the quality requirements laid out in the plan.
Perform Quality Control is specifically concerned with monitoring work results to see whether they comply with the standards set out in the quality management plan. You should practice Perform Quality Control throughout the project to identify and remove the causes of unacceptable results. Remember that Perform Quality Control is concerned with project results both from a management perspective, such as schedule and cost performance, and from a product perspective. In other words, the end product should conform to the requirements and product description defined during the Planning processes.
Perform Quality Control includes the following inputs:
Project management plan
Quality metrics
Quality checklists
Work performance measurements
Approved change requests
Deliverables
Organizational process assets
I've discussed each of these inputs previously, so I'll move on to tools and techniques.
The tools and techniques in the Perform Quality Control process are as follows:
Note
The first seven Perform Quality Control tools and techniques are collectively known as Ishikawa's seven basic tools of quality. We talked about the fishbone diagram (a cause-and-effect diagram), also known as the Ishikawa diagram, in Chapter 6, "Risk Planning." You recall that the fishbone diagram is used to help determine root causes. Kaoru Ishikawa is not known only for the fishbone diagram, he was also a significant contributor in the realm of quality.
The primary purpose of each of these tools is to examine the product, service, or result as well as the project processes for conformity to standards. If the results fall within the tolerance range specified, the results are acceptable. Alternatively, if the results fall within the control limits set for the product (as defined by the various tools and techniques I'll discuss in the following sections), the process you are examining is said to be in control. Spend time understanding these tools and techniques and their individual uses because you might see exam questions about each of them.
I talked about cause-and-effect diagrams as a diagramming technique in the Risk Identification process in Chapter 6. This technique helps identify root causes. If you need a refresher, refer to Figure 6.2 in that chapter.
I also discussed flowcharts in the same section of Chapter 6. Flowcharts are diagrams that show the logical steps that must be performed in order to accomplish an objective. They can also show how the individual elements of a system interrelate. Flowcharting can help identify where quality problems might occur on the project and how problems happen. This is important because it gives the project team the opportunity to develop alternative approaches for dealing with anticipated quality problems identified with this tool and technique. Refer to Figure 6.3.
Histograms are typically bar charts that depict the distribution of variables over time. Chapter 7, "Planning Project Resources," contains an example histogram. In Perform Quality Control, the histogram usually depicts the attributes of the problem or situation. (I'll discuss attributes shortly.)
We will look at the other tools and techniques in more detail in the following sections.
Control charts measure the results of processes over time and display the results in graph form. Control charts are a way to measure variances to determine whether process variances are in control or out of control.
A control chart is based on sample variance measurements. From the samples chosen and measured, the mean and standard deviation are determined. Perform Quality Control is usually maintained—or said to be in control—within plus or minus three standard deviations. In other words, Perform Quality Control says that if the process is in control (that is, the measurements fall within the control limits), you know that 99.73 percent of the parts going through the process will fall within an acceptable range of the mean. If you discover a part outside of this range, you should investigate and determine whether corrective action is needed.
Figure 11.2 illustrates an example control chart.
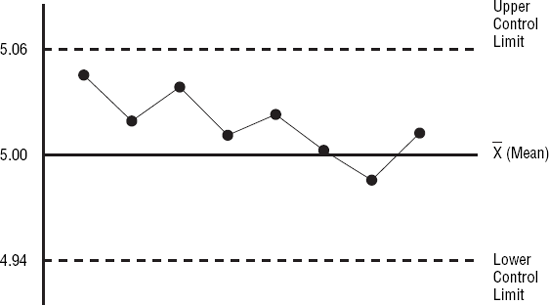
Let's assume you've determined from your sample measurements that 5 mm is the mean in the example control chart. One standard deviation equals 0.02. Three standard deviations on either side of the mean become your upper and lower control points on this chart. Therefore, if all control points fall within plus or minus three standard deviations on either side of the mean, the process is in control. If points fall outside the acceptable limits, the process is not in control and corrective action is needed.
Control charts are used most often in manufacturing settings where repetitive activities are easily monitored. For example, the process that produces widgets by the case lot must meet certain specifications and fall within certain variances to be considered in control. However, you aren't limited to using control charts only in the manufacturing industry. You can use them to monitor any output. You might consider using control charts to track and monitor project management processes. You could plot cost variances, schedule variances, frequency or number of scope changes, and so on to help monitor variances.
You have probably heard of the 80/20 rule. Vilfredo Pareto is the person credited with discovering this rule. He observed that 80 percent of the wealth and land ownership in Italy was held by 20 percent of the population. Over the years, others have shown that the 80/20 rule applies across many disciplines and areas. As an example, generally speaking, 80 percent of the deposits of any given financial institution are held by 20 percent of its customer base. Let's hope that rule doesn't apply to project managers, though, with 20 percent of the project managers out there doing 80 percent of the work!
The 80/20 rule as it applies to quality says that a small number of causes (20 percent) create the majority of the problems (80 percent). Have you ever noticed this with your project or department staff? It always seems that just a few people cause the biggest headaches. But I'm getting off track.
Pareto charts are displayed as histograms that rank-order the most important factors—such as delays, costs, and defects, for example—by their frequency over time. His theory is that you get the most benefit if you spend the majority of your time fixing the most important problems. The information shown in Table 11.1 is plotted on an example Pareto chart shown in Figure 11.3.
Table 11.1. Frequency of Failures
Item | Defect Frequency | Percent of Defects | Cumulative Percent |
|---|---|---|---|
A | 800 | .33 | .33 |
B | 700 | .29 | .62 |
C | 400 | .17 | .79 |
D | 300 | .13 | .92 |
E | 200 | .08 | 1.0 |
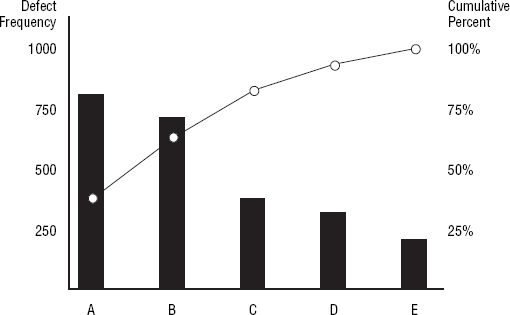
The problems are rank-ordered according to their frequency and percentage of defects. The defect frequencies in this figure appear as black bars, and the cumulative percentages of defects are plotted as circles. The rank-ordering of these problems shows you where corrective action should be taken first. You can see in Figure 11.3 that problem A should receive priority attention because the most benefit will come from fixing this problem.
Run charts are used to show variations in the process over time or to show trends (such as improvements or lack of improvements) in the process. Differences in results will occur in processes because there is no such thing as a perfect process. When processes are considered in control, differences in results might occur because of common causes of variances or special-cause variances.
Common causes of variances come about as a result of circumstances or situations that are relatively common to the process you're using and are easily controlled at the operational level. Special-cause variances are variances that are not common to the process. For example, perhaps you have very detailed processes with specific procedures that must be followed in order to produce the output and a process gets missed. Or maybe your project requires the manufacturing of a certain part and a machine on the line has a problem and requires a special calibration. This is an easy set of terms to remember because their names logically imply their definitions.
For the exam, you should understand the three types of variances that make up common causes of variances:
- Random variances
Random variations might be normal, depending on the processes you're using to produce the product or service of the project, but they occur as the name implies, at random.
- Known or predictable variances
Known or predictable variances are variances that you know exist in the process because of particular characteristics of the product, service, or result you are processing. These are generally unique to a particular application.
- Variances that are always present in the process
The process itself will have inherent variability that is perhaps caused by human mistakes, machine variations or malfunctions, the environment, and so on, which are known as variances always present in the process. These variances generally exist across all applications of the process.
Common cause variances that do not fall within the acceptable range are difficult to correct and usually require a reorganization of the process. This has the potential for significant impact, and decisions to change the process always require management approval.
Trend analysis is another technique that's carried out using run charts. Trend analysis in the Perform Quality Control process is a mathematical technique that uses historical results to predict future outcomes. Trend analysis often tracks variances in cost and schedule performance by monitoring the number of activities completed with significant variances within a certain time period. This information can then be used to forecast future performance. Trend analysis also tracks technical performance by determining the number of defects observed and the number of defects not corrected. Technical performance measurements compare the technical accomplishments of project milestones completed to the technical milestones defined in the project Planning process group.
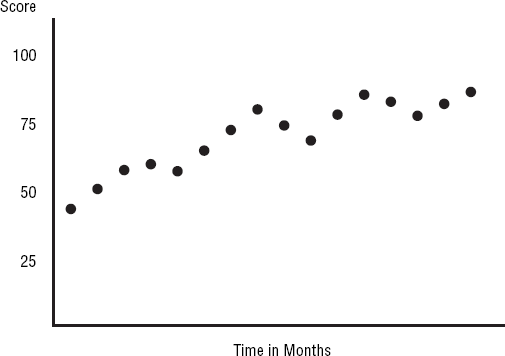
Scatter diagrams use two variables, one called an independent variable, which is an input, and one called a dependent variable, which is an output. Scatter diagrams display the relationship between these two elements as points on a graph. This relationship is typically analyzed to prove or disprove cause-and-effect relationships. As an example, maybe your scatter diagram plots the ability of your employees to perform a certain task. The length of time (in months) they have performed this task is plotted as the independent variable on the X axis, and the accuracy they achieve in performing this task, which is expressed as a score—the dependent variable—is plotted on the Y axis. The scatter diagram can then help you determine whether cause-and-effect (in this case, increased experience over time versus accuracy) can be proved. Scatter diagrams can also help you look for and analyze root causes of problems.
The important point to remember about scatter diagrams is that they plot the dependent and independent variables, and the closer the points resemble a diagonal line, the closer these variables are related. Figure 11.4 shows a sample scatter diagram.
Statistical sampling involves taking a sample number of parts from the whole population and examining them to determine whether they fall within acceptable variances. The formula to calculate the correct sample size is beyond the scope of this book. However, Creative Research Systems has an online calculator and an explanation of statistical sampling that you might find useful. You can find them at http://www.surveysystem.com/sscalc.htm.
Perhaps you determine to statistically sample 25 parts out of a lot or run. The quality plan outlines that the lot will pass if four parts or fewer fall outside the allowable variance.
Statistical sampling might also involve determining the standard deviation for a process, as discussed in the control chart tool and technique. The quality plan determines whether plus or minus two standard deviations—95.44 percent of the population—is adequate or whether plus or minus three standard deviations—99.73 percent—is adequate.
Inspection involves physically looking at, measuring, or testing results to determine whether they conform to the requirements or quality standards. It's a tool used to gather information and improve results. Inspections might occur after the final product is produced or at intervals during the development of the product to examine individual components. Acceptance decisions are made when the work is inspected and the work is either accepted or rejected. When work is rejected, it might have to go back through the process for rework. Inspection is also known as reviews or peer reviews.
Inspection might take actual measurements of components to determine whether they meet requirements. Maybe a component part for your product must be exactly 5 mm in length. To pass inspection, the parts are measured and must meet the 5 mm length requirement. If they measure 5 mm, they pass; if they do not, they fail.
Measurements can vary even if the variances are not noticeable. Machines wear down, people make mistakes, the environment might cause variances, and so on. Measurements that fall within a specified range are called tolerable results. So, instead of 5 mm exactly, maybe a range between 4.98 mm and 5.02 mm is an acceptable or tolerable measurement for the component. If the samples that are measured fall within the tolerable range, they pass; otherwise, they fail inspection.
One inspection technique uses measurements called attributes. The measurements taken during attribute sampling determine whether they meet one of two options, conforming or nonconforming. In other words, the measurements conform or meet the requirement or they do not conform. This can also be considered a pass/fail or go/no-go decision.
Attribute conformity and inspections are not necessarily performed on every component part or every end product that's produced. That's time-consuming and inefficient when you're producing numerous components. Inspection in cases like this is usually performed on a sampling of parts or products where every x number of parts is tested for conformity or measurement specifics.
Inspection will tell you where problems exist and gives you the opportunity to correct them, thus leading to quality improvements. The other tools and techniques I'll talk about in these sections also lead to quality improvements in the product or process or in both.
Quality improvements, as mentioned in the Perform Quality Assurance process discussed in Chapter 9, are a primary goal of the quality processes. Failure to meet quality requirements can have a significant impact on the project and the project team and might result in rework. Rework causes a project to take longer and cost more than originally planned because the project team has to repeat processes to correct the work. You should try to keep rework to a minimum so as not to impact the project schedule and budget. Rework has the potential to cause morale issues as well, especially if the team members thought they were doing a good job all along. Rework might require the project team to put in extra long hours, which in turn might cause more errors or other negative consequences. Monitor quality periodically so that rework is kept to a minimum.
Note
Perform Quality Assurance is concerned with assuring that the project is using the correct and most efficient processes to meet the project requirements; Perform Quality Control is concerned with the accuracy of the project results.
Perform Quality Control has several outputs:
I've already discussed many of these outputs, but I'll add a few quick notes here.
Validated changes are the results of changes, defect repairs, or variances that have been inspected and corrected. The resulting change, particularly corrective and preventive actions, can contribute to overall quality improvements and should be noted in the lessons learned documentation. Remember that processes that are in control should not be adjusted. Processes out of control might require adjusting, but this should occur only as a result of a management decision.
Validating deliverables involves using the tools and techniques of this process to determine if the deliverable is correct and accurate. This output becomes an input to the next process we'll discuss, Verify Scope, which entails accepting the deliverables.
Completed checklists become part of the project's documentation and are included as part of the organizational process asset updates. Lessons learned should include the causes of variances found during this process and why the corrective actions were recommended.
Updates to the quality management plan and the process improvement plan may be required as part of the project management plan updates output of this process. Quality standards may also need updating as a result of this process, and they are included in the project document updates output.
Managing and reporting on project progress make up the primary focus of the Monitoring and Controlling processes. One of the Monitoring and Controlling processes that helps manage and control project progress is the Verify Scope process. The primary purpose of the Verify Scope process is to formally accept completed deliverables and obtain sign-off that the deliverables are satisfactory and meet stakeholders' expectations.
The inputs of the Verify Scope are the project management plan, requirements documentation, requirements traceability matrix, and validated deliverables. This process involves evaluating these inputs to determine whether the work is complete and whether it satisfies the project objectives. Evaluation is performed using inspection, which is the only tool and technique of this process. You should perform Verify Scope even if the project is canceled to document the degree to which the project was completed. This serves as historical information, and if the project is ever started up again, you've got documentation that tells you what was completed and how far the project progressed.
The outputs of Verify Scope are accepted deliverables, change requests, and project document updates. Accepted deliverables is concerned with the formal acceptance of the work by the stakeholders. Remember that stakeholders include customers, the project sponsor, the project team, the management team, and so on. Document their acceptance with formal sign-off, and keep this with your project documents.
The Scope Management Knowledge Area includes Collect Requirements, Define Scope, Create WBS, Verify Scope, and Control Scope. You'll recall that project scope describes the work required to produce the product, service, or result of the project. This broad statement usually includes the product scope statement and the product description, which describes the characteristics, features, and functionality of the product, service, or result. The Control Scope process involves monitoring the status of both the project and the product scope, monitoring changes to the project and product scope, and monitoring work results to ensure that they match expected outcomes. Any modification to the agreed-upon WBS is considered a scope change. (It has been eons ago that you looked at this, so remember that the work breakdown structure is a deliverables-oriented hierarchy that defines the total work of the project.) This means the addition or deletion of activities or modifications to the existing activities on the WBS constitute a project scope change.
Changes in product scope require changes to the project scope as well. Let's say one of your project deliverables is the design of a piece of specialized equipment that's integrated into your final product. Now let's say that because of engineering setbacks and some miscalculations, the specialized equipment requires design modifications. The redesign of this equipment impacts the end product or product scope. Since changes to the product scope impact the project requirements, which are detailed in the scope document, changes to project scope are also required. This change, along with recommended corrective actions, should be processed through the Perform Integrated Change Control process.
Unapproved or undocumented changes that sometimes make their way into the project are referred to as scope creep. How often have you overheard a stakeholder speaking directly with a project team member asking them to make "this one little change that doesn't impact anybody...really, no one will notice." Make certain your project team members are well versed in the change control process and insist that they inform you of shenanigans like this. Scope creep can kill an otherwise viable project. Little changes add up and eventually impact budget, schedule, and quality.
The Control Scope process has five inputs, all of which you've seen before:
Project management plan
Work performance information
Requirements documentation
Requirements traceability matrix
Organizational process assets
There isn't any new information you need to know about these inputs for this process, so let's move on to tools and techniques.
The Control Scope process has one tool and technique: variance analysis. Variance analysis includes reviewing project performance measurements to determine whether there are variances in project scope. It's also important to determine and document the cause of variances and examine those against the scope baseline so that you can implement corrective actions if needed.
Note
If you are using a configuration management system to control product scope, the change control system must also integrate with it. The configuration management system manages changes to product and project scope and ensures that these changes are reasonable and make sense before they're processed through the Perform Integrated Change Control process.
The outputs of the Control Scope process are as follows:
Changes to scope will likely require that you repeat some of the project Planning processes and make any needed adjustments, including updating the project documents. Scope changes require an update to the project scope statement. This may require an update to the WBS and WBS dictionary as well. Pop quiz: what are the scope statement, WBS, and WBS dictionary collectively known as? Answer: the scope baseline. Scope baseline updates are part of the project management plan updates output of this process.
Scope changes include any changes to the project scope as defined by the agreed-upon WBS. This in turn might require changes or updates to project objectives, costs, quality measures or controls, performance measurements baselines, or time in the form of schedule revisions. Scope changes almost always affect project costs and/or require schedule revisions.
Note
Schedule revisions are almost always needed as a result of scope changes. But not all scope changes lengthen the project schedule. Some scope changes (a reduction in overall project requirements, for example) might reduce the number of hours needed to complete the project, which in turn might reduce the project budget. This most often occurs when the schedule is the primary constraint on the project and the start or end dates cannot be changed.
When scope changes are requested, all areas of the project should be investigated to determine what the changes will impact. The project team should perform estimates of the impact and of the amount of time needed to make the change. Sometimes, however, the change request is so extensive that even the time to perform an estimate should be evaluated before proceeding. In other words, if the project team is busy working on estimates, they aren't working on the project. That means extensive change requests could impact the existing schedule because of the time and effort needed just to evaluate the change. Cases like these require you to make a determination or ask the change control board (CCB) to decide whether the change is important enough to allow the project team time to work on the estimates.
Always remember to update your stakeholders regarding the changes you're implementing and their impacts. They'll want to know how the changes impact the performance baselines, including the project costs, project schedule, project scope, and quality.
This process concludes the Monitoring and Controlling process groups. You'll look at the Closing processes in the next chapter.
With the exception of the Perform Integrated Change Control process, we covered the meaty portion of the Monitoring and Controlling process group in this chapter. It's critical to monitor every process we discussed in order to keep the project in alignment with the objectives and to be able to take corrective action as soon as possible.
Monitoring and Controlling Risk is a process you'll perform once the work of the project begins throughout the remainder of the project. Just like change, risk is something that will occur on most every project you undertake. I've never managed a project (except for projects that were started and finished within a matter of days) that didn't encounter risk. And I'd say my experience has been that most risks are unknown, which makes contingency reserves (both time and money) essential on any project. For example, during the writing of this book, we moved to a new home. I did the smart thing and got three estimates from three reputable moving companies in the area. The estimates are based on an hourly rate for a certain number of movers. Two estimates came back very close to each other and the third was more than double the other estimates. So I picked the company that said they could get us moved in two days rather than the three their competitor quoted. Fortunately, we don't move very often. Unfortunately, I didn't realize moving companies woefully underbid the amount of time it actually takes to pack you up, load the truck, and unload at the other end. By the third day, I had to insist they complete the job in four hours because we were at more than double the original quote at that point. It's a good thing I had a reserve tucked away for the unexpected, but this overrun wiped out the entire contingency fund! Taking on a project without knowing that risks will occur and without having some contingency set aside is a huge gamble because even the smallest projects have risks.
Earned value measurement is a tool you can't live without for measuring performance on your project, particularly the cost and schedule variance and the cost and schedule performance indexes. The size and complexity of the project will dictate how often you should run the performance measurements. The mantra of stakeholders everywhere is "on time and on budget." Therefore, controlling the project budget and the schedule will likely be two of your most time-consuming project management tasks. Use the tools we discussed in this chapter to keep yourself and your stakeholders informed of what's happening regarding these two important areas. If cost or schedule changes must occur, it's imperative you communicate what happened, why it happened, and if it's expected to happen again and that you realign stakeholders' expectations with the new forecasted estimates.
Perform Quality Control and Verify Scope work together to measure, inspect, and accept the project deliverables. Verifying and accepting the work of the project shouldn't be a mind-boggling task at this point if you've been following the project management processes all along. For example, you should monitor and inspect deliverables as they're completed. At project's end, there might be additional testing or inspection needed to be certain all the deliverables work together (if they're required to do so), but many issues or problems you've discovered regarding the deliverables should have been discovered by now. However, I know that exceptions do exist. It isn't always possible to inspect the work of the project as it progresses because some projects aren't complete until the last piece of the puzzle is put into place. In that case, inspection, testing, and deliverables acceptance won't occur until the end of the project. But again, if you've used sound Monitoring and Controlling tools and techniques to monitor the processes, ideally you won't encounter any big surprises at this stage.
Control Scope is absolutely essential for all projects. Time and again I've seen changes to scope end up pitting stakeholders against the project team because the requirements weren't defined adequately in the first place and because neither party clearly understood what was being requested. Scope changes can kill a project by significantly delaying the finish date or by so drastically modifying the original objective of the project that it no longer resembles what it set out to accomplish. I try to keep the questions regarding scope change simple, as in "Do you absolutely have to have this to meet the objective of this project?" That isn't always easy for people to understand because we often confuse wants with needs. So, I might come up with an analogy they can relate to—something like this: "Let's say your one and only culinary skill is boiling water. Do you really need a designer stove with dual fuel options and a built-in warming oven to boil water? Wouldn't a simple store brand work in that case?"
We covered a lot of material in this chapter, and we also closed out the Monitoring and Controlling process group.
Monitor and Control Risks responds to risks as they occur and implements workarounds for unplanned risk events. Some risks planned for during the Plan Risk Responses process will occur, and some will not. Perhaps risks that were previously identified do occur, and their impacts are much greater than anticipated during the Plan Risk Responses process. These will require updates to the risk management plan or workarounds.
Cost Control involves managing changes to project costs. It's also concerned with monitoring project budgets to prevent unauthorized or incorrect costs from getting included in the cost baseline. Cost Control uses tools and techniques such as earned value measurement (such as CV, SV, CPI, SPI), forecasting (ETC and EAC), and project performance reviews (variance analysis, trend analysis, and EVM) to monitor costs.
Schedule Control involves determining the status of the project schedule, determining whether changes have occurred or should, and influencing and managing schedule changes.
Perform Quality Control monitors work results to see whether they fulfill the quality standards outlined in the quality management plan. Perform Quality Control should occur throughout the life of the project. It uses many tools and techniques. Inspection measures results to determine whether the results conform to the quality standards. Attributes are measurements that either conform or do not conform. Control charts measure the results of processes over time, and Pareto charts are histograms that rank-order the most important quality factors by their frequency over time. You should not adjust processes that are in control; however, you can change these processes to realize improvements.
Verify Scope involves verifying and accepting work results, while Control Scope is concerned with controlling changes to project scope.
- Describe the purpose of Monitor and Control Risks
Monitor and Control Risks involves identifying and responding to new risks as they occur. Risk monitoring and reassessment should occur throughout the life of the project.
- Name the purpose of the Control Costs process
The Control Costs process is concerned with monitoring project costs to prevent unauthorized or incorrect costs from getting included in the cost baseline.
- Be able to describe earned value measurement techniques
Earned value measurement (EVM) monitors the planned value (PV), earned value (EV), and actual costs (AC) expended to produce the work of the project. Cost variance (CV), schedule variance (SV), cost performance index (CPI), and schedule performance index (SPI) are the formulas used with the EVM technique.
- Be able to name the tools and techniques of the Control Costs process
The tools and techniques of the Control Costs process are earned value measurement, forecasting, to-complete performance index, performance reviews, variance analysis, and project management software.
- Be able to name the purpose of the Perform Quality Control process
The purpose of the Perform Quality Control process is to monitor work results to see whether they comply with the standards set out in the quality management plan.
- Name the purpose of the Verify Scope process
The purpose of Verify Scope is to determine whether the work is complete and whether it satisfies the project objectives.
- Be able to describe product verification
Product verification confirms that all the work of the project was completed accurately and to the satisfaction of the stakeholder.
I've discussed in detail the processes you'll use to monitor your project progress. You need to understand and use each of these processes to be an effective project manager. You'll need to know them by the names used in the PMBOK® Guide to be successful on the exam.
Control Costs | Monitor and Control Risks |
Control Schedule | Perform Quality Control |
Control Scope | Verify Scope |
You've learned a lot of new key words in this chapter. PMI has worked hard to develop and define standard project management terms that apply across industries. Here is a list of some of the terms you came across in this chapter:
actual cost (AC) | planned value (PV) |
attributes | prevention |
budget at completion (BAC) | revisions |
common causes of variances | rework |
control charts | run chart |
cost performance index (CPI) | scatter diagrams |
cost variance (CV) | Pareto charts |
cumulative CPI | schedule performance index (SPI) |
cumulative SPI | schedule variance (SV) |
earned value (EV) | statistical sampling |
earned value measurement (EVM) | technical performance measurements |
efficiency indicator | tolerable results |
estimate at completion (EAC) | variance at completion (VAC) |
estimate to complete (ETC) | workaround |
inspection |
You are working on a project that was proceeding well until a manufacturing glitch occurred that requires corrective action. It turns out the glitch was an unintentional enhancement to the product, and the marketing people are absolutely crazy about its potential. The corrective action is canceled, and you continue to produce the product with the newly discovered enhancement. As the project manager, you know that a change has occurred to the product scope because the glitch changed the characteristics of the product. Which of the following statements is true?
Changes to product scope should be reflected in the project scope.
Changes to product scope should be documented in the scope management plan.
Changes to product scope will result in cost changes.
Changes to product scope are a result of corrective action.
You are working on a project that was proceeding well until a manufacturing glitch occurred that requires corrective action. It turns out the glitch was an unintentional enhancement to the product, and the marketing people are absolutely crazy about its potential. The corrective action is canceled, and you continue to produce the product with the newly discovered enhancement. As the project manager, you know that a variance has occurred. Which of the following is true?
Common causes of variance, also known as special-cause variances, are situations that are unique and not easily controlled at the operational level.
Random variances, known or predictable variances, and variances that are always present in the process are known as common causes of variance.
Attribute inspection determines whether measurements fall within tolerable results.
Scatter diagrams display the relationships between an independent and a dependent variable to show variations in the process over time.
Your project has experienced some changes to the agreed-upon WBS elements. The changes were approved through the proper change control process. The WBS changes might in turn require which of the following? Choose the best answer.
Scope changes
Cost changes
Schedule revisions
Risk response changes
You are a project manager for Dakota Software Consulting Services. You're working with a major retailer that offers its products through mail-order catalogs. It is interested in knowing customer characteristics, the amounts of first-time orders, and similar information. The stakeholders have accepted the project scope. Work has begun on the project, and you're confirming some of the initial work results with the stakeholders. You've asked for acceptance of the work results. Which process are you in?
Monitor and Control Risks
Perform Quality Control
Verify Scope
Control Scope
You are the project manager for a top-secret software project for an agency of the United States government. Your mission—should you choose to accept it—is to complete the project using internal resources. The reason is that getting top-secret clearances for contractors takes quite a bit of time and waiting for clearances would jeopardize the implementation date. Your programmers are 80 percent of the way through the programming and testing work when your agency appoints a new executive director. Your programmers are siphoned off this project to work on the executive director's hot new project. Which of the following addresses the purpose of Verify Scope in this case?
Verify Scope determines the correctness and completion of all the work.
Verify Scope documents the level and degree of completion.
Verify Scope determines whether the project results comply with quality standards.
Verify Scope documents the correctness of the work according to stakeholders' expectations.
Which of the following statements is true regarding schedule variances?
Schedule variances impact scope, which impacts the schedule.
Schedule variances sometimes impact the schedule.
Schedule variances always impact the schedule.
Schedule variances never impact the schedule.
You are a project manager for Laurel's Theater Productions. Your new project is coming in over budget and requires a cost change through the cost change control system. You know all of the following statements are true regarding Control Costs except for which one?
A description of how cost changes should be managed and controlled is found in the cost management plan.
Cost changes are reflected in the cost baseline.
EVM is used to determine the cost performance that must be realized for the remaining work of the project to meet the goal.
This equation, EAC = BAC / cumulative CPI, is used to forecast an estimate at completion assuming future project performance will be the same as past performance.
Which of the following might require rebaselining of the cost baseline?
Corrective action
Revised cost estimates
Updates to the cost management plan
Budget updates
What are the performance measurements for the Control Schedule process?
SV = (EV – PV) and SPI = (EV / PV)
SV = (EV – AC) and SPI = (EV / AC)
SV = (EV – BAC) and SPI = (EV / BAC)
SV = (PV – EV) and SPI = (PV / EV)
This measurement is the value of the work that has been completed to date compared to the budget.
PV
AC
EV
EAC
You are a contract project manager for a wholesale flower distribution company. Your project is to develop a website for the company that allows retailers to place their flower orders online. You will also provide a separate link for individual purchases that are ordered, packaged, and mailed to the consumer directly from the grower's site. This project involves coordinating the parent company, growers, and distributors. You are preparing a performance review and have the following measurements at hand: PV = 300, AC = 200, and EV = 250. What do you know about this project?
The EAC is a positive number, which means the project will finish under budget.
You do not have enough information to calculate CPI.
The CV is a negative number in this case, which means you've spent less than you planned to spend as of the measurement date.
The CV is a positive number in this case, which means you're under budget as of the measurement date.
A negative result from an SV calculation means which of the following?
PV is higher than EV.
PV equals 1.
EV is higher than PV.
EV is higher than AC.
You are a contract project manager for a wholesale flower distribution company. Your project is to develop a website for the company that allows retailers to place their flower orders online. You will also provide a separate link for individual purchases that are ordered, packaged, and mailed to the consumer directly from the grower's site. This project involves coordinating the parent company, growers, and distributors. You are preparing a performance review and have the following measurements at hand: PV = 300, AC = 200, and EV = 250. What is the CPI of this project?
0.80
1.25
1.5
0.83
You accept project costs to date and assume future work (ETC) will be performed at the budgeted rate. If BAC = 800, ETC = 275, PV = 300, AC= 200, EV = 250, and cumulative CPI = 1.25, what is the EAC?
640
750
600
550
You know that BAC = 375, PV = 300, AC = 200, and cumulative EV = 250. Variances that have occurred on the project to date are not expected to continue. What is the ETC?
75
50
125
150
You expect future project performance to be consistent with the project performance experienced to date. If BAC = 800, ETC = 275, PV = 300, cumulative AC = 200, EV = 250, and cumulative CPI = 1.25, what is the EAC?
640
750
600
550
You know that BAC = 500, PV = 325, AC = 275, CPI = .9, and EV = 250, and you are using actual costs to date and assuming ETC uses the budgeted rate. Variance at completion tells you which of the following?
25
−52
52
−25
You know that BAC = 500, PV = 325, cumulative AC = 275, and cumulative EV = 250 and that you are experiencing typical variances. What is ETC?
227.3
250
274.7
525
Your project progressed as planned up until yesterday. Suddenly, an unexpected risk event occurred. You quickly devised a response to deal with this negative risk event using which of the following outputs of Monitor and Control Risks?
Risk management plan updates
Workarounds
Corrective action
Additional risk identification
Which of the following is considered the most critical EVM metric?
CPI
CV
SPI
SP
A. Changes to product scope should be reflected in the project scope.
D. Scatter diagrams display the relationship between an independent and dependent variable over time.
C. WBS element changes are scope changes. According to the PMBOK® Guide, schedule revisions are often required as a result of scope changes.
C. The Verify Scope process is concerned with the acceptance of work results. It also formalizes the acceptance of the project scope.
B. Verify Scope should document the level and degree of completion of the project given the circumstances in this question. If you come back at a later date and restart this project, Verify Scope will describe how far the project progressed and give you an idea of where to start.
B. Schedule variances will sometimes—but not always—impact the schedule. Changes to noncritical path tasks will not likely impact the schedule, but changes to critical path tasks will always impact the schedule.
C. To-complete performance index determines the cost performance that must be realized for the remaining work of the project to meet a goal such as BAC or EAC.
D. Budget updates might require cost rebaselining.
A. Schedule variance is (EV – PV) and schedule performance index is (EV / PV).
C. Earned value is referred to as the value of the work that's been completed to date compared to the budget.
D. The CV is a positive number and is calculated by subtracting AC from EV as follows: 250 – 200 = 50. A positive CV means the project is coming in under budget, meaning you've spent less than you planned as of the measurement date.
A. The SV calculation is EV – PV. If PV is a higher number than EV, you'll get a negative number as a result.
B. CPI is calculated as follows: EV / AC. In this case, 250 / 200 = 1.25.
B. When you accept project performance to date and assume future ETC work will be performed at the budgeted rate, EAC is calculated as follows: AC + BAC – EV. Therefore, the calculation for this question looks like this: (200 + 800) – 250 = 750.
C. The correct formula for ETC for this question is as follows: BAC – cumulative EV. Therefore, ETC is as follows: 375 – 250 = 125.
A. When project performance is expected to behave like past performance, EAC is calculated as follows: EAC = BAC / cumulative CPI. Therefore, the calculation for this question looks like this: 800 / 1.25 = 640.
D. You first have to calculate EAC in order to calculate VAC. EAC for variances that are atypical is AC + BAC – EV. So our numbers are 275 + 500 – 250 = 525. VAC is calculated this way: BAC – EAC. Therefore, 500 – 525 = −25. Our costs are not doing as well as anticipated.
C. You must first calculate cumulative CPI in order to calculate ETC. Cumulative CPI is cumulative EV / cumulative AC. We have 250 / 275 = .91. ETC with typical variances is (BAC – cumulative EV) / cumulative CPI. Our numbers are (500 – 250) / .91 = 274.7.
B. Workarounds are unplanned responses. They deal with negative risk events as they occur. As the name implies, workarounds were not previously known to the project team. The risk event was unplanned, so no contingency plan existed to deal with the risk event, and thus it required a workaround.
A. CPI is considered the most critical EVM metric. It measures the cost efficiency of the project work completed at the measuring date.