This chapter focuses on the topic of project quality management. Project Quality Management, like the other knowledge areas, begins with a process of planning that produces a quality management plan. It then has an executing process, Perform Quality Assurance, which is focused on defining and checking the quality of the processes in the project. It also has a monitoring and controlling process, Control Quality, which is focused on defining and inspecting the quality of the project deliverables.
You may need to pay particular attention in this chapter to those activities and the range of different quality tools that are described, because many of them may be new to you.
The PMBOK
®
Guide Processes
Project Quality Management Knowledge Area
The three processes
in the Project Quality Management knowledge area are as follows:
- Plan Quality Management (planning process)
- Perform Quality Assurance (executing process)
- Control Quality (monitoring and controlling process)
What Is Project Quality Management?
Project Quality Management is
focused on the processes of developing a quality management plan, defining and checking particular processes that affect the entire project, and inspecting the quality of project deliverables. The general process of quality management in the PMBOK Guide is aligned to the International Organization for Standardization (ISO) guide to quality management. Therefore, if you have experience with the standards, you will find this section easier to understand.
Let’s start with the formal definition of what quality is. It is defined as the degree to which a set of inherent characteristics fulfills requirements. You should remember this definition because it may be different from how you define quality. It has two key elements: the first is a defined set of observed characteristics, which are then measured against the second element, a predefined set of requirements. The closer these two elements are, the higher the level of quality. As a result of defining the characteristics of quality and the requirements that will be met, you are seeking to satisfy customer and stakeholder expectations. The responsibility for establishing a professional approach to quality management in an organization, and in a project, lies with management.
In addition to the exact definition of quality, there are some basic foundational concepts of quality management that you must be aware of.
A key foundational concept of the approach to quality management is that, generally speaking, it costs less to prevent a mistake than it does to correct a mistake. This concept of prevention over inspection informs much of the approach to quality management. You should always assume that you have the ability to prevent mistakes rather than spend time and money correcting them once they are discovered. In addition to costing time and money to fix mistakes, poor quality may result in the client not accepting the product, and therefore it can also adversely affect your reputation.
You need to be aware that quality management is not something that happens only once; it is ongoing throughout the life of the project, and it is iterative. Not only is quality management highly iterative, like other project management processes, but one of its central elements is the concept of continuous improvement, or kaizen. Continuous improvement is an iterative process of always seeking to improve your approach to, and results obtained from, quality management processes, and it has the goal of improving the quality of the project processes as well as the project deliverables.
Exam Tip
Kaizen is a loose Japanese translation of the term continuous improvement. So on the exam, if you find either term, you will know what it means.
Precision and accuracy
are two separate terms; you need to be aware of the definition of each. Precision relates to how tightly clustered results are. The closer the results are, the more precise the measurements being taken are. Accuracy, on the other hand, refers to how close the results are to the actual value. An example to illustrate the concepts is a shooting target and ten shots taken at the target. Accuracy refers to how close the shots are to the bullseye, which is the intended target. Precision refers to how tightly grouped the ten shots are, no matter how close to the bullseye they are. If they are tightly grouped, then they demonstrate a high level of precision. Obviously, the preferred mix is high degrees of both accuracy and precision.
In your workplace, you may use the two terms quality and grade interchangeably. However, for the purposes of the exam, it is important to realize they are distinct concepts. Quality is defined as the degree to which a set of inherent characteristics fulfills requirements. Grade, on the other hand, refers to the number of features a particular product has. For example, some manufacturers produce different brands to indicate the difference between low-grade and high-grade products. The products themselves are manufactured to the same quality standards, but some have fewer features, or are of a lower grade, than others.
Most people know
just in time (JIT)
as an inventory-control system in which suppliers provide materials just before they are required. It is often seen as an efficient way to manage organizational finances, because it does not require funds to be tied up in stock or materials being stored. However, JIT can also be used as a quality management approach; the absence of materials in stock forces an organization to maintain a high level of quality because it cannot depend on simply going to its warehouse for more stock when poor quality is produced.
Total quality management (TQM)
is a particular approach to quality management that means everybody in an organization takes responsibility for quality within the organization or project. It is led by management, and everyone at all levels of the organization is expected, encouraged, and trained to participate in constantly improving all aspects of quality.
Six Sigma
is a proprietary approach to quality management that offers credentials such as green belt and black belt. Six Sigma practitioners are focused on reducing quality defects to as close to zero as possible.
REAL WORLD
When I was working in the telecommunications industry, we had to build telephone networks reliable enough that when someone dialed the emergency number for police, ambulance, or fire, it would connect 99,999 times out of every 100,000 attempts. This was known as five nines reliability; that is, 99.999% of the time, it had to work. This is an example of a Six Sigma approach.
Note
Deming, Juran, and quality management
Much of the modern history of the profession of quality management is rooted in the seminal works of William Edwards Deming. Deming, through his approach to quality management, contributed greatly to the rise of the post–World War II Japanese economy based on competing on quality. Deming is also known for his collaboration with Walter Shewhart in producing and refining the Plan-Do-Check-Act cycle, which forms the basis not only of quality management but also of the profession of project management. At the same time that Deming was influencing Japanese industry, Joseph Juran was working in the same area; he is best known for his approach to quality as a management activity, the Pareto analysis, and the cost of quality analysis. If you want to know more about quality management, I highly recommend reading the work of these researchers.
Plan Quality Management
More Info
Plan Quality Management
You can read more about the Plan Quality Management process in the PMBOK Guide, 5th edition, in Chapter 8, section 8.1. Table 6-1 identifies the process inputs, tools and techniques, and outputs.
Table 6-1.
Plan Quality Management Process
Inputs ➪ | Tools and Techniques ➪ | Outputs |
|---|---|---|
• Project management plan • Stakeholder register • Risk register • Requirements documentation • Enterprise environmental factors • Organizational process assets | • Cost-benefit analysis • Cost of quality • Seven basic quality tools • Benchmarking • Design of experiments • Statistical sampling • Additional quality planning tools • Meetings | • Quality management plan • Process improvement plan • Quality metrics • Quality checklists • Project document updates |
The Plan Quality Management process is a planning process
with a range of outputs including, most important, the quality management plan. Similar to the other planning documents, the quality management plan will guide your efforts in defining and controlling the quality of both the project processes and the deliverables. It forms a subsidiary plan to the overall project management plan. Another important output from the Plan Quality Management process is the process improvement plan, which is also a subsidiary of the project management plan and details how you will define and continuously improve all the processes on your project.
The Plan Quality Management process covers the following planning domain task
:
- Task 8: Develop the quality management plan and define the quality standards for the project and its products, based on the project scope, risks, and requirements, in order to prevent the occurrence of defects and control the cost of quality.
Inputs
The Plan Quality Management process uses some or all of the following inputs as part of the development of the quality management plan for the project.
Project Management Plan
The distinct elements of the project management plan
that are useful in developing your own quality management plan are the scope, schedule, and cost baselines, because they contain information against which to measure quality. The project management plan is an output from the Develop Project Management Plan process.
Stakeholder Register
Given that the purpose of quality management is to deliver processes and products that meet customer and stakeholder expectations, the
stakeholder register
—which describes stakeholders, their interest in the project, the impact they have on the project, and their expectations in relation to the project generally and quality specifically—can be considered a very important input into the Plan Quality Management process.
The stakeholder register is an output from the Identify Stakeholders process in the Stakeholder Management knowledge area.
Risk Register
The risk register
documents and assesses specific risks that may have an impact on any quality management issues and decisions you are making. The risk register is an output from the Identify Risks process in the Risk Management knowledge area.
Requirements Documentation
Given that the definition of quality is the degree to which a set of inherent characteristics fulfills requirements, it is important to use the requirements documentation
as an input because it describes and documents the requirements. Requirements documentation is an output from the Collect Requirements process in the Scope Management knowledge area.
Enterprise Environmental Factors
Particular enterprise environmental factors
that may assist with the development of your quality management plan include any external local or central government regulations pertaining to quality specifications, and any other industry rules or guidelines.
REAL WORLD
One of the key enterprise environmental factors affecting the quality management plans that I have worked on are external standards that different products and deliverables must meet. These are often set by industry organizations or government departments and may change during the duration of your project. Local governments may set building or manufacturing quality standards or health and safety standards, or industry or professional bodies may set employment standards. There are many examples of external enterprise environmental factors relating to quality. If you are getting accredited as an ISO 9001–compliant organization or obtaining the PMP credential because it is a government or industry requirement for you to work as a project manager, this is an example of an enterprise environmental factor at work.
Organizational Process Assets
Organizational process assets
that may be important inputs into the development of your quality management plan include relevant organizational policies and guidelines relating to the organization’s approach and expectations of quality, and any historical information or lessons learned from previous projects relating to quality.
Tools and Techniques
The following tools and techniques are available to be used to develop the inputs into this process in order to produce the quality management plan.
Cost-Benefit Analysis
Cost-benefit analysis
is used as a tool in the Plan Quality Management process because you need to look at the costs of meeting quality requirements, which generally increase as you seek to improve quality and avoid re-work and decreasing stakeholder satisfaction. The pursuit of quality is always a trade-off between the costs involved and the benefits obtained; therefore, using cost-benefit analysis is an important tool for producing a quality management plan.
Cost of Quality
Cost of quality
considers the total cost of quality over the life of the product, which is well beyond the life of the project and examines the cost of low quality, subsequent warranty claims, any negative effect on brand or reputation, and loss of future work.
Exam Tip
Cost of quality is mirrored by, and sometimes referred to as, cost of poor quality. Whatever the term used, it is the concept of assessing what the implications are for producing or not producing quality products far beyond the life of the project.
Seven Basic Quality Tools
The catchall phrase seven basic quality tools refers to the graphical representation of tools used to measure, assess, and determine causes of quality issues. They are a convenient and graphical way to represent what can often be quite complex text-based or numerical information to allow quick communication and assessment of quality issues.
Exam Tip
Each of the seven basic quality tools refers to a particular type of diagram.
The
cause-and-effect diagram
, which is also called the Ishikawa or fishbone
diagram
, is used to describe a known defect and assess the variety of possible causes. It enables you to consider multiple causes for a single problem. Figure 6-1 shows a cause-and-effect diagram
with one level of analysis done. You start by identifying a particular defect and then look at all the possible causes of that defect; if you want to, you can also seek further root causes of each identified cause. After you have identified the potential causes, you can then use more quantifiable analysis, such as counting the number of times that cause is responsible for the defect, and come up with a prioritized list of causes.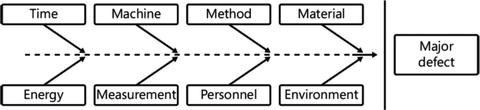
Figure 6-1.
A cause-and-effect, Ishikawa,
or fishbone diagram
Exam Tip
This is one of those instances where multiple terms mean the same thing on the exam. This diagram may be referred to as the cause-and-effect, Ishikawa, or fishbone diagram.
Flowcharts
are a convenient way to show the flow of information, or the sequence of steps, in a particular process. Figure 6-2 shows an example of a flowchart.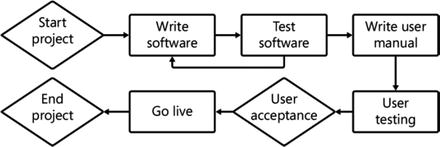
Figure 6-2.
Flowchart
REAL WORLD
Each shape used in a flow chart has a specific meaning attached to it. For example, the rectangle shape indicates a process, and the diamond shape indicates a decision point. Every shape used has a different meaning so that you can look at the flowchart and get information quickly.
Exam Tip
On the exam, you may see the acronym SIPOC used. If so, it is referring to a particular type of flowchart used for documenting the flow of goods and information between and customers. The acronym SIPOC stands for Suppliers, Inputs, Process, Outputs. and Customers.
Checksheets
are a convenient way to document quality problems or issues and their frequency of occurrence. Checksheets are sometimes called tally sheets. Figure 6-3 shows an example of a checksheet.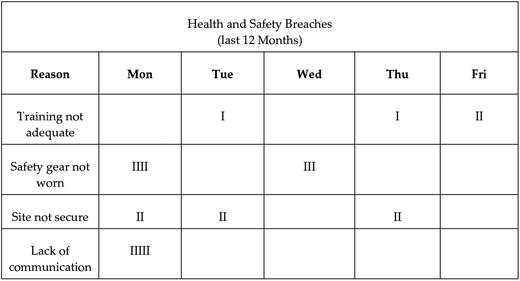
Figure 6-3.
Checksheet
Checksheets can provide a simple but useful way of capturing events and trends as they occur. Looking at the example in Figure 6-3, it could be determined that the majority of the team’s health and safety breaches occur after a weekend. If this is deemed to be true, the project manager could put measures in place to ensure that health and safety matters are on the forefront on the team’s mind after each weekend.
Exam Tip
The difference between a checksheet and a checklist is that a checksheet provides a way to capture the occurrences of an event, whereas a checklist documents what steps need to be completed to carry out a certain process. Checksheets are a tool in the Plan Quality Management process. Quality checklists are an output from Plan Quality Management and are used as an input into Control Quality.
A
Pareto diagram
is a way of using a histogram to document the frequency of particular events in descending order and then add up the cumulative percentage of the quality defects in order to assess which subset of defects causes the greatest number of problems. The purpose of this Pareto analysis is to focus your attention and energy on those 20% of problems that are causing 80% of the issues. Figure 6-4 shows an example of a Pareto diagram.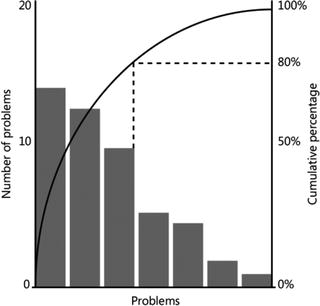
Figure 6-4.
Pareto diagram
Note
Pareto principle
Joseph Juran first used the term Pareto principle to refer to what is now more commonly referred to as the 80:20 rule. It was called the Pareto principle because in the early part of the 20th century, an economist by the name of Wilfried (or Vilfredo, if you are Italian) Pareto observed that 80% of the land in Italy was owned by 20% of the people. This 80:20 rule has come to be used in a wide variety of disciplines to describe any situation where a small amount of a population is responsible for many of the observations made.
Histograms
, or bar charts, are a simple way of representing frequency, or occurrence, of particular events. Figure 6-5 shows an example of a histogram.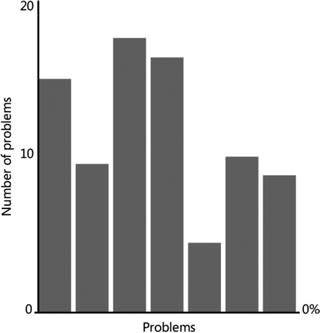
Figure 6-5.
Histogram
Control charts
are an effective way of recording data and determining whether a manufacturing process is still in control or is about to go out of control. Information is gathered and plotted on the control chart around an expected average, or mean. Using standard deviations, you can then set the upper and lower control limits, three standard deviations either side of the mean. Beyond these control limits, the upper and lower specification limit is set. Any data point that appears outside of the specification limit will not be accepted by the customer. Any data point that appears outside of the control limit but within a specification limit indicates that the process is out of control and investigation should commence immediately as to the cause. Any information or data gathered in the control limits is acceptable.
The exception to this rule is when seven consecutive data points appear either side of the mean. This is called the rule of seven: it is statistically improbable that you will get seven consecutive points on either side of the mean. An easy way to understand the rule of seven is to consider a coin being tossed and the chances of it landing with either heads or tails facing up. You would expect a random distribution of heads and tails but would consider it statistically improbable that you would get seven consecutive heads or tails. If you do note seven consecutive data points above or below the mean, it signals that you should investigate the cause, because the process may be about to go out of control. Figure 6-6 shows an example of a control chart. Note the appearance of seven consecutive data points above the mean, indicating the rule of seven.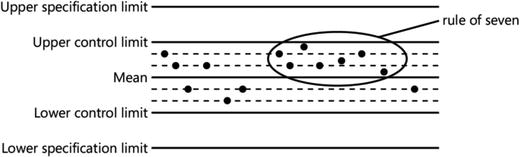
Figure 6-6.
Control chart
Scatter diagrams
simply record the relationship between two variables in graphical form. Figure 6-7 shows an example of a scatter diagram.

Figure 6-7.
Scatter diagram
Note
Ishikawa and quality management
The development of the seven basic quality tools is attributed to the work of Kaoru Ishikawa, a Japanese professor and one of the great quality management advocates and developers.
Benchmarking
Benchmarking
is the process of comparing your quality practices to those of other projects or other organizations and seeing how you compare.
Design of Experiments
Design of experiments
is a tool to assist with developing useful and reliable experiments to test quality. Key considerations in the design of experiments include the identification and control of variables and the understanding of how the testing process itself may affect observed outcomes. A well-designed experiment can independently control different variables to determine which ones are causing problems.
Statistical Sampling
Statistical sampling
is used when there are either too many quality checks to do or quality checks involve destructive testing. For example, you may want to do testing on lines of software code being written, but there are more than 100,000 lines of code. Instead of checking every line of code, you can select 100 lines of code and check them for accuracy. One constraint of statistical sampling is the assumption that the result from a small population is representative of the entire population.
Additional Quality Planning Tools
Along with the tools and techniques listed previously, additional quality planning tools can be used to plan your particular approach to quality management. These include brainstorming and nominal group techniques, both of which you have seen as tools and techniques and other areas. In addition to these two tools, you can use force field analysis, affinity diagrams, process decision program charts, interrelationship diagrams, tree diagrams, prioritization matrices, activity network diagrams, and matrix diagrams. All of these quality management and control tools are covered in more depth in the Perform Quality Assurance process.
Another quality planning tool
that can be used is failure mode and effect analysis (FMEA)
. FMEA
is a widely used technique that examines the consequence of failure in any part of the system and uses those observations to ensure that failure does not actually occur or that, if it does, the impact is anticipated and mitigated. In this process, you could use this tool to determine the likely effect of failure of the product and prepare to ensure that it doesn’t happen.
Meetings
Meetings
are a useful way to bring together members of the project team and other stakeholders so that they can contribute to the development of the quality management plan.
Outputs
After applying the appropriate tools and techniques to the selected inputs, the Plan Quality Management process has the following outputs.
Quality Management Plan
The Plan Quality Management process
has the quality management plan as its primary output. Similar to other management plans, the quality management plan provides a description of the overall approach to quality management, guidelines for all project processes and how they will be implemented, and a description of expected quality, testing, and inspection of project deliverables. The detail contained in the quality management plan reflects the size and complexity of the project, and the plan should be updated and reviewed regularly to ensure that it is still accurate. The quality management plan is then a key input into the Perform Quality Assurance and Control Quality processes.
Exam Tip
According to the PMBOK Guide, every project should have a quality management plan. The quality management plan can be formal and documented, or it can be an informal set of policies and guidelines. It reflects the size and complexity of the project but should always be done.
REAL WORLD
Many organizations, after they reach a certain size, appoint a particular person to manage quality in the organization and also within projects. I believe this is an important step for an organization to take, because a focus on quality is often a much more important element than a focus on cost. A simple way to remember why quality is so important to your project is that if you don’t care about quality, your competitor will. I remember on one large project I was managing that I wanted the quality of the project to be the legacy that I left rather than coming in under budget and ahead of time. We still focused on measuring cost and time performance, and we did come in under budget and ahead of time, but the element I was proudest of was the extra quality we were able to deliver.
Process Improvement Plan
The
process improvement plan
is a subsidiary of the project management plan that focuses specifically on analyzing quality processes and describing ways in which continuous improvement can be applied to these processes. The process improvement plan is used as an input into the Perform Quality Assurance process.
Exam Tip
Note that the process improvement plan is not used as an input into the Control Quality process because its primary focus is on project processes, which are the main focus of the Perform Quality Assurance process.
Quality Metrics
The development and documentation of specific
quality metrics
is necessary in order to be able to measure progress against what has been planned. The more specific the quality metric, the more detailed the measurement and reporting can be. The most common quality metrics developed include performance measurements relating to schedule, cost, defects, failure, and reliability. The quality metrics are used as an input into the Perform Quality Assurance and the Control Quality processes.
Quality Checklists
The
quality checklist
is a specific type of checklist you can use to determine whether defined steps of the quality process have been performed. A quality checklist should both document the steps to be taken and incorporate acceptance criteria from the project requirements and scope baseline. The quality checklists are used as an input into the Control Quality process.
Project Document Updates
The specific project documents
that may be updated as a result of completing the Plan Quality Management process are the stakeholder register and the responsibility assignment matrix.
Quick Check
1.
What is the key function of a quality management plan?
2.
What does it mean when a data point is outside the control limit but within the specification limit?
3.
Under what circumstances would you use statistical sampling?
Quick Check Answers
1.
The key function of a quality management plan is to describe your particular approach to quality in your project, the relevant policies, your approach to quality assurance and process improvement, quality metrics, and how you will control and measure quality of the project deliverables.
2.
If a data point is outside the control limit but within the specification limit, this indicates that the process may be out of control and requires immediate investigation.
3.
You would use statistical sampling to determine the level of quality when there are too many samples to investigate individually or when investigating the quality of the sample involves destructive testing.
Perform Quality Assurance
More Info
Perform Quality Assurance
You can read more about the Perform Quality Assurance process in the PMBOK Guide, 5th edition, in Chapter 8, section 8.2. Table 6-2 identifies the process inputs, tools and techniques, and outputs.
Table 6-2.
Perform Quality Assurance Process
Inputs ➪ | Tools and Techniques ➪ | Outputs |
|---|---|---|
• Quality management plan • Process improvement plan • Quality metrics • Quality control measurements • Project documents | • Quality management and control tools • Quality audits • Process analysis | • Change requests • Project management plan updates • Project document updates • Organizational process asset updates |
The Perform Quality Assurance process
is an executing process that uses the quality management plan for guidance and is focused on implementing processes across the entire project and checking that these processes are being adhered to and continuously improved. The processes that you define and audit won’t only be processes around quality management. For example, you could decide to have a process about setting up and choosing the right projects, culminating in a signed project charter, all of which would be covered in the Develop Project Charter process. The Perform Quality Assurance process checks that you have followed this process correctly.
The Perform Quality Assurance process covers the following executing domain task
:
- Task 3: Implement the quality management plan using the appropriate tools and techniques, in order to ensure that work is performed in accordance with required quality standards.
Exam Tip
A simple way to remember the difference between quality assurance and quality control is that quality assurance uses audits and focuses on processes, whereas quality control focuses on inspections and the project deliverables.
REAL WORLD
The ISO 9000 standard is an excellent example of quality assurance at work. This standard requires processes to be in place and regular audits to occur to ensure that the processes are being followed. The standard does not focus on the quality of the product being produced. Thus, some unscrupulous companies have ISO 9000 accreditation but produce low-quality products.
Inputs
The Perform Quality Assurance process uses some or all of the following inputs.
Quality Management Plan
The quality management plan
is obviously a key input into the Perform Quality Assurance process because it guides how the process is carried out. The quality management plan is an output from the Plan Quality Management process.
Process Improvement Plan
The
process improvement plan
is used as an input into this process because it is focused on detailing the processes that will be put in place and how they will be checked and improved. The process improvement plan is an output from the Plan Quality Management process.
Quality Metrics
The
quality metrics
are specific variables that can be measured as part of checking whether you are implementing and adhering to particular quality processes. The quality metrics are an output from the Plan Quality Management process.
Quality Control Measurements
Quality control measurements
are generated by the Control Quality process and are used in the Perform Quality Assurance process to analyze and evaluate the particular quality standards relating to the quality processes that are supposed to have been followed.
Project Documents
The specific types of
project documents
that are useful as inputs into the Perform Quality Assurance process are any documents relating to requirements or quality processes, or those that define stakeholder expectations.
Exam Tip
Did you notice that neither environmental enterprise factors nor organizational process assets are used as inputs into this process?
Tools and Techniques
The following tools and techniques are used on the inputs to deliver the Perform Quality Assurance process outputs.
Quality Management and Control Tools
The Perform Quality Assurance process uses all the tools and techniques featured throughout the Quality Management knowledge area. It uses the seven basic tools of quality already covered in the Plan Quality Management process, as well as statistical sampling, inspection, benchmarking, design of experiments, cost-benefit analysis, and cost of quality.
Additionally, you can use the following seven new quality tools and techniques. Each of these quality management and control tools is used to document and represent particular measurements taken during the Perform Quality Assurance process.
Note
Seven new quality tools
The seven new quality tools come from the book Seven New QC Tools: Practical Applications for Managers by Yoshinobu Nayatani, Toru Eiga, Ryoji Futami, and Hiroyuki Miyagawa (Productivity Press, 1994). These seven tools and the basic seven tools all represent data in graphical format for easy interpretation and communication.
Affinity diagrams
, or KJ Methods diagrams, can be used during a brainstorming session to create cause-and-effect diagrams because they group data in logical relationships. Figure
6-8
shows an example of an affinity diagram.
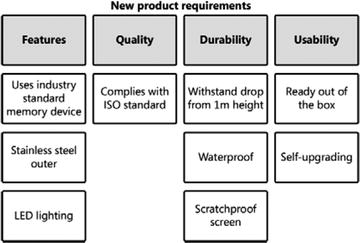
Figure 6-8.
Affinity diagram
A process decision program chart (PDPC
) displays in graphical and hierarchical form the steps in a process in order to understand issues that may positively or negatively affect the sequence of activities to reach a goal. In this sense, it is a cross between a flowchart and a breakdown structure. Figure 6-9 shows an example of a PDPC.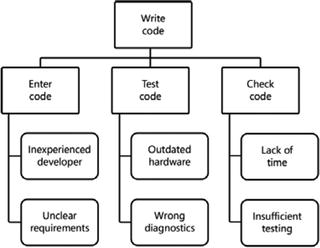
Figure 6-9.
Process decision program chart
Interrelationship digraphs are useful to
graphically show multiple cause-and-effect relationships among various factors. Figure 6-10 shows an example of an interrelationship digraph.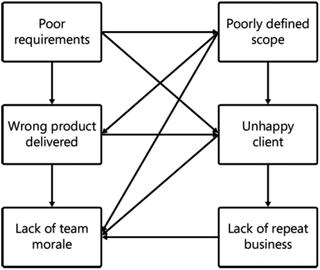
Figure 6-10.
Interrelationship digraph
A tree diagram is a very useful graphical representation of hierarchical relationships and parent-to-child relationships. You have seen the tree diagram as a work, risk, and organizational breakdown structure. In managing quality, the tree diagram can be used to describe nested relationships between steps in the quality assurance process. Figure 6-11 shows an example of a tree diagram.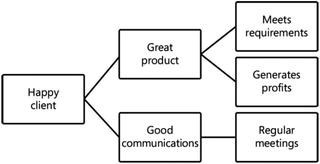
Figure 6-11.
Tree diagram
Prioritization matrices
use a variety of weighted criteria to determine the priority of quality actions to enable the key issues to be determined. Figure 6-12 shows an example of a prioritization matrix.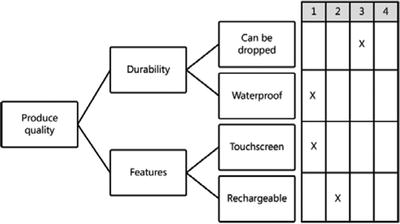
Figure 6-12.
Prioritization matrix
Activity network diagrams
are used to show relationships between activities to be completed. You have already seen these diagrams used in the managing the project schedule and determining the tasks on the critical path with activity-on-node (AON) diagrams
. In quality management, they are used to show the sequence of, and interrelationships between, various quality activities. Figure 6-13 shows an example of an activity network diagram.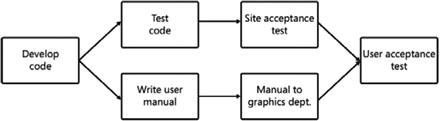
Figure 6-13.
Activity network diagram
Matrix diagrams
are used to indicate whether a relationship exists between two variables. Figure 6-14 shows an example of a matrix diagram.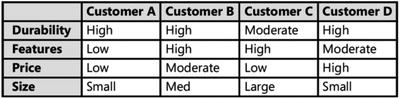
Figure 6-14.
Matrix diagram
Quality Audits
A
quality audit
is an independent process that seeks to determine whether the defined project processes are being carried out as per the quality management plan. Quality audits are carried out using the quality management plan as a guideline and should generally be done by people not involved with the project who can independently assess whether the required processes are in place and whether they are being followed.
REAL WORLD
On one particularly large project I was managing, we had it as part of the contract that regular audits would occur on all our project processes. We had an independent assessor appointed from one of the large global auditing companies, and every six months, that assessor would show up in person and spend several days requesting proof that we had processes in place and that we followed those processes correctly. The assessor would then produce a report detailing areas of both compliance and noncompliance. As the project manager, it was my responsibility to ensure that any areas of noncompliance were addressed promptly. The costs for completing these quality audits were part of the overall project budget.
Exam Tip
Wherever you find an audit being used as a tool, it will be checking that processes are in place, that they are being followed as per the requirements, and that any deviation from the processes is documented and dealt with. Audits do not check the quality of any deliverables or products.
Process Analysis
Process analysis
takes the steps in the process improvement plan and executes them in order to identify and improve existing processes.
Outputs
The Perform Quality Assurance process produces some or all of the following outputs.
Change Requests
Change requests
are generated as a result of information discovered by audits and process analysis that then requires changes to be considered as per the agreed change management process. The change requests are used as an input into the Perform Integrated Change Control process.
Project Management Plan Updates
The specific parts of the project management plan
that may be updated as a result of the Perform Quality Assurance process are the quality management plan, the process improvement plan, the schedule management plan, and the cost management plan.
Project Document Updates
The specific project documents
that may be updated as a result of the Perform Quality Assurance process include such things as project-specific policies and guidelines relating to preparation and execution of processes.
Organizational Process Asset Updates
The specific organizational process assets
that may be updated as a result of the Perform Quality Assurance process are any templates, policies, or guidelines relating to quality audits, and training and appointment of independent auditors.
Quick Check
1.
What is the difference between quality assurance and quality control?
2.
What is it that both the seven basic quality tools and the seven new quality tools are attempting to do?
3.
What is the purpose of a quality audit?
Quick Check Answers
1.
The difference between quality assurance and quality control is that quality assurance is focused on the processes of the project, whereas quality control is focused on the project deliverables.
2.
All of the quality tools described seek to take what can be quite complex text, verbal, or numerical information and collate and present it in an easy-to-understand graphical form.
3.
The purpose of the quality audit is to independently check that required processes are in place and are being followed.
Control Quality
More Info
Control Quality
You can read more about the Control Quality process in the PMBOK Guide, 5th edition, in Chapter 8, section 8.3. Table 6-3 identifies the process inputs, tools and techniques, and outputs.
Table 6-3.
Control Quality Process
Inputs ➪ | Tools and Techniques ➪ | Outputs |
|---|---|---|
• Quality management plan • Quality metrics • Quality checklists • Work performance data • Approved change requests • Deliverables • Project documents • Organizational process assets | • Seven basic quality tools • Statistical sampling • Inspection • Approved change requests review | • Quality control measurements • Validated changes • Verified deliverables • Work performance information • Change requests • Project management plan updates • Project document updates • Organizational process asset updates |
The Control Quality process is a monitoring and controlling process that uses the quality management plan and checks that the project deliverables will meet the documented requirements and stakeholder expectations.
The Control Quality process covers the following monitoring and controlling domain task
:
- Task 3: Verify that project deliverables conform to the quality standards established in the quality management plan by using appropriate tools and techniques, in order to meet project requirements and business needs.
Inputs
The following inputs are used in the Control Quality process.
Quality Management Plan
The quality management plan
is a critical input into the Control Quality process because it sets out and describes how this process will occur. The quality management plan is an output from the Plan Quality Management process
Quality Metrics
The quality metrics
are a required input into the Control Quality process because they describe the attributes that are expected in the project deliverables and how these attributes will be measured. Quality metrics are an output from the Plan Quality Management process
Quality Checklists
Quality checklists
provide a documented and structured list of steps, attributes, and guidelines that can be used to ensure that all the quality control work is done correctly. Quality checklists are an output from the Plan Quality Management process.
Work Performance Data
In order to
measure whether the project is being delivered as per the desired quality requirements, you need work performance
data. Work performance data is an output from the Direct and Manage Project Work process.
Approved Change Requests
Approved change requests
can have an impact on the project deliverables and may require modifications, such as defect repairs, and thus are an important input into this process. Approved change requests are an output from the Perform Integrated Change Control process.
Deliverables
Given that the control quality process is focused on checking the quality of the deliverables, having the deliverables
as an input into the process can be viewed as quite critical.
Project Documents
The specific types of project documents
that may be used as inputs into this process include any contracts that specify deliverable requirements and attributes, and any relevant quality audit reports.
Organizational Process Assets
The specific organizational process assets
that can assist with the Control Quality process are any guidelines, processes, policies, or blank templates that the organization has relating to quality control.
Tools and Techniques
The following tools and techniques for this process can be used on the separate inputs to deliver the process outputs.
Seven Basic Quality Tools
The seven basic quality tools
were described in detail earlier in the Plan Quality Management process. They can be used in the Control Quality process to graphically represent and analyze any of the data gathered.
Exam Tip
By now you have probably realized that the seven basic quality tools can be used as tools or techniques in any of the quality management processes.
Statistical Sampling
As part of completing a check on the quality of the deliverables, you may choose to use statistical sampling as a tool or technique, if the number of deliverables is too great to test each one individually or if the sampling would involve destructive testing.
Inspection
Inspection
is one of the key tools of the Control Quality process. It is a physical examination of the deliverable to measure and determine whether it complies with the required standards. As a result of completing inspection, you will generally produce a variety of measurements indicating compliance or noncompliance with the required deliverable standards.
Approved Change Request Review
It is one thing to have approved change requests
; it is another to ensure that they have been implemented as per the change documentation. The way to do this is via the use of an approved change request review.
REAL WORLD
I have often seen assumptions made about approved change requests being carried out. Some people seem to think that simply because the change has been requested and considered and a decision has been made to approve it, the change is automatically carried out. Unfortunately, this isn’t always the case. This is one of the reasons you should record all change requests, their status, any decisions made, and any required follow-up actions on your change-request log. Furthermore, assigning someone to be responsible for not only carrying out the change but also checking that it was carried out correctly is an important factor in making sure all of your approved change requests are implemented.
Outputs
The major outputs from the Control Quality process are the following.
Quality Control Measurements
The
quality control measurements
are the documents you produce as a result of carrying out the Quality Control processes and activities. They should be concise and presented in an appropriate format for easy communication, presentation, and tracking. Quality control measurements go on to be used as an input into the Perform Quality Assurance process.
Validated Changes
The
validated changes
output involves checking that approved change requests and any required modifications have been inspected and comply with the change-request documentation. Validated changes go on to be used as an input into the Monitor and Control Project Work process.
Exam Tip
The process of validation occurs after the process of verification. The process of validation is an important one to understand, as well as how it is different from the process of verification. Verification is about confirmation that the product, service, or result produced complies with agreed specifications or requirements. It is primarily an internal process performed by the delivering organization prior to submitting the product, service, or result for validation, which involves the customer as well. Validation also involves a check that the product, service, or result meets stakeholder requirements. Verification occurs before validation.
Verified Deliverables
You will recall that deliverables
are one of the inputs into the Control Quality process. After they have been subjected to the appropriate tools and techniques to check that they conform to the required standards, if they are accepted, verified deliverables become an output from the process. Verified deliverables go on to be used as an input into the Validate Scope process.
Work Performance Information
You will recall that work performance data is used as an input into the Control Quality process. This is the raw data collected about work performance to date. After it is subjected to the appropriate tools and techniques, it becomes work performance information
. Work performance information then goes on to be used as an input into the Monitor and Control Project Work process.
Change Requests
As a result of carrying out the Control Quality process, there may be a reason to raise a change request to deal with defect repairs, required modifications, or corrective or preventive actions. All change requests should be prepared, submitted, and assessed as per the documented and defined change-control process. Change requests go on to be used as an input into the Perform Integrated Change Control process.
Project Management Plan Updates
Specific parts of the project management plan
that may be updated as a result of the Control Quality process are the quality management plan and the process improvement plan.
Project Document Updates
Specific project documents
that may be updated as a result of the Control Quality process are any relevant quality standards or agreements relating to any aspect of the quality management process.
Organizational Process Asset Updates
Specific organizational process assets
that may be updated include lessons learned databases and any blank templates for any aspect of the organization’s quality management process.
Quick Check
1.
What is the main focus of the Control Quality process?
2.
Which three inputs into the Control Quality process are outputs from the same process in a more refined state?
3.
How does inspection differ from audits?
Quick Check Answers
1.
The main focus of the Control Quality process is to check that the project deliverables meet the required and documented standards. This is in contrast to the Perform Quality Assurance process, which is focused on the processes of the project.
2.
The three inputs are approved change requests, deliverables, and work performance data. Each is used as an input into the Control Quality process and, after the application of appropriate tools, is further refined so that approved change requests become validated changes, deliverables become verified deliverables, and work performance data becomes work performance information.
3.
Inspection is one of the tools of the Control Quality process and involves physical examination of the deliverables produced by the project to determine whether they conform to the required standards. On the other hand, audits are used as a tool in the Perform Quality Assurance process to check whether processes are in place and that they are being followed correctly.
Chapter Summary
The Quality Management knowledge area is focused on the development of the quality management plan and then using this quality management plan to carry out quality assurance to check the project processes and quality control to check the project deliverables.
- The quality tools and techniques are common to all three quality processes.
- The Plan Quality Management process produces the quality management plan for the project, which sets out guidelines and processes for checking both the processes and deliverables for the project.
- The Perform Quality Assurance process focuses on checking that processes are in place and are being followed. It uses a variety of tools and techniques, including audits.
- The Control Quality process is focused on checking project deliverables and approved change requests for conformity to requirements.
Exercise
The answer for this exercise is located in the “Answers” section at the end of this chapter.
1.
Match up the quality tool on the left with the description on the right.
Quality Tool | Definition |
|---|---|
1. Histogram | A. A diagramming technique showing relationships and sequencing of quality activities so you can determine the critical path of activities |
2. Tree diagram | B. A diagram that groups similar concepts under relevant headings that can then be used to generate cause-and-effect diagrams |
3. Pareto diagram | C. A process of comparing your quality activities to those of other projects or organizations |
4. Flowchart | D. A standardized and documented list of quality activities to be carried out and confirmed as completed |
5. Prioritization matrix | E. A graphical representation of data points measured against an expected mean with control limits set three standard deviations either side of the mean |
6. Affinity diagram | F. A diagram showing the sequence of steps in a process using standardized shapes to represent different activities |
7. Matrix diagram | G. A bar chart showing frequency of discrete data |
8. Scatter diagram | H. A graphical representation showing multiple cause-and-effect relationships among various factors |
9. Ishikawa diagram | I. A diagrammatic way of representing effects and their possible causes |
10. Activity network diagram | J. A diagram that shows how multiple variables interact with each other |
11. Control chart | K. A diagram showing the individual and cumulative frequency of events to determine which 20% of events cause 80% of the problems |
12. Process decision program chart | L. A diagram showing the weighted scoring of variables to determine the priority of activities |
13. Interrelationship digraph | M. A graphical way to show the hierarchy of steps in a process in order to understand the sequence of activities to reach a goal |
14. Benchmarking | N. A diagram with data points showing the correlation between two variables, each represented on a vertical or horizontal axis |
15. Statistical sampling | O. A process of testing that takes a small population and extrapolates the result to a larger population |
16. Checksheet | P. A diagram of hierarchical relationships and parent-to-child relationships |
Review Questions
Test your knowledge of the information in Chapter 6 by answering these questions. The answers to these questions, and the explanations of why each answer choice is correct or incorrect, are located in the “Answers” section at the end of this chapter.
1.
What are the three processes in the Quality Management knowledge area?
A.
Control Quality, Perform Quality Assurance, Plan Quality Management
B.
Plan Quality Management, Control Assurance, Perform Quality Control
C.
Perform Quality Control, Determine Quality, Plan Quality Management
D.
Plan Quality Management, Assure Quality, Control Quality
2.
Which of the following is not one of the seven basic quality tools?
A.
Benchmarking
B.
Scatter diagram
C.
Control chart
D.
Pareto diagram
3.
What does it mean if a single data point appears above the upper specification limit on a control chart?
A.
The process is in control, and the customer is happy.
B.
The process may be out of control, and consideration should be given to checking the process in the near future.
C.
A single data point outside the upper specification is okay. You only need to be concerned if there are seven consecutive data points outside either of the specification limits.
D.
The process is out of control and requires immediate action, because the customer will not accept any deliverables outside the specification limit.
4.
What is the best definition of quality?
A.
Quality is whatever the customer says is right.
B.
Quality is the degree to which a product can be used for its intended purpose.
C.
Quality is the degree to which a set of inherent characteristics fulfills requirements.
D.
Quality is the number features the product has.
5.
What is the best definition of the principle of kaizen?
A.
Defining quality processes and checking that they are being used
B.
Continuously improving
C.
Checking the quality of the product
D.
Having a quality management plan
6.
If you are considering the impact of potential future warranty claims as part of your quality management plan, what are you considering?
A.
Cost of quality
B.
Quality assurance
C.
Benchmarking
D.
Prevention over inspection
7.
If you are using a diagram to determine the potential causes of quality issues, what are you using?
A.
Control chart
B.
Histogram
C.
Checksheet
D.
Fishbone diagram
8.
If you are testing and measuring a small sample and extrapolating those results to be indicative of a total population, what tool or technique are you using?
A.
Benchmarking
B.
Statistical sampling
C.
Design of experiments
D.
Brainstorming
9.
If you are conducting an audit to check whether processes are being followed correctly, what process are you involved in?
A.
Plan Quality Management
B.
Control Quality
C.
Perform Quality Assurance
D.
Perform Quality Audit
10.
What are the variables and allowable variations called that should be measured as part of the Perform Quality Assurance and Control Quality processes?
A.
Quality control measurements
B.
Quality checklists
C.
Quality metrics
D.
Cost of quality
11.
Which quality process uses inspection as a tool or technique?
A.
Plan Quality Management
B.
Control Quality
C.
Perform Quality Assurance
D.
Perform Quality Inspection
Answers
This section contains the answers for the Exercises and Review Questions in this chapter.
Exercises
1.
Match up the quality tool on the left with the description on the right.
Quality Tool | Definition |
|---|---|
1. Histogram | G. A bar chart showing frequency of discrete data |
2. Tree diagram | P. A diagram of hierarchical relationships and parent-to-child relationships |
3. Pareto diagram | K. A diagram showing the individual and cumulative frequency of events to determine which 20% of events cause 80% of the problems |
4. Flowchart | F. A diagram showing the sequence of steps in a process using standardized shapes to represent different activities |
5. Prioritization matrix | L. A diagram showing the weighted scoring of variables to determine the priority of activities |
6. Affinity diagram | B. A diagram that groups similar concepts under relevant headings that can then be used to generate cause-and-effect diagrams |
7. Matrix diagram | J. A diagram that shows how multiple variables interact with each other |
8. Scatter diagram | N. A diagram with data points showing the correlation between two variables, each represented on a vertical or horizontal axis |
9. Ishikawa diagram | I. A diagrammatic way of representing effects and their possible causes |
10. Activity network diagram | A. A diagramming technique showing relationships and sequencing of quality activities so you can determine the critical path of activities |
11. Control chart | E. A graphical representation of data points measured against an expected mean with control limits set three standard deviations either side of the mean |
12. Process decision program chart | M. A graphical way to show the hierarchy of steps in a process in order to understand the sequence of activities to reach a goal |
13. Interrelationship digraph | H. A graphical representation showing multiple cause-and-effect relationships among various factors |
14. Benchmarking | C. A process of comparing your quality activities to those of other projects or organizations |
15. Statistical sampling | O. A process of testing that takes a small population and extrapolates the result to a larger population |
16. Checksheet | D. A standardized and documented list of quality activities to be carried out and confirmed as completed |
Review Questions
1.
Correct Answer: A
A.
Correct: The three processes in the Quality Management knowledge area are Plan Quality Management, Perform Quality Assurance, and Control Quality.
B.
Incorrect: There is no process called Control Assurance.
C.
Incorrect: There is no process called Perform Quality Control or Determine Quality.
D.
Incorrect: There is no process called Assure Quality.
2.
Correct Answer: A
A.
Correct: Benchmarking is a tool that is used in quality management, but it is not one of the seven basic quality tools.
B.
Incorrect: The scatter diagram is one of the seven basic quality tools, which include cause-and-effect diagrams, flowcharts, checksheets, Pareto diagrams, histograms, control charts, and scatter diagrams.
C.
Incorrect: The control chart is one of the seven basic quality tools.
D.
Incorrect: The Pareto diagram is one of the seven basic quality tools.
3.
Correct Answer: D
A.
Incorrect: A data point outside the specification limit does not mean that the process is in control; the customer will not pay for anything that is outside the specification limit.
B.
Incorrect: A data point outside the specification limit indicates that the process is definitely out of control.
C.
Incorrect: A single data point outside the specification limit indicates that something is wrong. The rule of seven applies to consecutive data points within the control limits.
D.
Correct: Any data point outside the specification limits indicates that the process is out of control and should be investigated immediately.
4.
Correct Answer: C
A.
Incorrect: Quality doesn’t necessarily relate to what the customer says is right, unless what the customer says is right is captured in the requirements.
B.
Incorrect: Quality is more than the degree to which a product can be used for its intended purpose.
C.
Correct: Quality is the degree to which a set of inherent characteristics fulfills requirements—remember this definition for the exam.
D.
Incorrect: The number of features a product has or does not have refers to grade, not quality.
5.
Correct Answer: B
A.
Incorrect: Defining quality processes and checking that they are being used is the process of quality assurance.
B.
Correct: Kaizen is the loose Japanese translation of the term continuously improving.
C.
Incorrect: Checking the quality of the product is the process of quality control.
D.
Incorrect: Have a quality management plan is the process of planning quality management.
6.
Correct Answer: A
A.
Correct: Cost of quality, mirrored by the cost of low quality, considers the impacts of quality decisions over the entire life of the product.
B.
Incorrect: Quality assurance is the process of defining processes and checking that you are using them as planned.
C.
Incorrect: Benchmarking is the process of comparing your efforts against other projects or organizations.
D.
Incorrect: Prevention over inspection is a key concept of the overall approach to project quality management.
7.
Correct Answer: D
A.
Incorrect: A control chart maps data points against an expected mean, upper and lower control limits set three standard deviations either side of the mean, and upper and lower specification limits.
B.
Incorrect: A histogram, or bar chart, is a graphical way of representing frequency or total occurrences of data.
C.
Incorrect: A checksheet is a standardized description of processes, steps and information to be completed or gathered.
D.
Correct: A fishbone diagram, also called an Ishikawa diagram or cause-and-effect diagram, shows a graphical representation of potential causes of a particular event.
8.
Correct Answer: B
A.
Incorrect: Benchmarking is the process of comparing your efforts against other projects or organizations.
B.
Correct: Statistical sampling means taking a small sample of a total population for testing and then assuming those results apply to the entire population. It is used when there are simply too many tests to be done or when the testing involves destructive testing.
C.
Incorrect: Design of experiments is the process of designing, and considering the implications and effects on the results, of experiments to determine quality.
D.
Incorrect: Brainstorming is a technique that gathers a group of people together and encourages them to think laterally about a particular issue.
9.
Correct Answer: C
A.
Incorrect: Plan Quality Management is the initial planning process and delivers the quality management plan.
B.
Incorrect: Control Quality uses inspection to determine the quality of the product.
C.
Correct: Perform Quality Assurance is the process of establishing processes and checking that you are following them by conducting audits.
D.
Incorrect: Perform Quality Audit is a made-up process name.
10.
Correct Answer: C
A.
Incorrect: Quality control measurements are the measurements taken that allow you to assess whether quality metrics are being achieved.
B.
Incorrect: A quality checklist is a standardized description of processes, steps, and information to be completed or gathered.
C.
Correct: Quality metrics are defined during the Plan Quality Management process and set out the variables and allowable variations that should be measured as part of the Perform Quality Assurance and Control Quality processes.
D.
Incorrect: Cost of quality considers the impact of quality decisions over the entire life of the product.
11.
Correct Answer: B
A.
Incorrect: Plan Quality Management is the initial planning process and delivers the quality management plan. It does not use inspection as a tool or technique.
B.
Correct: The Control Quality process is focused on checking the quality of the product or deliverable and uses inspection as a tool.
C.
Incorrect: Perform Quality Assurance is the process of establishing processes and checking that you are following them by conducting audits. It does not use inspection as a tool or technique.
D.
Incorrect: Perform Quality Inspection is a made-up process name.