This chapter focuses on the topic of project time management. Project Time Management, like the other knowledge areas, begins with a process of planning that produces a schedule management plan. Then there is an iterative, or repeating, process that produces and updates the project schedule. Then, as with all other knowledge areas with the exception of the Human Resource Management knowledge area, there is a controlling process that seeks to measure planned versus actual progress in relation to time and deal with any changes or corrective or preventive actions.
You may need to pay particular attention in this chapter to those activities that lead up to the construction of the network diagram, because there is quite a bit of technical information you need to learn.
The PMBOK
®
Guide Processes
Project Time Management Knowledge Area
The seven processes in the Project Time Management knowledge area
are as follows:
- Plan Schedule Management (planning process)
- Define Activities (planning process)
- Sequence Activities (planning process)
- Estimate Activity Resources (planning process)
- Estimate Activity Durations (planning process)
- Develop Schedule (planning process)
- Control Schedule (monitoring and controlling process)
What Is Project Time Management?
Project time management is focused on the processes of developing a schedule management plan, estimating durations for activities and the overall project, preparing your project schedule, ensuring that the project progresses as planned and that milestones are reached on the communicated schedule, and influencing and assessing any changes to the project schedule.
Exam Tip
Some industries use the term schedule in reference to a schedule of materials to be used in the execution of the project. For the exam, you should note that the word schedule is used exclusively to mean project time estimates.
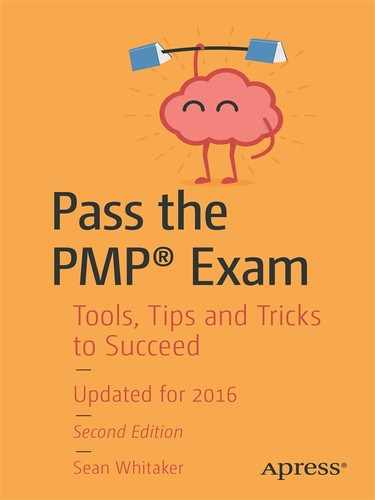
Apart from the Control Schedule process
, the processes contained in this knowledge area present what appears to be a wonderfully logical and sequential flow of information, from defining activities through to development of the project schedule. Figure 4-1 shows the general flow through this linear process.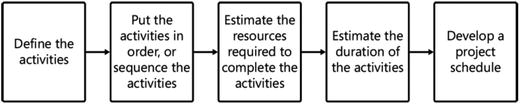
Figure 4-1.
The sequential flow of the Project Schedule Development Process
REAL WORLD
Even though the project time management processes are often presented as separate, discrete processes, I have always found that the process of developing a project schedule is in fact done as one process, usually all at the same time.
Exam Tip
Remember that the output of the time management processes is the project schedule, which refers to all elements of time management on a project and not just the ubiquitous Gantt chart. Also remember that a project management plan is more than just a Gantt chart.
Plan Schedule Management
More Info
Plan Schedule Management You can read more about the Plan Schedule Management process in the PMBOK Guide, 5th edition, in Chapter 6, section 6.1. Table 4-1 identifies the process inputs, tools and techniques, and outputs.
Table 4-1.
Plan Schedule Management Process
Inputs ➪ | Tools and Techniques ➪ | Outputs |
|---|---|---|
• Project management plan • Project charter • Enterprise environmental factors • Organizational process assets | • Expert judgment • Analytical techniques • Meetings | • Schedule management plan |
The Plan Schedule Management process is a planning process with a single output—not surprisingly, given the name of the process, it is the schedule management plan. Like all other planning documents, the schedule management plan will guide your efforts in defining and controlling the project schedule. It will form a subsidiary plan to the overall project management plan.
The Plan Schedule Management process covers the following planning domain
task:
- Task 4: Develop the project schedule based on the approved project deliverables and milestones, scope, and resource management plans, in order to manage timely completion of the project.
Inputs
The Plan Schedule Management process uses some or all of the following inputs as part of the development of the schedule management plan for the project.
Project Management Plan
Any reference to the project management plan includes a reference to all subsidiary management plans that it contains. Obviously, any aspect of work on the project will incur some time; therefore, the project management plan, with its information about other areas, provides a useful input into planning your particular approach to schedule management. Any and all information relating to the project scope, project cost, project risk, project communications, project procurement, and stakeholder expectation management will be useful in assisting you develop your schedule management plan.
Project Charter
The project charter
, which is the foundational document of the project, providing and confirming financial and political support for the project, contains useful information about the known statement of work, any initial known constraints and assumptions, and an assessment of the known risks. This preliminary information contained in the project charter is particularly useful when you first begin defining your project schedule.
Enterprise Environmental Factors
Enterprise environmental factors
are any factors external to the project that can influence the outcome; they can usually be viewed as some sort of constraint on the project. Particular enterprise environmental factors that may assist with development of your schedule management plan include the wider organizational culture and structure and the inherent skills available throughout the organization. Additional enterprise environmental factors that are useful in developing a project schedule include any external published commercial information that can be used to estimate time on a project, and any company work-authorization systems.
Organizational Process Assets
Organizational process assets
that may play an important part as inputs into the development of your schedule management plan include historical information, blank templates, and project management methodology guidelines.
Exam Tip
Historical information and lessons learned are considered to be two of the most important organizational process assets that any project manager can rely on in the development of any part of the project management plan. On the exam, you will find an emphasis on historical information and lessons learned as important inputs into many processes.
Tools and Techniques
The following tools and techniques
are available to be used to develop the inputs into this process in order to produce the schedule management plan.
Expert Judgment
Again, expert judgment
is used as a tool. Expert judgment is the advice and opinion of any person or group who holds specific knowledge about a particular area. You as project manager are considered to be an expert, your project team members are experts, and any other person with specialist knowledge you choose to consult is also an expert.
Exam Tip
Deciding to use expert judgment is one thing; how you get the information from selected experts is another matter and is the subject of other information-gathering tools and techniques, such as meetings, the Delphi technique, interviews, questionnaires, and surveys.
Analytical Techniques
As part of the development of the schedule management plan, you have to make decisions about which processes, tools, and techniques are best used in your particular project. This process of analyzing the potential options available to you is referred to as using
analytical techniques
.
Meetings
Meetings
are a useful tool to bring together everyone with experience in developing the schedule management plan. When run properly, they are an effective and efficient means of getting work done. The most useful people to invite to these particular meetings are members of the project team and people with experience in developing schedules.
Outputs
After applying the appropriate tools and techniques to the selected inputs, the Plan Schedule Management process has the following output.
Schedule Management Plan
The Plan Schedule Management process has only a single output: the
schedule management plan
. The schedule management plan is a subsidiary plan of the project management plan. The purpose of the schedule management plan is to guide the project manager and the project team; the plan also guides further activities, such as defining and developing the project schedule, checking for variance between what has been planned and what is actually happening, and managing any changes to the project schedule. As such, it is an important plan to have in place in order to provide oversight, standardization, and best practices to ensure that the project schedule, itself an essential part of any successful project, is well developed, monitored, and controlled.
Exam Tip
Always assume that any aspect of your project management activities has some form of plan guiding it. The absence of a plan will result in inefficient and ineffective efforts that can increase the chances of project failure.
The schedule management plan is then a key input into the following processes, all of which are planning processes:
- 6.2 Define Activities
- 6.3 Sequence Activities
- 6.4 Estimate Activity Resources
- 6.5 Estimate Activity Durations
- 6.6 Develop Schedule
Quick Check
1.
What is the main purpose of the schedule management plan?
2.
Why is the project charter an important input into the Plan Schedule Management process?
3.
What role does the schedule management plan have in the overall project management plan?
Quick Check Answers
1.
The main purpose of the schedule management plan is to provide a documented guide as to how your project schedule will be defined, documented, and used to check the actual versus planned schedule, and to outline how any potential changes will be managed and assessed.
2.
At the beginning of the development of your project schedule, the project charter provides a wealth of preliminary information about the statement of work, constraints, assumptions, risks, and other information that will ultimately affect the project schedule.
3.
The schedule management plan is a subsidiary plan of the overall project management plan that focuses on the particular area of project time management.
Define Activities
More Info
Define Activities You can read more about the Define Activities process in the PMBOK Guide, 5th edition, in Chapter 6, section 6.2. Table 4-2 identifies the process inputs, tools and techniques, and outputs.
Table 4-2.
Define Activities Process
Inputs ➪ | Tools and Techniques ➪ | Outputs |
|---|---|---|
• Schedule management plan • Scope baseline • Enterprise environmental factors • Organizational process assets | • Decomposition • Rolling-wave planning • Expert judgment | • Activity list • Activity attributes • Milestone list |
The Define Activities process is a planning process that takes the already-defined work packages from the Create WBS process and breaks them down further into individual activities.
The Define Activities process covers the following planning domain
task:
- Task 4: Develop the project schedule based on the approved project deliverables and milestones, scope, and resource management plans, in order to manage timely completion of the project.
The difference between an activity and a work package is that an activity is the smallest component of work to be performed during the course of a project. A work package is a convenient level of work to stop at when completing the work breakdown structure (WBS), because at that point the work can reliably be estimated for time and cost. Breaking work packages down into activities for the purposes of the WBS has a decreasing benefit given the time and effort taken to do this. However, for the purpose of putting together an accurate project schedule, you must break work packages down even further to the level of activities.
REAL WORLD
When completing any decomposition of the project scope statement, it sometimes seems arbitrary to stop the decomposition process at the level of work packages and then come back later to break them down further into activities. Therefore, during the process of decomposition of the scope, whether to show it graphically in a WBS or to obtain a list of work packages and activities to put into the project schedule, I generally do both processes at the same time.
Inputs
The Define Activities process uses some or all of the following four inputs
.
Schedule Management Plan
The schedule management plan
is obviously a key input into the Define Activities process because the schedule management plan contains information about how you will break down activities and the level of detail expected from the activities listed. The schedule management plan is an output from the Plan Schedule Management process.
Scope Baseline
The scope baseline
is used to ensure that the project manager captures all the activities contained in the project scope. When breaking down the project scope into its component parts, you can use the scope baseline and all the information it contains to ensure that you have captured all the activities required to complete the project. The scope baseline is an output of the Create WBS process.
Exam Tip
Remember that the scope baseline includes the following three elements: the project scope statement, the WBS, and the WBS dictionary.
Enterprise Environmental Factors
The specific types of enterprise environmental factors
that are useful as inputs into the Define Activities process are any aspects of the project management information system, any relevant parts of the organizational culture and structure, and any published information from commercial databases.
Organizational Process Assets
The specific types of organizational process assets
that are useful as inputs into the Define Activities process are any existing project management methodologies, processes, and templates that can assist with the development of the project schedule. Additionally, any configuration management system that defines how different versions of the project schedule are recorded, controlled, and updated can be used as an input. This is particularly important to ensure that you are always working on the correct version of any document in what can be a highly iterative process. Of course, any historical information from past projects that can be used to assist in the compilation of the current project management plan is also useful.
Tools and Techniques
The following three tools and techniques
are used on the inputs to deliver the process outputs.
Decomposition
You have read about the process of decomposition used in the Create WBS process to take the scope of the project and decompose it down to the work package level. As a tool and technique in the Define Activities process, it is used to further decompose the already-defined work packages to activity level.
Rolling-Wave Planning
Rolling-wave planning
is a key iterative element of the project manager’s planning process. It is a form of progressive elaboration in which you can plan in detail work that is in the immediate future, and plan in less detail work that is further off.
A good example of rolling-wave planning
is when you have a project that is to go on for two and a half years. You will spend most of your planning activity on the work coming up in the next three months. Work to be done from three months to nine months out will have a lesser level of detail attached to it during planning, but still enough to give you confidence about project time and cost. Work that is to be done beyond the nine-month period may have a very low level of detail attached to its time and cost elements.
Expert Judgment
You may decide to call on the expert judgment
of people with skills and experience in this type of project and in the preparation of project schedules, in order to more accurately define your project activities.
Outputs
The Define Activities process produces some or all of the following outputs.
Activity List
The
activity list
is a comprehensive list that includes all currently known activities. In addition to listing the title and brief description of the activity, the activity list can provide additional information such as a unique identification number, which is an example of the configuration management system at work, and any other relevant ancillary information.
It is important to note that if you are undertaking any form of progressive elaboration or rolling-wave planning, you may only have identified and defined the activities for the next immediate time period; definition and documentation of activities beyond this may yet need to be done.
The activity list is used as an input into the following processes:
- 6.3 Sequence Activities
- 6.4 Estimate Activity Resources
- 6.5 Estimate Activity Durations
- 6.6 Develop Schedule
Activity Attributes
The
activity attributes
are to the activity list what the WBS dictionary is to the WBS. The activity list contains summary information about each activity, whereas the activity attributes document provides more detailed information about each of the activities. This detailed information can include any requirements, known constraints and assumptions, required milestones, and any other information that helps any person wanting to know more about the activity to understand it fully.
The activity attributes
document is used as an input into the following processes:
- 6.3 Sequence Activities
- 6.4 Estimate Activity Resources
- 6.5 Estimate Activity Durations
- 6.6 Develop Schedule
Milestone List
As part of the development of the project schedule, and after the project activities have been defined, the project manager, in consultation with relevant stakeholders, may be able to produce a list of known milestones that should be achieved on the project. The milestone list contains these documented milestones.
Exam Tip
Remember that a milestone has no duration and indicates a particular moment in time, usually when some specific work package or phase of a project has been completed. A milestone is often used as a point in the project where an assessment of work to date is done and decisions made about whether the project will continue.
REAL WORLD
I often use the milestone list and a description of which milestones have been achieved and which ones have not yet been achieved as a high-level way of communicating project progress quickly to senior stakeholders on the project.
Quick Check
1.
What is the difference between an activity and a work package?
2.
How is rolling-wave planning used?
3.
What is the primary purpose of the activity attributes document?
Quick Check Answers
1.
A work package is the lowest level of decomposition in the work breakdown structure (WBS). It represents a parcel of work that can reliably be estimated for time and cost. On the other hand, an activity is a decomposed work package, broken down into the actual tasks that need to be done on a project.
2.
Rolling-wave planning is an important tool to use on long-term projects. With rolling-wave planning, planning and detail is done for the immediate time period, and time periods that are further out are planned in less detail.
3.
The primary purpose of the activity attributes document is to provide further and more detailed information about each of the activities in the activity list.
Sequence Activities
More Info
Sequence Activities You can read more about the Sequence Activities process in the PMBOK Guide, 5th edition, in Chapter 6, section 6.3. Table 4-3 identifies the process inputs, tools and techniques, and outputs.
Table 4-3.
Sequence Activities Process
Inputs ➪ | Tools and Techniques ➪ | Outputs |
|---|---|---|
• Schedule management plan • Activity list • Activity attributes • Milestone list • Project scope statement • Enterprise environmental factors • Organizational process assets | • Precedence diagramming method (PDM) • Dependency determination • Applying leads and lags | • Project schedule network diagrams • Project document updates |
The Sequence Activities process is a planning process that takes the list of activities that have already been defined and starts to put them in the order in which they will be completed.
The Sequence Activities process covers the following planning domain
task:
- Task 4: Develop the project schedule based on the approved project deliverables and milestones, scope, and resource management plans, in order to manage timely completion of the project.
Inputs
The inputs
used in this process allow for sequencing of the already-defined project activities.
Schedule Management Plan
The schedule management plan
is used as a key input into the Sequence Activities process because it outlines and defines how and when you will sequence the activities. The schedule management plan is an output from the Plan Schedule Management process.
Activity List
The activity list
is a very important input into the Sequence Activities process, because you need the list of activities to put them in order. The activity list is an output from the Define Activities process.
Activity Attributes
The activity attributes
document provides additional information about each of the activities that may be useful when it comes to deciding whether they are predecessors or successors for any other activity. The activity attributes document is an output from the Define Activities process.
Milestone List
The milestone list
is an important input because it has a description of the known project milestones, and with this you can determine which activities must be completed before the milestone and which must be completed after the milestone. The milestone list is an output from the Define Activities process.
Project Scope Statement
The project scope statement
is used as an input into the Sequence Activities process because it allows you to understand the complete scope of work to be delivered in the project. Thus you can get a clear idea of which activities must be performed before other activities.
Enterprise Environmental Factors
The specific types of enterprise environmental factors
that are of use during the Sequence Activities process are scheduling tools, government or industry standards, and any other external factors affecting the order in which work is to be completed on your project.
Organizational Process Assets
The specific organizational process assets
that can assist you in sequencing the activities include any existing processes, templates, historical information, or lessons learned documentation that the organization owns.
Tools and Techniques
The three tools and techniques of this process are all used on the separate inputs to deliver the process outputs.
Precedence Diagramming Method (PDM)
The precedence diagramming method (PDM) is a graphical representation of activities in a project, represented on nodes, with the relationships between them indicated by arrows. This is more commonly called the activity-on-node (AON) diagram. It establishes a predecessor and successor relationship between activities. An activity can be a predecessor of other activities, meaning it must be done before them. The same activity can also be a successor activity to one or more activities, meaning it must be done after them.
As mentioned already, a predecessor activity
is one that comes before another activity, and a successor activity is one that comes after another activity. A predecessor activity may have many successor activities, in which case it is known as a burst activity. A successor activity may have one or more predecessor activities. If the successor activity has more than one predecessor activity, it is known as a merge activity. Figure 4-2 shows an example of Activity A as the predecessor activity, with Activities B and C as the successor activities. Activity A is also a burst activity.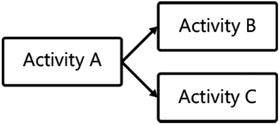
Figure 4-2.
Predecessor and successors
Four types of relationships exist between predecessor and successor activities:
- Finish-to-start (FS ): The successor activity cannot start until the predecessor activity has finished. For example, you cannot erect the walls of a house until the foundation has been completed. Figure 4-3 depicts how this would be represented diagrammatically.
 Figure 4-3.Finish-to-start relationship
 - Finish-to-finish (FF ): The successor activity cannot finish until the predecessor activity has finished. For example, you cannot finish writing the user manual for a piece of software until the testing is finished. Figure 4-4 depicts how this would be represented diagrammatically.
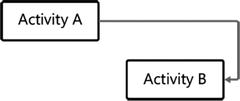 Figure 4-4.Finish-to-finish relationship
 - Start-to-start (SS ): The successor activity cannot start until the predecessor activity starts. For example, you cannot begin testing a new piece of software until you have started writing the code. Figure 4-5 depicts how this can be represented diagrammatically.
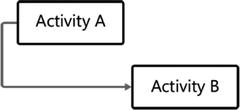 Figure 4-5.Start-to-start relationship
 - Start-to-finish (SF): The successor cannot finish until predecessor starts. For example, you may have an activity that is to send the invoice for a product, but the invoice cannot be sent (finished) until delivery of the product has started. This type of relationship is almost never used, because it seems to indicate that the successor should be the predecessor and vice versa. Figure 4-6 depicts how this would be represented diagrammatically.
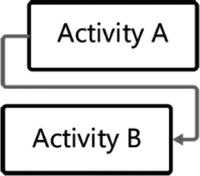 Figure 4-6.Start-to-finish relationship
REAL WORLD
In most project management scheduling software, the default relationship for activities is finish-to-start. Check it out: if you enter FS after a predecessor, the FS disappears. However, if you enter FF, SS, or SF, it remains.
Dependency Determination
In addition to the types of relationships that exist between predecessor and successor activities, there are also four types of dependencies that determine the nature of the relationship between the two activities.
- Mandatory dependencies : The successor activity must always occur after the predecessor activity. For example, you must develop the code for a piece of software before you begin testing it.
- Discretionary dependencies : The successor activity should occur after the predecessor activity, although the two activities can be performed in another sequence if necessary.
Exam Tip
Be aware that discretionary dependencies have some flexibility built into them in terms of how they are scheduled. Generally, they should be performed in sequence, with successor activities after their predecessor activities, but they can be performed in parallel if necessary. There can be an increased risk associated with performing discretionary dependencies in parallel rather than in sequence, and this additional risk would need to be considered when putting together the project schedule.
- External dependencies : The activity is dependent on an activity being completed outside of the project. For example, you cannot start construction on the house until you have received building consent.
- Internal dependencies : The activity relies on another activity that is external to the project but internal to the broader organization. For example, the recruitment of people on your project may be done by the human resources department, and you have to wait until they complete the work.
Applying Leads and Lags
As you start to put together your project network diagram by beginning with the sequencing of the activities, you can also choose to apply leads and lags. A lead is the amount of time a successor activity can start before its predecessor activity finishes. For example, generally speaking, you do not start building the walls of a house until construction of the foundation has been completed. However, you can get a lead on the construction of the walls by having them built off site.
The opposite of a lead is a lag. A lag is the amount of time a successor activity must wait after its predecessor activity has finished before it can start. For example, in the case of pouring concrete for a house foundation, you must wait several days while the concrete cures before you can start building on it. Because the concrete curing period has neither resources nor costs assigned to it, it cannot be included as an activity in your network diagram. Instead, you indicate that the successor activities must wait via a lag before they can begin.
REAL WORLD
If you want to indicate a lead between a successor and its predecessor by using Microsoft Project, Primavera, or ProjectLibre, this can be done by using the relationship acronym, such as finish-to-start (FS), and a minus sign followed by the number of time periods the activity can start before the completion of its predecessor. For example, FS – 4 means the successor activity has a finish-to-start relationship with its predecessor activity and can start four days before the predecessor activity ends. If you want to indicate a lag, you can do this by using a plus sign after the relationship acronym. For example, if you want to indicate a lag of three days, you simply write the task ID number of the predecessor and then, for a finish-to-start relationship, FS + 3.
Outputs
The major outputs from the Sequence Activities process are the following.
Project Schedule Network Diagrams
The
project schedule network diagram
represents all the activities in the project and the relationships between them all. The process of completing the sequencing of activities is the first step in the completion of the project schedule network diagram. This first pass, which indicates the relationships between the activities, will be further fleshed out with more information in the coming processes as you use the resource estimates to define the durations of each of the activities. Then you will be able to calculate the total project duration, the amount of slack or float in the project, and the critical path or paths.
Figure 4-7 shows what an activity-on-node (AON) network
diagram might look like at the end of the sequencing process. Information about each activity is represented in the nodes on the diagram, and the arrows indicate the relationships between the activities. In this case, they are all finish-to-start (FS
) relationships. The AON diagram is the most popular graphical way of representing a network, but there is another less intuitive way called the activity-on-arrow (AOA) diagram.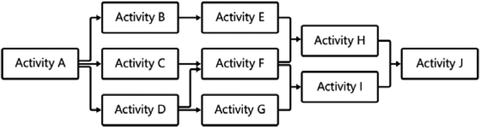
Figure 4-7.
Activity-on-node network
diagram
REAL WORLD
It is highly unlikely that you will need to know how to construct a network diagram manually in the real world. I have found that the main benefit of knowing how to put together a network diagram, calculate the project duration, calculate any slack in the network diagram, and determine a critical path is for understanding and appreciating how project management software works. Perhaps the only time you will need to know how to do this manually is for a small part of your project schedule at short notice when software isn’t available.
Exam Tip
The other way to graphically represent a network diagram is called the arrow diagramming method or the activity-on-arrow (AOA) diagram. The AOA diagram is not used very much in the project management world, because it seems to run counter to the logical representations of activities and the relationships between them. Because the activities themselves are represented by arrows, it becomes a problem to also use arrows to show relationships between activities; so where there are multiple predecessors to an activity, a dummy activity is used, represented by a dotted line. Figure 4-8 shows an example of an AOA diagram with a dummy activity showing a relationship between Activities B and G. On the exam, if you find a reference to a dummy activity, you know it is referring to AOA diagrams.
Figure 4-8.
Activity-on-arrow (AOA)
diagram
Project Document Updates
The types of project documents that may be updated as a result of the Sequence Activities process are the activity list, activity attributes, and any other relevant documents.
Quick Check
1.
What is the most commonly used type of relationship between predecessor and successor activities?
2.
What is the difference between a lead and a lag?
3.
What is the difference between an activity-on-node diagram and an activity-on-arrow diagram?
Quick Check Answers
1.
The most commonly used type of relationship between predecessor and successor activities is a finish-to-start relationship.
2.
A lead is the amount of time a successor activity can start before its predecessor finishes, whereas a lag is the amount of time a successor activity must wait after its predecessor activity finishes.
3.
An activity-on-node diagram represents the project activities on nodes, with the arrows between the nodes representing the types of relationships. An activity-on-arrow diagram shows the activities of the project occurring on the arrows themselves, with nodes representing where multiple activities join.
Estimate Activity Resources
More Info
Estimate Activity Resources
You can read more about the Estimate Activity Resources process in the PMBOK Guide, 5th edition, in Chapter 6, section 6.4. Table 4-4 identifies the process inputs, tools and techniques, and outputs.
Table 4-4.
Estimate Activity Resources Process
Inputs ➪ | Tools and Techniques ➪ | Outputs |
|---|---|---|
• Schedule management plan • Activity list • Activity attributes • Resource calendars • Risk register • Activity cost estimates • Enterprise environmental factors • Organizational process assets | • Expert judgment • Alternative analysis • Published estimating data • Bottom-up estimating • Project management software | • Activity resource requirements • Resource breakdown structure • Project document updates |
The key area of focus in the Estimate Activity Resources process is to consider the defined activities and carry out the process of estimating what resources will be required to complete the work.
The Estimate Activity Resources process covers the following planning domain
task:
- Task 4: Develop the project schedule based on the approved project deliverables and milestones, scope, and resource management plans, in order to manage timely completion of the project.
Note
Defining resources A resource can be defined as any person, team, machinery, equipment, material, or funds used to do work on the project.
Inputs
There are eight inputs
into the Estimate Activity Resources process, all specifically designed to assist you in producing the outputs.
Schedule Management Plan
Again, the schedule management plan appears as a primary input into a process devoted to producing the project network diagram. This is because the schedule management plan is the document that describes and defines your approach to producing a project schedule. The schedule management plan is an output from the Plan Schedule Management process.
Activity List
The activity list
provides information about all the activities you have defined. You use this information to estimate individual resources assigned to each activity. The activity list is an output from the Define Activities process.
Activity Attributes
The activity attributes document provides additional information about each activity on your activity list. This information can refer to which resources are available. The activity attributes document is an output from the Define Activities process.
Resource Calendars
Resource calendars
are a key input into this process because they define constraints on when resources are available to work. They define such things as normal working times, holidays, and any other constraints on when resources may be available. Resource calendars are an output from the Acquire Project Team process in the Human Resource Management knowledge area.
Risk Register
The
risk register
is used to assist with estimating activity resources because it documents any known risks that might affect resources you plan to use on the project. The risk register is an output from the Identify Risks process in the Risk Management knowledge area.
Activity Cost Estimates
You can use activity cost estimates to determine the cost of the resources you may be considering for each activity. Activity cost estimates are an output from the Estimate Costs process in the Cost Management knowledge area.
Enterprise Environmental Factors
The specific types of enterprise environmental factors
that can be used in this process include any constraints imposed on resource availability for the project, such as government regulations on mandatory types of resources that must be used, or perhaps regulations of health and safety that affect the number of people who must be present in a workplace.
Organizational Process Assets
The specific types of organizational process assets
that can be used as inputs into this process include any existing processes and templates, any relevant human resource policies, and any relevant policies in relation to procurement of supplies and equipment that the organization has. Additionally, a key organizational process asset is always historical information from previous projects.
Tools and Techniques
The following tools and techniques are available, if appropriate, to use on the selected inputs.
Expert Judgment
Expert judgment
is a key tool, because you will use the judgment of experts to help produce the activity resource estimates. The types of experts you should consult are those people with prior and specialized knowledge in resource planning on a project similar to your own.
Alternative Analysis
The process of
alternative analysis
considers all the permutations of delivering an activity by using different combinations of resources, quantities of resources, and types of resources, and whether you will rent or buy the resources you require.
Published Estimating Data
Published estimating data
is a convenient means of getting reliable data from commercial sources. This published estimating data can give you information about what resources are available, the cost of these resources, and the work rate of the resources.
Exam Tip
You will use published estimating data as a tool for cost-estimating processes as well.
Bottom-Up Estimating
Bottom-up estimating
is an estimating process that begins at a low level of the WBS, such as at individual work packages or even at the activity level, and works upward by aggregating, or adding up, resource estimates in each level of the WBS to arrive at a high-level estimate. Bottom-up estimating is generally considered to be more accurate than top-down estimating, but it involves more time and effort to complete.
Project Management Software
Most projects plan to use many different types of resources, and it is neither effective nor efficient to do this process manually. This is where using project management software provides a definite advantage, because it can process information more quickly.
Outputs
The following outputs
are generated by the Estimate Activity Resources process.
Activity Resource Requirements
The
activity resource requirements
list is the documented list of the resources you will require to complete every activity on your activity list. The activity resource requirements list goes on to be used as an input into the Plan Human Resource Management process and the Plan Procurement Management process.
Resource Breakdown Structure
The
resource breakdown structure
, like other breakdown structures, is used to decompose the categories of resources required and the specific resources required for the project. The resource breakdown structure then goes on to be used as an input into the Estimate Activity Durations process and the Develop Schedule process. Figure 4-9 shows an example of a resource breakdown structure.
Figure 4-9.
Resource breakdown structure
Exam Tip
The resource breakdown structure is one of four breakdown structures you should know for the exam. The other three are the organizational breakdown structure, the risk breakdown structure, and of course, perhaps the most important, the work breakdown structure (WBS
).
Project Document Updates
Types of project documents
that may be updated as a result of the Estimate Activity Resources process are the activity list, activity attributes, resource calendars, and project schedule management plan.
Quick Check
1.
What is the definition of a project resource?
2.
What is the benefit of using published estimating data?
3.
What is the advantage of using bottom-up estimating techniques?
4.
Why is it important to use resource calendars as an input into the Estimate Activity Resources process?
Quick Check Answers
1.
A project resource is any person, material, funding, or piece of equipment that is being used to complete activities, and subsequently work, on a project.
2.
The benefit of using published estimating data is that it is reliable and is generally prepared by using relevant commercially available data.
3.
Bottom-up estimating techniques are generally more accurate than top-down techniques because they aggregate estimates at a low level in the WBS and roll them up.
4.
Resource calendars provide information about resource availability; as such, they are an essential input into the Estimate Activity Resources process because they let you know when resources are available and when resources are not available to work on a project.
Estimate Activity Durations
More Info
Estimate Activity Durations You can read more about the Estimate Activity Durations process in the PMBOK Guide, 5th edition, in Chapter 6, section 6.5. Table 4-5 identifies the process inputs, tools and techniques, and outputs.
Table 4-5.
Estimate Activity Durations Process
Inputs ➪ | Tools and Techniques ➪ | Outputs |
|---|---|---|
• Schedule management plan • Activity list • Activity attributes • Activity resource requirements • Resource calendars • Project scope statement • Risk register • Resource breakdown structure • Enterprise environmental factors • Organizational process assets | • Expert judgment • Analogous estimating • Parametric estimating • Three-point estimating • Group decision-making techniques • Reserve analysis | • Activity duration estimates • Project document updates |
The Estimate Activity Durations process is focused on taking the previous data you have produced in defining the activities, sequencing the activities, and estimating the resources required for each activity, and then estimating the duration of each activity so that you can roll up these individual estimates into a total estimate for the project duration.
The Estimate Activity Durations process covers the following planning domain
task:
- Task 4: Develop the project schedule based on the approved project deliverables and milestones, scope, and resource management plans, in order to manage timely completion of the project.
Exam Tip
The Estimate Activity Resources process comes before the Estimate Activity Durations process because generally you need to know what resources are available in order to be able to estimate how long activity will take. The more resources you have, the faster an activity will be completed.
Inputs
The following inputs
can be used in the Estimate Activity Durations process to generate the outputs.
Schedule Management Plan
The schedule management plan is again a key input into this process because it outlines the way in which you will complete your estimate of activity durations. The schedule management plan is an output from the Plan Schedule Management process.
Activity List
The activity list
provides information about all the activities on a project and is an essential input, because you are now going to be estimating the duration of each of these activities. The activity list is an output from the Define Activities process.
Activity Attributes
Although the activity list provides you with a list of all the activities and some summary information about each of them, the activity attributes document provides more detailed information about each of the activities, including the resources allocated to them, any known constraints or assumptions, and any risks. Activity attributes are an output from the Define Activities process.
Activity Resource Requirements
The activity resource requirements
match each activity in your activity list with allocated resources that have been estimated to complete the activity. The activity resource requirements are an output from the Estimate Activity Resources process.
Resource Calendars
Resource calendars
provide you with information about constraints on resource availability. They specify when resources are available and when they are not available. If they are referring to people, they may outline holidays and known non-working times so that you can build these into your duration estimates. Resource calendars are also useful for indicating when resources are allocated to other projects and are thus not available to work on your project. Resource calendars are an output from the Acquire Project Team process.
Project Scope Statement
The use of the project scope statement
as an input into the Estimate Activity Durations process provides a great level of oversight to ensure that you have captured the entire project scope. Furthermore, the project scope statement contains additional information that you may need to be aware of when estimating activity durations, such as any pre-identified skilled resources and any known contract terms and requirements affecting duration estimates. The project scope statement is an output from the Define Scope process in the Scope Management knowledge area.
Risk Register
The project risk register
includes an analysis of the risks associated with resource use on the project, and, as such, contains important information about uncertainty in your activity duration estimates. The risk register is an output from the Identify Risks process in the Risk Management knowledge area.
Resource Breakdown Structure
The resource breakdown structure
provides you with a comprehensive decomposition of the types of resources you will require on the project, and with this information you can estimate durations better. The resource breakdown structure is an output from the Estimate Activity Resources process.
Enterprise Environmental Factors
The specific types of enterprise environmental factors
that may be used as inputs into this process are any estimating databases the organization has accumulated or that are available from external sources, and any known productivity metrics useful in determining the durations of particular activities when completed by specific resources.
Organizational Process Assets
The organizational process assets
that can be used to assist in the Estimate Activity Durations process are any historical information you have from previous projects, any lessons learned from previous projects specifically in relation to estimating, activity durations, and any organizational methodology and processes that can assist you in this process.
Tools and Techniques
The following tools and techniques
can be used on the selected inputs to generate the outputs.
Expert Judgment
The specific type of expert judgment
you will use as a tool in this process will be from anyone with specific knowledge about how long activities should take. This expert judgment can come from team members, others in the organization, or external people with specific experience.
Analogous Estimating
Analogous estimating
is an estimating technique in which you take a similar activity and extrapolate from that a current estimate based on the relationship between the other activity and this activity. For example, you may know that a similar activity took three days to complete, and the one you are currently estimating is twice as big; therefore, you would estimate a total duration of six days by using an analogous estimating technique.
Note
Accuracy of estimates Any estimating technique is simply an attempt to forecast what the future may hold. The better the information that goes into the estimating process is, the better the estimate will be. For example, let's say that you are trying to forecast the weather for tomorrow, for one week from now, for one month from now, and for one year from now. In order to estimate the weather for tomorrow, you have available to you a lot of data, including quantitative data on what today's weather pattern is doing and what historical information and computer simulations tell you this weather pattern will do tomorrow. As a result of this detailed information going into the estimating process, you can be reasonably sure that your estimate about tomorrow's weather will be fairly accurate. As you move out in time with your weather forecasts, the data available to you and the computer simulations and historical information will provide less valuable input, and thus your weather forecast for a year away will basically just be a guess based on the seasonal expectations.
Parametric Estimating
Parametric estimating
uses known quantities and known units of measurement and multiplies them together to arrive at an estimate. For example, you may know that each person can write 300 lines of code per day and that there are 3,000 lines of code to be written; therefore, your duration estimate using parametric estimating is 10 days.
Three-Point Estimating
Three-point estimating is part of the
Program Evaluation and Review Technique (PERT
), a technique that uses a weighted-average scenario to arrive at an estimate where there are most likely, optimistic, and pessimistic durations for an activity. If you were to take a simple average of three numbers, you would add the three numbers together and then divide by 3. The three-point estimating technique gives a higher weighting to the most likely estimate (tM) and assigns it a weight of 4, while assigning a weight of 1 to each of the optimistic (tO) and pessimistic (tP) duration estimates. With six numbers now instead of three, you divide by 6 to get the weighted average. Therefore, the formula for calculating a three-point estimate using this technique is
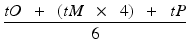
Exam Tip
The same formula is used to estimate project costs. In this section, the letter t is used to denote the variable being used to estimate time. When you are using this formula to estimate costs, the letter c is used instead. You may find it easier just to remember the formula without the t or c. Expert judgment, analogous estimating, parametric estimating, and three-point estimating are also used in the Estimate Costs process.
For example, if you have an optimistic estimate of 4 days, a most likely estimate of 7 days, and a pessimistic estimate of 12 days and put these estimates into the three-point estimating formula, your three-point estimate for this activity is 7.33 days:
In addition to calculating the expected duration, you can also calculate the standard deviation and variance. The standard deviation is a calculation of how far away from the average duration, or the expected duration using the three-point estimating formula, your data is spread. A smaller standard deviation means the data is tightly grouped, whereas a larger standard deviation means the data is more widely spread.
The standard deviation calculation
we use in the three-point estimating technique is essentially a heuristic, or rule-of-thumb, way of calculating standard deviation rather than the full formula used by statisticians. The formula subtracts the optimistic from the pessimistic and divides the result by 6:

So, using the previous example, the standard deviation is 8 divided by 6, which equals 1.33 days.
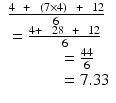
A benefit of calculating the standard deviation is that you can then estimate the confidence interval for a range of estimates. The confidence interval states the amount of the data that you expect to fall between the number of standard deviations above and below the mean. A standard deviation of one either side of the mean represents a confidence interval of 68%, a standard deviation of two either side of the mean gives a confidence interval of 95%, and a standard deviation of three either side of the mean gives a confidence interval of 99.7%.
Exam Tip
Six standard deviation either side of the mean contains 99.999% of the population. More commonly known as Six Sigma, it is used as a quality management tool in the Project Quality Management knowledge area.
Figure 4-10 shows a normal distribution and the range of a population you would expect to find with either one, two, or three standard deviations (SD
) either side of the mean.
Figure 4-10.
A curve showing standard deviations
For example, in the previous scenario, you could say that you have a 95% degree of certainty that the estimate for the activity duration is between 7± 2.66 days. This is calculated by realizing that 95% certainty reflects two standard deviations either side of the mean. The standard deviation, as already calculated, equals 1.33 days; therefore, two standard deviations equals 2.66 days.
Exam Tip
On the exam, you may be asked a question about a range of estimates of which you are either 68%, 95%, or 99.7% certain, which means the question is asking you to calculate one, two, or three standard deviations either side of the mean or average.
There is one more formula you need to be aware of: calculating the variance. The variance is calculated by multiplying the standard deviation by itself:

Using the previous example, the variance is the standard deviation squared, which equals 1.33 × 1.33, which equals 1.77.
Note
Origins of three-point estimating The origins of the three-point estimating technique are reportedly from the U.S. Navy Polaris submarine program in the 1950s. The technique was developed to help improve the delivery of large, complex projects. It is a subset of the Program Evaluation and Review Technique (PERT), which was one of the first analytical techniques to sequence activities and show the relationship between them.
Exam Tip
On the exam, you will probably have to do some calculations using formulas. You should always round your answer to two decimal places. However, you may arrive at an answer that is a fractionally different from one of those presented. If this is the case, it is probably a safe bet, if you have used the right equation, that the answer closest to yours is correct.
Group Decision-Making Techniques
There are many ways to gather information from groups of people, each with its own benefits and drawbacks. The most common group decision-making techniques used are brainstorming, nominal group techniques, and the Delphi technique.
Brainstorming is an excellent way of getting a group of people to think about many possible options. If you are facilitating a brainstorming session, you should encourage all ideas. The nominal group technique takes all the ideas and has the group vote on which ideas are worthy of further investigation.
The
Delphi technique
is a technique for soliciting information from experts on an anonymous basis. The reason is that often, bringing experts together into a room to provide expert opinion and advice results in the loudest being heard, or peer pressure influencing the opinions of those present. The Delphi technique aims to get around these potential problems and allow experts to contribute freely by asking each expert anonymously, via a structured questionnaire, for their opinion. After the first round of opinions has been gathered, the summarized results are often circulated again to all experts taking part in the process. They can then review the results and, if they want, change their original opinion.
REAL WORLD
The Delphi technique
is a very effective way of getting accurate information from experts; however, it is also time consuming and can cost a significant amount of money to do successfully. I have been part of a Delphi technique that was used to determine the level of risk on IT projects; I never knew how many other experts were being consulted, but the entire process took about three weeks to complete.
Note
Origins of the Delphi technique The Delphi technique is named after the oracle of Delphi, who was a priestess at the Temple of Apollo in ancient Greece. She went into a trance and provided advice about what the future might hold.
Reserve Analysis
A
reserve analysis
is the process of determining a justifiable reserve, or buffer, to be added to activities based on quantitative analysis carried out as part of developing the risk register. This process develops a contingency reserve, which is used for known unknowns, or identified uncertainty, in your project. It is a justifiable means of adding in extra time or cost. For example, if, during your quantitative risk assessment, you discovered that there was a 25% chance of a time delay of 10 days to a particular activity, you would add a contingency reserve of 2.5 days to your estimates. If the risk did not manifest, you would not need this contingency reserve.
The other sort of reserve that may be available to a project is a management reserve, which is a figure determined at the start of the project and that management and the project sponsor control for unknown unknowns, or unforeseen risks. A project can apply to use the management reserve. Use of the management reserve results in a change to the schedule baseline, because it is not factored into your duration estimates. Padding of estimates means making unjustifiable additions to cost or time estimates and is considered unethical.
REAL WORLD
It can be extremely difficult to convince the project sponsor and members of the project steering group to approve a contingency reserve for either time or cost, because they need to be persuaded that your methodology for determining it is sound and based on quantitative data. I have always argued for the provision of a contingency reserve on the basis of “no surprises,” and this has generally been successful. When the identified activity has been completed, if there was no need to use the contingency reserve, this is reported, and the overall contingency reserve is decreased.
Outputs
The Estimate Activity Durations process produces some or all of the following outputs.
Activity Duration Estimates
The main output from the Estimate Activity Durations process is the activity duration estimates, which define and record the individual assessments for the time required to complete each activity on the activity list. The individual activity duration estimates include an expected duration for each activity and, if calculated, the range of uncertainty in each activity, which can be aggregated to provide an expected duration with the total range of uncertainty for the entire project. For example, you could report that the total project duration is expected to be 89 days with a 10% probability that it will take 95 days based on the reserve analysis. The activity duration estimates go on to be used as an input into the Develop Schedule process.
Project Document Updates
The specific types of project documents that may be updated as a result of completing the Estimate Activity Durations process are the activity list, the activity attributes, and any other documents relating to expected durations of activities that the organization has.
Quick Check
1.
Using the three-point estimating technique, what is the expected duration of an activity with an optimistic duration of 8 days, a most likely estimate of 10 days, and a pessimistic estimate of 16 days?
2.
What is the main benefit of using the Delphi technique as and estimating tool?
3.
What is the main difference between analogous and parametric estimating techniques?
4.
What percentage of a data population would you expect to find within two standard deviations either side of a mean?
5.
What are the two types of justifiable reserve that may be used on a project?
Quick Check Answers
1.
If you apply the three-point estimating formula to this scenario, you will arrive at a three-point estimate of 10.66 days.
2.
The main benefit of using the Delphi technique is to allow experts to contribute their opinions anonymously and without peer pressure.
3.
Analogous estimating uses similar scenarios to extrapolate a current estimate, whereas parametric estimating uses a known quantity and multiplies it by a known metric.
4.
You would expect to find approximately 95% of a population within two standard deviations either side of a mean.
5.
Both the contingency reserve, for “known unknowns,” and the management reserve, for “unknown unknowns,” are developed by using quantitative data and historical information and, therefore, provide justifiable reserves.
Develop Schedule
More Info
Develop Schedule You can read more about the Develop Schedule process in the PMBOK Guide, 5th edition, in Chapter 6, section 6.6. Table 4-6 identifies the process inputs, tools and techniques, and outputs.
Table 4-6.
Develop Schedule Process
Inputs ➪ | Tools and Techniques ➪ | Outputs |
|---|---|---|
• Schedule management plan • Activity list • Activity attributes • Project schedule network diagrams • Activity resource requirements • Resource calendars • Activity duration estimates • Project scope statement • Risk register • Project staff assignments • Resource breakdown structure • Enterprise environmental factors • Organizational process assets | • Schedule network analysis • Critical path method • Critical chain method • Resource optimization techniques • Modeling techniques • Leads and lags • Schedule compression • Scheduling tool | • Schedule baseline • Project schedule • Schedule data • Project calendars • Project management plan updates • Project document updates |
The Develop Schedule process takes all the information you have gathered in the previous processes—Define Activities, Sequence Activities, Estimate Activity Resources, and Estimate Activity Durations—and combines them into the project network diagram, which graphically represents the project schedule.
The Develop Schedule process covers the following planning domain task:
- Task 4: Develop the project schedule based on the approved project deliverables and milestones, scope, and resource management plans, in order to manage timely completion of the project.
REAL WORLD
On most projects I’ve been involved in, the Develop Schedule process has been our primary focus. The preceding processes have all been completed at the same time, rather than as discrete, separate processes.
Inputs
The Develop Schedule process uses the following inputs.
Schedule Management Plan
The schedule management plan is an essential input into the Develop Schedule process because it outlines the way in which you will develop the project schedule. The schedule management plan is an output from the Plan Schedule Management process.
Activity List
The activity list provides you with a list of all the activities you have defined for the project that need to be completed. Each activity needs to be represented on the completed project schedule, and thus the activity list is a key input into this process. The activity list is an output from the Define Activities process.
Activity Attributes
The activity attributes give you more detailed information about the activities on the activity list, which only provides summary information about each activity. The activity attributes are an output from the Define Activities process.
Project Schedule Network Diagrams
The project schedule network diagrams present each of the activities and the relationship each has with predecessors and successors. The full development of the project schedule takes this preliminary information and adds additional detail to it, such as the estimate of activity resources and the individual estimate of activity durations, to produce the final project schedule. The project schedule network diagrams are an output from the Sequence Activities process.
Activity Resource Requirements
The activity resource requirements are used to allocate resources to each of the activities identified in the project. Activity resource requirements are an output from the Estimate Activity Resources process.
Resource Calendars
The resource calendars provide information about any known constraints on the use of resources on your project that may affect your scheduling. The resource calendars are an output from the Acquire Project Team process in the Human Resource Management knowledge area.
Activity Duration Estimates
The activity duration estimates are absolutely essential if you want to complete a project schedule. You use these individual estimates and aggregate them to determine your total project duration. Activity duration estimates are an output from the Estimate Activity Durations process.
Project Scope Statement
The project scope statement gives you information about the project and product scope of work to be completed, and it also provides information about known constraints and assumptions and any known contractual obligations that will affect your project schedule. The project scope statement is an output from the Develop Project Scope process in the Scope Management knowledge area.
Risk Register
The risk register contains information about known schedule risks and known resource risks of the project. As part of the analysis of these risks, there may be the development of contingencies relating to time that must be taken into account in developing a project schedule. The risk register is an output from the Identify Risks process in the Risk Management knowledge area.
Project Staff Assignments
The project staff assignments specify which organizational employees are to be allocated to each activity and provide an analysis of experience and skills that each particular person brings. The project staff assignments are an output from the Acquire Project Team process in the Human Resource Management knowledge area.
Resource Breakdown Structure
The resource breakdown structure is used as an input because it provides the details of the categories of individual skills that resources must be able to bring to the project to complete the assigned activities. The resource breakdown structure is an output from the Estimate Activity Resources process.
Enterprise Environmental Factors
The specific enterprise environmental factors that may be used as inputs, if appropriate, are any external standards, regulations, contractual obligations, or licensed scheduling tools that you will use to develop the project schedule.
Organizational Process Assets
The specific organizational process assets that may be useful in developing your project schedule include any existing project management methodology, blank templates, tools, and other techniques owned by the organization for the preparation of a project schedule.
Tools and Techniques
The following tools and techniques can be used on the inputs into the Develop Schedule process.
Schedule Network Analysis
Schedule network analysis
is a primary tool used to bring together all the previous information you have gathered when you defined the activities, sequenced the activities, estimated the activity resources, and estimated the activity durations. You use all of this information to put together your full schedule network diagram; when it is completed, you can use the critical path method, critical chain method, what-if analysis, or resource leveling to determine the total project duration and the amount of total float or slack between specific activities and in the overall project.
REAL WORLD
There are many ways of drawing the information contained in each node of an activity-on-node (AON) network diagram, and there are at least two ways of representing the numbering systems used to calculate durations between activities.
Critical Path Method
The
critical path method
focuses on identifying all the paths through a project and, with the aid of a network diagram, determining which of these paths presents the shortest duration and also the least amount of scheduling flexibility as indicated by the length of slack or float. The path with the shortest duration and the least slack or float through the project represents the path of most risk to the project—hence the name critical path. There can be many paths through a project, as Figure 4-11 shows.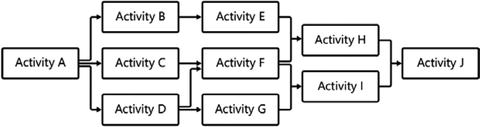
Figure 4-11.
Network paths
This network diagram contains the following paths:
- A-B-E-H-J
- A-C-F-H-J
- A-C-F-I-J
- A-D-F-H-J
- A-D-F-I-J
- A-D-G-I-J
However, you cannot determine which path or paths are the critical paths until you complete a full schedule network analysis.
Note
Slack and float There are not many instances in the PMBOK guide for which a single word has two meanings. The case of slack and float is one of the only times when two words are used to mean the same thing. There are two types of slack or float: free slack or free float, and total slack or total float. Free slack, or free float, indicates the amount of time an activity can be delayed before that affects the next activity on the path. Total slack, or total float, indicates the amount of time an activity can be delayed before it affects the total project duration. If an activity has zero total float, it means if it is delayed, it will automatically increase the duration of the project. The critical path or paths through a project are those on which there is no slack or float.
In order to complete a full schedule network diagram, you must understand how to complete an activity-on-node (AON) diagram. This section takes you through the process of completing a schedule network diagram, completing a forward pass to determine the project duration, and completing a backward pass to determine the critical path or paths.
To calculate the critical path on an AON diagram, this example uses the node to represent the information about the activity. The information contained in the node is the task ID, the duration of the activity, the early start (ES), the early finish (EF), the late start (LS), the late finish (LF), and the amount of total float in the activity. Figure 4-12 represents a typical node; however, be aware that in the real world and on the exam, many different forms of nodes may be used, with information displayed in different locations. They all display the same information, just in different ways.
Figure 4-12.
The activity node
Now, if you take the information contained in Table 4-7 and map it out over an entire network diagram, you can calculate the project duration and the critical path or paths.
Table 4-7.
Activity Information
Activity ID | Duration (Days) | Predecessor |
|---|---|---|
A | 3 | - |
B | 5 | A |
C | 4 | A |
D | 2 | B, C |
E | 6 | C |
F | 5 | D, E |
G | 4 | E |
H | 7 | F, G |
The first step in the process is to construct a network diagram showing the relationships between the activities. In this instance, assume that all activities have a finish-to-start relationship and there are no leads and lags. Figure 4-13 shows the network diagram: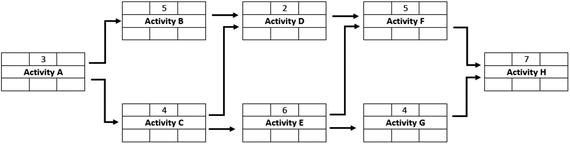
Figure 4-13.
Network diagram example
By examining this network diagram, you can now write out the paths through the diagram as follows:
- A-B-D-F-H
- A-C-D-F-H
- A-C-E-F-H
- A-C-E-G-H
The next step in the process is to complete a forward pass. The forward pass is completed by working from left to right and calculating the early start and the early finish for each task. The earliest a task can start is immediately after the latest early finish of all its predecessor activities. For example, if Activity A has an early finish of day 3 (which means it finishes at the end of day 3), then Activity B has an early start of day 4 (which means it starts at the beginning of day 4). If an activity has more than one predecessor, the earliest it can start is immediately after the latest early finish of all its predecessors. Figure 4-14 shows the network diagram with the forward pass completed. You can now determine that the project duration is 25 days.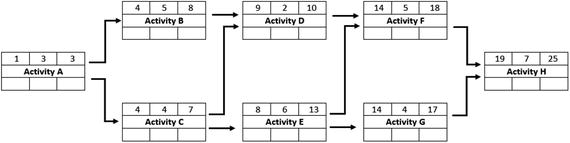
Figure 4-14.
Forward pass completed
The next step in the process is to complete a backward pass. This time, you work from right to left, and you calculate the late finish and the late start for each activity. When calculating the late finish for an activity, you must look to its successor activities; the late finish for an activity is immediately prior to the earliest of all successor late start dates. For example, if Activity D is the successor to Activity B, and activity D has a late start of day 12, then Activity B has a late finish of day 11. As you complete the backward pass, you can also calculate the total slack for each task by subtracting the late start from the late finish. Figure 4-15 shows a completed backward pass.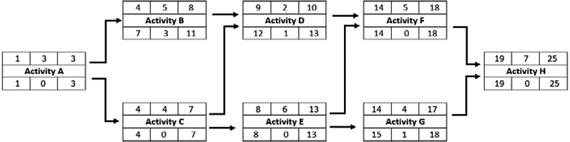
Figure 4-15.
Backward pass completed
To calculate which of the paths through the network diagram is the critical path, you simply look at all the activities that have zero total float, because these represent activities that, if delayed, will affect the total project duration. If you do this, you can determine that the critical path in this network diagram is A-C-E-F-H.
Critical Chain Method
The
critical chain method
is a means of purposely adding in buffer time to identified activities, usually on the critical path, to account for limited resources and project uncertainties. The amount of buffer is usually worked out by using historical information or quantitative risk analysis. The purpose of adding buffer is to ensure that activities on the critical path that are identified as important feeder activities—that is, those that produce work for successor activities—always have float to ensure that they don’t slip and cause the project duration to extend.
Exam Tip
If a question on the exam asks about the application of buffer time, it is referring to the critical chain method.
Resource Optimization Techniques
Often, the first pass through any estimate of activity resources—equipment, supplies, or people—is what could be referred to as the optimal use of resources. However, this may not be the most efficient use of resources, and there may be times when resources are either over-allocated or under-allocated. If resources are over-allocated, you may not be able to use them; and if they are under-allocated, you may be paying for resources to sit around unused. Through the processes of resource leveling and resource smoothing, you can attempt to make more efficient use of your resources, but this may have an impact on project cost and project duration.
Resource leveling involves moving the allocation of resources between time periods to level out periods when a resource will be overused or periods when a resource will be underused. For example, you may have forecast one person to be working 60 hours in a week, while someone else will work 15 hours. Obviously, after you start moving a resource around to get more efficient use, you may end up changing the duration of activities or even the sequence of activities. Resource smoothing is a less intensive form of resource leveling because it adjusts resources only within the total float for each activity so as not to extend the total project duration.
REAL WORLD
Typically, resource leveling is best left to sophisticated project management software. If you try to do it manually, you may end up spending too much of your time completing it and not obtaining the optimal results.
Modeling Techniques
Modeling techniques
typically use computers to present a model of a potential outcome. They are particularly useful when you are developing your project schedule, because you can examine all potential options and easily find problems or opportunities in the project schedule.
A particular type of modeling technique is the what-if scenario analysis. What-if scenario analysis is a form of statistical and mathematical analysis that looks at the potential probabilities and likely outcomes of different scenarios occurring. For example, you may be able to use this technique to analyze what would happen to your project schedule if certain events occurred and, from this analysis, choose the scenario that best suits your project-duration goals. Of all the what-if scenario analysis techniques, the most common is Monte Carlo analysis. Monte Carlo analysis applies statistical analysis to examining a possible distribution of outcomes and extrapolates from this the likelihood of specific outcomes. Due to its complex use of mathematical modeling, this type of analysis is most often performed by a computer.
Exam Tip
On the exam, if a question relates to mathematical analysis of different scenarios or the probability of different outcomes, the answer is most likely what-if scenario analysis or Monte Carlo analysis.
Note
Origin of Monte Carlo analysis Monte Carlo analysis was used to assist with modeling potential effects of the atomic bomb during the Manhattan Project. It was reportedly so named because the uncle of one of the lead scientists using the method liked to gamble at the casino in Monte Carlo.
Leads and Lags
In completing your entire project schedule with the use of a schedule network diagram, you may choose to use leads and lags as appropriate to represent either the amount of time an activity can start before its predecessor finishes or the amount of time an activity must wait after its predecessor ends before starting, respectively.
Schedule Compression
Often the first pass through the development of your project schedule results in an optimal timeframe. However, there may be existing schedule constraints, legislation requiring a set date for compliance, market conditions, or stakeholder expectations that mean your original estimate of total project duration is too long. In this case, you need to consider undertaking a variety of schedule compression techniques to shorten the duration of the project. The two most common and most often-used techniques are crashing and fast tracking. Crashing involves adding extra resources to an activity in order to complete it in a shorter time period, which often involves extra cost. Fast tracking allows activities that would normally be done in sequence to be done in parallel for all, or at least a portion, of their duration. Obviously, the type of dependency between the two activities would need to be a discretionary dependency, and you may need to take into account extra risk analysis in relation to starting an activity early.
Scheduling Tool
A
scheduling tool
can be a piece of project management software dedicated entirely to project scheduling, or it can be a module of a larger piece of project management software, such as Microsoft Project, Primavera, or ProjectLibre, to name just three of the hundreds available.
Outputs
The Develop Schedule process produces the following outputs.
Schedule Baseline
The schedule baseline is the final approved version of the project schedule used to track actual progress against planned progress.
Exam Tip
Four baselines in project management are used to monitor progress after project execution has begun: the scope baseline, the time or schedule baseline, the project budget, and the quality baseline. All project baselines form part of the overall project management plan, because they provide information about what is intended.
REAL WORLD
The most often-used form of schedule baseline is the Gantt chart. However, be aware that the Gantt chart is also an exceptional communications tool. On many projects I have worked on, I have used the Gantt chart for both reasons with great success. This is because it presents different levels of information graphically, which means it is easily understood by both technically minded and non-technically minded stakeholders.
Project Schedule
The
project schedule
can be represented in a number of ways. It is most commonly presented graphically by using either a Gantt chart, which is often called a horizontal bar chart, or a horizontal histogram. The project schedule can also be represented by a milestone chart or, less commonly, by the project schedule network diagram. Figure 4-16 shows an example of a Gantt chart.
Figure 4-16.
Gantt chart
Note
Origin of the Gantt chart Many people think that Gantt is an acronym for something. I once had a student who was absolutely convinced that it stood for graphical analysis and numerical tracking tool. I think the student was just making that up, because it is actually the surname of Henry Gantt, a mechanical engineer credited with using the chart to plot durations on a project.
Schedule Data
The
schedule data
refers to all the data that makes up the project schedule, and it refers to data relating to activity duration estimates, resources, reserves, constraints, and any resource leveling undertaken.
Project Calendars
The
project calendar
refers to the working time available for the project resources over the life of the project. If the project calendar is for people, then it may refer to the working week; if the project calendar is for machinery, it may refer to a 24-hour, seven-day-a-week schedule.
Project Management Plan Updates
The parts of the project management plan that may be updated as a result of developing a project schedule are the schedule management plan and the schedule baseline.
Project Document Updates
The types of project documents that may be updated as a result of completing the Develop Schedule process iteratively are any of the documents that feed into any part of the previous processes, such as activity resource requirements, activity attributes, project calendars, or the risk register.
Quick Check
1.
Why is identifying the critical path so important?
2.
After completing a forward pass, you will have calculated what?
3.
After completing a backward pass, you will have calculated what?
4.
What method uses time buffers to ensure that feeder activities don’t extend the project duration?
5.
What is the key purpose of leveling resources?
6.
What is the main difference between crashing and fast tracking?
Quick Check Answers
1.
Activities on the critical path have no total float; if they are delayed, they will extend the overall project duration. Therefore, they represent a high degree of risk on the project.
2.
After completing a forward pass, you will have calculated the project duration.
3.
After completing a backward pass, you will have identified the total float for each activity and can determine the critical path.
4.
The critical chain method uses time buffers inserted into the project schedule to ensure that high-risk activities do not cause the overall project duration to extend.
5.
The key purpose of resource leveling is to maximize the efficient use of resources.
6.
The main difference between crashing and fast tracking is that, generally, crashing costs more because it involves allocating more resources to a particular activity to shorten the duration.
Control Schedule
More Info
Control Schedule You can read more about the Control Schedule process in the PMBOK Guide, 5th edition, in Chapter 6, section 6.7. Table 4-8 identifies the process inputs, tools and techniques, and outputs.
Table 4-8.
Control Schedule Process
Inputs ➪ | Tools and Techniques ➪ | Outputs |
|---|---|---|
• Project management plan • Project schedule • Work performance data • Project calendars • Schedule data • Organizational process assets | • Performance reviews • Project management software • Resource optimization techniques • Modeling techniques • Leads and lags • Schedule compression • Scheduling tool | • Work performance information • Schedule forecasts • Change requests • Project management plan updates • Project document updates • Organizational process asset updates |
The Control Schedule process
is focused mainly on monitoring any variations between what was planned in terms of individual activity durations and the overall project duration, and what is actually occurring. It is also focused on documenting any requested changes to the project schedule as per the agreed change-control procedure.
The Control Schedule process covers the following monitoring and controlling domain task:
- Task 1: Measure project performance using appropriate tools and techniques, in order to identify and quantify any variances and corrective actions.
Inputs
The Control Schedule process uses the following inputs.
Project Management Plan
Obviously, in order to control any process, you need a plan or plans that guide you in determining your particular approach to monitoring and controlling. In this instance, the project management plan contains the plans and documents that are required to control the schedule. Foremost among these are the schedule management plan and the schedule baseline. In addition, your change management plan and other subsidiary plans will be useful in guiding you in this process. The project management plan is an output from the Develop Project Management Plan process.
Project Schedule
The project schedule is an absolutely essential input into the Control Schedule process, because you use this to check for any variance. The project schedule outlines what you had planned to achieve in terms of time progress on the project. Through your efforts of checking this against what is actually happening, you can spot any variances and, as a result, raise any requested changes or corrective or preventive actions. The project schedule is an output from the Develop Schedule process.
Work Performance Data
Work performance data is the information you gather about progress on the activities that have started, what the actual duration is, and the status of any activities considered finished. You use this work performance data as a key input into the Control Schedule process. Work performance data is an output from the Direct and Manage Project Work process.
Project Calendars
Project calendars, which outline the times that the project will carry out the planned activity, are useful particularly when there is more than one project calendar assigned to different resources being used on the project. Project calendars are an output from the Develop Schedule process.
Schedule Data
Schedule data is the raw data used to develop the project schedule model and includes the known milestones, activities, activity attributes and, if known, any identified constraints and assumptions. You use the schedule data to measure variance of planned versus actual. The schedule data is an output from the Develop Schedule process.
Organizational Process Assets
The types of organizational process assets that will be useful as inputs into the Control Schedule process are any existing policies or procedures that the organization has that assist with measuring and reporting on project schedule progress, any manual or automated schedule control tools, and any established reporting templates that can be used.
Tools and Techniques
The following tools and techniques can be used on the inputs into the Control Schedule process.
Performance Reviews
Performance reviews
are the key tool used to control the schedule, because the focus is on analyzing what you had planned to do in terms of project schedule performance and what you are actually doing. Several techniques can be used as part of applying performance reviews. One of these techniques, trend analysis, gathers data about your project performance to date and then, by using graphs that extrapolate from this information, what likely future performance will be. Another important tool or technique used for performance reviews is the critical chain method, which you also saw used as a tool in the Develop Schedule process. In the Control Schedule process, it is used to continually assess the allocated time buffers against what is actually occurring and to make adjustments as necessary.
Project Management Software
Given the in-depth nature of variance analysis and its focus on actual versus planned durations and completion of activities, completing the work manually would be tedious and inefficient. This is where the use of project management software is very helpful.
REAL WORLD
One of the key tasks I’ve always given to project administrators working on my projects is to take responsibility for using the project management software to keep track of both time and cost performance on the project. During one particularly complex project, I had our wonderful project administrator out on site nearly every day, checking what was actually being accomplished and recording this in the project management software against what we had planned to do. We were then able to use the project management software forecasting abilities to get early indicators of where we might end up if we continued at the same pace. This is one of the key benefits of using forecasting. A simple forecast of where you might end up is not a predetermination of the actual outcome; instead, it should be viewed as a warning of what may happen if you continue doing what you have been doing. If the results show that you will end up either over budget or over time, you have plenty of warning to implement strategies to make sure this doesn’t happen.
Resource Optimization Techniques
After the project is underway and resources are being used to complete activities, you may want to use resource optimization techniques and either resource leveling or resource smoothing to obtain a more efficient allocation of the resources.
Modeling Techniques
Modeling techniques
are used to forecast different schedule scenarios based on the different possibilities that could happen with the schedule. The most common one is what-if scenario analysis.
The what-if scenario analysis and Monte Carlo analysis are useful mathematical tools for forecasting future outcomes based on performance to date. A what-if scenario analysis uses known probabilities of work done to date and estimated probabilities of potential work paths to be done to calculate the likelihood of all possible scenarios. After this has been completed, you can determine the most likely scenarios and judge their impact, as well as determine the least likely scenarios and their impact. Monte Carlo analysis extrapolates from existing work performance data what likely future outcomes will be.
Leads and Lags
In the Develop Schedule process, you also saw this tool used. The purpose of this is to be able to adjust leads and lags between activities to more efficiently achieve the expected activity duration and total project duration.
Schedule Compression
In the process of examining planned versus actual time performance on the project, you may detect that some activities are taking longer than planned, and therefore that they threaten the total project duration. At this point, you may want to consider the application of schedule-compression techniques to shorten the duration of particular activities, a sequence of activities, or the total project. The two most commonly used schedule-compression techniques are crashing, which involves the use of more resources and usually costs more, and fast tracking, which involves the scheduling of activities in parallel that were previously scheduled in sequence.
Exam Tip
On the exam, if any schedule-compression technique being used involves more cost, you can be certain that it is referring to crashing. Conversely, if the question poses a scenario where you are asked to compress a project schedule but do not have access to any more budget, you will not be able to select crashing as an option.
Scheduling Tool
A scheduling tool is a specific piece of software dedicated to project scheduling only. It is often part of a more robust piece of project management software such as ProjectLibre, Primavera, or Microsoft Project.
Exam Tip
Did you notice that the last five tools listed in the Control Schedule process are the same as the last five tools listed in the Develop Schedule process, with the exception that the Develop Schedule process uses applying leads and lags as a tool, whereas the Control Schedule process uses adjusting leads and lags as a tool?
Outputs
The Control Schedule process produces the following outputs.
Work Performance Information
As a result of investigating how your project is doing in terms of individual activity durations and overall project duration, you will develop work performance information. If you recall, work performance data was used as an input into this process, and with the application of the selected tools and techniques, that data has been refined into work performance information. The work performance information can be presented as schedule variance (SV) and schedule performance index (SPI) values for individual activities and work packages. The work performance information itself goes on to be used as an input into the Monitor and Control Project Work process.
Exam Tip
Work performance data is used to create work performance information, which in turn is used to produce work performance reports.
Note
Earned value management In Chapter 5, which focuses on cost management, you look in depth at the earned value management system and the associated formula for measuring current progress and forecasting likely future progress on a project. Two of the indicators you learn about are the schedule variance (SV) and schedule performance index (SPI) formulas. Both of these formulas and earned value management analysis focus on assessing current performance in relation to time and are useful for detecting variance from what was planned.
Schedule Forecasts
Schedule forecasts
are what you obtain by examining current performance and using this to extrapolate likely future performance. Chapter 5 looks in depth at the earned value management system. In this system, the formulas for calculating estimate at completion (EAC) and estimate to complete (ETC) are useful in forecasting the schedule. Schedule forecasts go on to be used as inputs into the Monitor and Control Project Work process.
Note
Estimate at completion As you will read in the next chapter, with its focus on the earned value management system, the estimate at completion (EAC) activity is one formula that can be calculated many ways. There are different formulas that take into account different parameters; if you want to use EAC and take into account the time performance to date, you select one of the formulas that uses the schedule performance index (SPI).
REAL WORLD
Usually, immediately after you inform key stakeholders about how well the project is going to date, the next question they ask is how well it will go in the future. To answer this question, you need to forecast future performance of the project. In relation to the time or cost performance, the best way to forecast future performance is simply to analyze past performance. I have always used earned value management on projects I work on in order to give people an indication—because that is all it is—of the likely future outcomes based on past performance.
Change Requests
If, during the process of examining actual versus planned performance in relation to project time, you discover any variances, one of your options is to submit a change request as per your documented and approved change-control process. Change requests go on to be used as inputs into the Perform Integrated Change Control process in the Integration Management knowledge area.
Project Management Plan Updates
If, as a result of monitoring and controlling the project schedule, you do discover any variances, you may choose to update specific elements of the project management plan. Of these, the most common updates will be to the schedule management plan and the schedule baseline. Given the integrated nature of project management, though, any changes to the project schedule may also result in changes to the project cost baseline, project risks, project quality, and elements of the project scope. Project management plan updates are used in turn as inputs into the Develop Project Plan process.
Project Document Updates
In addition to elements of the project management plan and its subsidiary plans, specific project documents may be updated as a result of information gathered during the Control Schedule process. You may want to update the project schedule data and, as a result, the project schedule.
Organizational Process Asset Updates
Specific organizational process assets that may be updated as a result of the Control Schedule process are historical information, lessons learned, records of corrective actions, and updates to any organizational templates and policies in order to ensure that they are still relevant.
Quick Check
1.
What is the key focus of variance analysis tools and techniques used in the Control Schedule process?
2.
What is the relationship between work performance data and work performance information?
3.
What is the key earned value management formula used for schedule forecasts?
Quick Check Answers
1.
The focus of variance analysis tools and techniques used in the Control Schedule process is to look at what you had planned to achieve against what you are actually achieving and determine if there is a variance between the two.
2.
Work performance data is the raw data gathered that is filtered to become useful work performance information.
3.
The key earned value management formula used for schedule forecasts is the estimate at completion (EAC) formula when it incorporates the schedule performance index (SPI) into its calculation.
Chapter Summary
- The Time Management knowledge area is focused on the development and checking of the project schedule.
- As with all the other knowledge areas, the Time Management knowledge area begins with an initial planning process, which in this instance produces the schedule management plan. The schedule management plan sets out how you will go about completing the planning, execution, and control of the project schedule.
- There is then a five-step iterative process that culminates in the development of a project schedule.
- The first of these five steps is to define the activities, which are a further level of decomposition of already-identified work packages from the Scope Management knowledge area.
- After the activities have been identified and documented in the Define Activities process, they can then be put in sequence with the relationships between the activities clearly identified and defined. This Sequence Activities process constitutes the beginning of the development of the schedule network diagram.
- The Estimate Activity Resources process then seeks to provide an estimate of the type and quantities of material, people, equipment, or supplies that will be required to complete each of the activities.
- After an estimate of the type and quantities of resources for each activity has been prepared, an estimate of the duration of each activity can then be completed. This is the main focus of the Estimate Activity Durations process.
- The Develop Schedule process takes the information from the previous four planning processes and combines it into the project schedule. Because it is a highly iterative process and subject to rolling-wave planning, it may focus more on the immediate future and leave further detail to be defined as the project progresses.
- After the planning activities have been completed and project execution is underway, the Control Schedule process seeks to monitor the schedule status of the project and what was planned against what is actually occurring by using the schedule baseline. Any variances from what was planned can be dealt with in a change request, corrective action, or preventive action recommendation.
Exercises
The answers for these exercises are located in the “Answers” section at the end of this chapter.
1.
Based on the information in the following table, complete a network diagram showing the project duration, and calculate the critical path or paths.
Activity ID | Duration (Days) | Predecessor |
|---|---|---|
A | 4 | - |
B | 3 | A |
C | 6 | A, B |
D | 5 | B |
E | 3 | C, D |
F | 7 | D |
G | 2 | D, E |
H | 9 | F, G |
2.
Using three-point estimating, what is the expected mean, standard deviation, and variance for each of the following scenarios?
Optimistic | Most Likely | Pessimistic |
|---|---|---|
6 | 8 | 12 |
3 | 10 | 15 |
12 | 14 | 18 |
27 | 35 | 48 |
3.
You have been asked by your project sponsor to provide a date range for which you are 99.7% certain the project will be delivered, with an optimistic duration of 35 days, a most likely duration of 45 days, and a pessimistic duration of 60 days. What is your answer to your project sponsor?
4.
Match the estimating technique on the left with the appropriate description on the right.
1. Analogous estimating | a. An estimating technique that multiplies a known quantity by a known metric |
2. Parametric estimating | b. An estimating technique that takes the weighted average of the optimistic, most likely, and pessimistic estimates |
3. Bottom-up estimating | c. An estimating technique that gathers information from experts anonymously |
4. Delphi technique | d. An estimating technique using information from a similar activity |
5. Three-point estimating | e. An estimating technique that takes low-level detailed estimates and aggregates them |
Review Questions
Test your knowledge of the information in Chapter 4 by answering these questions. The answers to these questions, and the explanation of why each answer choice is correct or incorrect, are located in the “Answers” section at the end of this chapter.
1.
What is the correct order of processes in the Time Management knowledge area?
A.
Define Activities, Sequence Activities, Estimate Activity Resources, Estimate Activity Durations, Develop Schedule
B.
Define Activities, Sequence Activities, Estimate Activity Durations, Estimate Activity Resources, Develop Schedule
C.
Sequence Activities, Define Activities, Estimate Activity Resources, Estimate Activity Durations, Develop Schedule
D.
Sequence Activities, Define Activities, Estimate Activity Durations, Estimate Activity Resources, Develop Schedule
2.
What is the document that provides additional information about activities identified on the activity list?
A.
Project charter
B.
Activity attributes
C.
Resource breakdown structure
D.
Scope statement
3.
What is the best definition of rolling-wave planning?
A.
It is the breakdown of work packages into activities.
B.
It is a form of progressive elaboration that focuses on defining work in the immediate future in more detail than work further off.
C.
It is the process of first defining, then sequencing, then estimating durations in the preparation of the project schedule.
D.
It is the process of comparing actual progress against planned progress.
4.
What is the name of the document that guides the definition, documentation, execution, and control of the project schedule?
A.
Project management plan
B.
Scope statement
C.
Organizational process assets
D.
Schedule management plan
5.
Why are activity resources generally estimated before activity durations?
A.
Because that is the way the PMBOK Guide sets them out.
B.
Because in order to estimate activity durations, you must know what sequence they occur in.
C.
Because you need to know how many resources are available to complete an activity. This will affect how fast the activity can be completed.
D.
They don’t—it’s better to estimate activity durations first, then estimate activity resources.
6.
What is the form of estimating that uses known quantities and multiplies them by known metrics?
A.
Analogous estimating
B.
Parametric estimating
C.
Three-point estimating
D.
The Delphi technique
7.
You are obtaining information from a group of experts about your project durations, and each expert is being asked individually for their opinion without knowing who else is being interviewed. What sort of estimating technique are you using?
A.
Alternatives analysis
B.
Parametric estimating
C.
Three-point estimating
D.
The Delphi technique
8.
Which of the following estimating techniques is part of the PERT technique?
A.
Analogous estimating
B.
Parametric estimating
C.
Three-point estimating
D.
Bottom–up estimating
9.
If a successor activity cannot start until its predecessor activity has started, what sort of relationship is this?
A.
Finish-to-start
B.
Start-to-start
C.
Finish-to-finish
D.
Start-to-finish
10.
What is the name of the process of considering whether an additional amount of time should be provided based on quantitative risk analysis?
A.
Expert judgment
B.
Parametric estimating
C.
Reserves analysis
D.
Monte Carlo analysis
11.
The path, or paths, through a project schedule network that represent the most risk because there is no total float is called what?
A.
Critical chain
B.
Network diagram
C.
Gantt chart
D.
Critical path
12.
If you are compressing the project schedule by using a technique that generally does not increase project costs, which of the following techniques are you using?
A.
Fast tracking
B.
Crashing
C.
Resource optimization
D.
Resource leveling
13.
The amount of time a successor activity must wait after the completion of its predecessor activity is known as what?
A.
Lead
B.
Resource leveling
C.
Lag
D.
Float
Answers
This section contains the answers for the Exercises and Review Questions in this chapter.
Exercises
1.
Based on the information in the following table, complete a network diagram showing the project duration, and calculate the critical path or paths.
Activity ID | Duration (Days) | Predecessor |
|---|---|---|
A | 4 | - |
B | 3 | A |
C | 6 | A, B |
D | 5 | B |
E | 3 | C, D |
F | 7 | D |
G | 2 | D, E |
H | 9 | F, G |
The project duration is 28 days.
The critical path is A-B-D-F-H.
The completed network diagram is shown in Figure 4-17.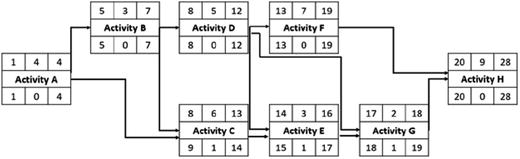
Figure 4-17.
A completed activity-on-node (AON
) diagram
2.
Using three-point estimating, what is the expected mean, standard deviation, and variance of each of the following scenarios?
Optimistic | Most Likely | Pessimistic | Meann | Standard Deviation | Variance |
|---|---|---|---|---|---|
6 | 8 | 12 | 8.33 days | 1 | 1 |
3 | 10 | 15 | 9.67 days | 2 | 4 |
12 | 14 | 18 | 14.33 days | 1 | 1 |
27 | 35 | 48 | 35.83 days | 3.5 | 12.25 |
3.
You have been asked by your project sponsor to provide a date range for which you are 99.7% certain the project will be delivered, with an optimistic duration of 35 days, a pessimistic duration of 60 days, and a calculated mean of 45 days. What is your answer to your project sponsor?
To calculate the answer, first determine the standard deviation:

The question is asking for 99.7% certainty, which is three standard deviations either side of the mean, so multiply the standard deviation by 3:

Therefore, the answer is 45 ± 12.51 or 32.49 – 57.21 days.
Match the estimating technique on the left with the appropriate description on the right.
1. Analogous estimating | d. An estimating technique using information from a similar activity |
2. Parametric estimating | a. An estimating technique that multiplies a known quantity by a known metric |
3. Bottom-up estimating | e. An estimating technique that takes low-level detailed estimates and aggregates them |
4. Delphi technique | c. An estimating technique that gathers information from experts anonymously |
5. Three-point estimating | b. An estimating technique that takes the weighted average of the optimistic, most likely, and pessimistic estimates |
Review Questions
1.
Correct Answer: A
A.
Correct: First define activities, then sequence them, then estimate resources prior to estimating durations, then develop the schedule.
B.
Incorrect: Estimate Activity Durations generally occurs after Estimate Activity Resources.
C.
Incorrect: Sequence Activities occurs after Define Activities.
D.
Incorrect: Sequence Activities occurs after Define Activities.
2.
Correct Answer: B
A.
Incorrect: The project charter contains high-level information.
B.
Correct: The activity attributes document provides additional detail about identified activities.
C.
Incorrect: The resource breakdown structure provides a breakdown of categories and types of resources required on the project.
D.
Incorrect: The scope statement describes all the work to be done on the project.
3.
Correct Answer: B
A.
Incorrect: The breakdown of work packages into activities is the process of decomposition.
B.
Correct: It is a form of progressive elaboration that focuses on defining work in the immediate future in more detail than work further off.
C.
Incorrect: The process of first defining, then sequencing, then estimating durations in the preparation of the project schedule broadly outlines the Time Management processes.
D.
Incorrect: The process of comparing actual progress against planned progress is variance analysis.
4.
Correct Answer: D
A.
Incorrect: The project management plan is the overall plan containing many subsidiary plans and documents.
B.
Incorrect: The scope statement defines the work to be done on the project.
C.
Incorrect: The organizational process assets are process polices, templates, and methodologies the wider organization owns that can assist project management.
D.
Correct: The schedule management plan defines how the project schedule will be developed, executed, and controlled.
5.
Correct: C
A.
Incorrect: The PMBOK Guide is not prescriptive.
B.
Incorrect: This answer links two processes that are separated by the Estimate Activity Resources process.
C.
Correct: You need to know how many resources are available to complete an activity because this will affect how fast the activity can be completed.
D.
Incorrect: Generally, it’s better to estimate activity resources first, then estimate activity durations.
6.
Correct: B
A.
Incorrect: Analogous estimating uses a similar activity to estimate the resources or duration of a current activity.
B.
Correct: Parametric estimating uses known quantities and multiplies them by known metrics.
C.
Incorrect: Three-point estimating uses a weighted average of an optimistic, most likely, and pessimistic estimate.
D.
Incorrect: The Delphi technique solicits information from experts anonymously.
7.
Correct: D
A.
Incorrect: Alternatives analysis considers a range of alternative approaches in order to determine the most appropriate one.
B.
Incorrect: Parametric estimating uses known quantities and multiplies them by known metrics.
C.
Incorrect: Three-point estimating uses a weighted average of an optimistic, most likely, and pessimistic estimate.
D.
Correct: The Delphi technique solicits information from experts anonymously.
8.
Correct: C
A.
Incorrect: Analogous estimating uses a similar activity to estimate the resources or duration of a current activity.
B.
Incorrect: Parametric estimating uses known quantities and multiplies them by known metrics.
C.
Correct: Three-point estimating uses a weighted average of an optimistic, most likely, and pessimistic estimate and is part of the Program Evaluation and Review Technique (PERT).
D.
Incorrect: Bottom-up estimating aggregates low-level estimates and rolls them up to obtain higher-level estimates.
9.
Correct: B
A.
Incorrect: A finish-to-start relationship means the successor cannot start until the predecessor finishes.
B.
Correct: A start-to-start relationship means a successor activity cannot start until its predecessor activity has started.
C.
Incorrect: A finish-to-finish relationship means the successor cannot finish until the predecessor finishes.
D.
Incorrect: A start-to-finish relationship means the successor cannot finish until the predecessor starts.
10.
Correct: C
A.
Incorrect: Expert judgment is a technique for getting information from acknowledged experts.
B.
Incorrect: Parametric estimating uses known quantities and multiplies them by known metrics.
C.
Correct: Reserves analysis considers whether an additional amount of time should be provided based on quantitative risk analysis.
D.
Incorrect: Monte Carlo analysis uses sophisticated mathematical modeling to forecast future states from observed data.
11.
Correct: D
A.
Incorrect: The critical chain method places time buffers around high-risk activities to mitigate any potential adverse impact on the project duration.
B.
Incorrect: The network diagram is a graphical representation of the project activities and the relationship between them.
C.
Incorrect: The Gantt chart is a graphical representation of the project schedule.
D.
Correct: The critical path is the path, or paths, through a project schedule network that represent the most risk because there is no total float.
12.
Correct: A
A.
Correct: Fast tracking schedules activities in parallel that would normally be done in sequence.
B.
Incorrect: Crashing adds more resources to an activity to shorten its duration, but it usually costs money.
C.
Incorrect: Resource optimization is a technique of making the most efficient use of resources on a project.
D.
Incorrect: Resource leveling is a type of resource optimization.
13.
Correct: C
A.
Incorrect: The lead is the amount of time a successor can start before completion of the predecessor activity.
B.
Incorrect: Resource leveling is a type of resource optimization.
C.
Correct: The lag is the amount of time a successor activity must wait after the completion of its predecessor activity.
D.
Incorrect: The float is the amount of time an activity can be delayed before it has an impact on successor activities or the total project duration.