
Investigative Case Management
Information in this chapter
Introduction
This chapter introduces several methods which may allow you to see inferences as you manage the information in your case. These inferences help connect the dots between evidence and suspects. Instead of simply taking notes during your investigation, create a system that can lead to discoveries otherwise missed. Gone are the days of writing reports and placing reports in binders such as seen in Figure 6.1. A case with any amount electronic evidence from a single storage device will quickly overwhelm a system of binders.
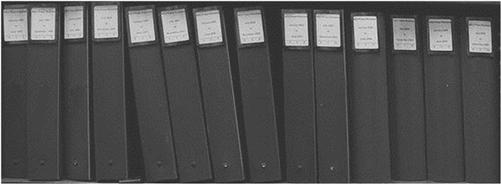
Figure 6.1 Finding a single document in a shelf of binders can take more time than necessary compared to searching an electronic folder.
Investigative case management enables you to find information quickly and help you understand your investigation as a whole. Comprehending your reconstruction of the incident in your investigation will allow you to see the totality of the reconstructed incident as if you were there when it occurred. You will have more “Eureka!” moments when data can be seen as a whole and inferences between suspects and acts stand out clearly among all information.
There may be a few investigators and analysts who can keep a neat desk during complex cases where the rest of us struggle to keep ahead of growing mounds of paper. Hundreds of pages are printed to be sorted throughout the case, duplicates of forms, photos, mail, court orders, and evidence requests are constantly generated to be filed in some manner, and this can quickly engulf anyone. With multiple cases and exams of multiple storage devices in each case generating even more case records, a common scene of the work area can appear to look like the results of a small office hurricane. Work areas that are cluttered and disorganized will also coincidently consist of cases that are not solved quickly, or even solved at all. This chapter intends to give methods of controlling information and analyzing it at the same time.
Basic case tracking
If there is one rule to remember, it is to handle evidence and information as it is collected. As long as each item is bagged and tagged in your system, the odds of losing or overlooking information are minimized. Bagging and tagging can easily be accomplished using logs where evidence or information that arrives is logged on paper, as it arrives, and filed away.
All other methods of dealing with evidence make your case management that much easier. If you have a good system already, perhaps it can be made better with one of the methods described. And if one suggestion saves you minutes or hours over a period of time, then that would have been one worthwhile changetohavemade.
Although electronic data can be reproduced and fingerprint cards photocopied and scanned, the reproductions of the actual physical items cannot be cloned. The storage of these types of items requires safe storage within a secured facility. Physical evidence storage is vitally important, but this will not be the focus of this chapter. The focus is to manage your investigation information so that suspects can be clearly identified and evidence supporting suppositions are evident.
The case name
Before you can analyze your own information, you need to be able to find it. As seemingly unimportant it sounds, naming your cases deserves some attention. Depending upon your agency or organization, there may be an automated system for case names and you have no choice other than what the system gives you. There is nothing wrong with that as an internal system is already in place.
But what if you are responsible for creating the name for all your cases? In that instance, especially if there is more than one person that works cases in your organization, having any system is better than having more than one system or no system at all. Figure 6.2 shows a simple case numbering system that is based on the date the case was created with an additional sequential number if more than one case is drawn on that particular day.
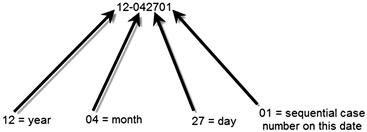
Figure 6.2 Case numbering system based on the case creation date.
It might seem easier to name a case with its legal name, such as Doe v Smith, or maybe even use the name of the client, suspect, or victim. Realistically, this is not the best method as clients may change during a civil case, identified suspects may be cleared, or additional victims identified. Even a court case number can change if the court venue is changed, perhaps from a state case to a federal case. There are too many variables that can change with any such designated name. A date-based format is unaffected by any variables as it is based on the date created and not the content of an investigation.
The electronic file names within an investigation may be organized by using your case name. Simply, each file’s name can be preceded by its respective case number for ease of searching and cataloging. An example is seen in Figure 6.3, where case folders contain files named by the case and type of file. Cases where more than one person creates documents require a central repository for all documents, which could be stored on a shared network drive or internal database. Electronic records propagate quickly and can just as quickly be lost or overlooked.
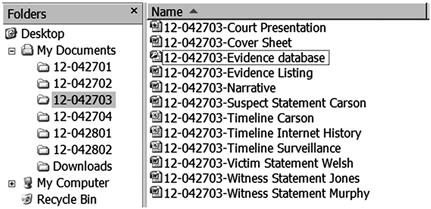
Figure 6.3 Simplicity in electronic document management will help you keep track of case information.
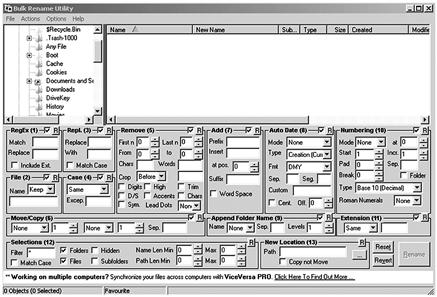
If you currently have cases where your electronic case files have no order in naming conventions, what can you do? Spend hours renaming dozens or more individual files to some order? To save time and get your files in order, you could use a file renaming software utility, such as the Bulk Rename Utility seen in Figure 6.4. In one fell swoop, an entire folder can have the pre-fix of your case inserted into each file name.
Note taking
Sometimes, during the investigative or analysis steps of an investigation, facts jump out and directly point to a suspect. Other times, it can take much longer to review and follow up on information just to be able to develop a list of potential suspects. Unless an investigation clearly points to a single suspect, the effort to develop leads begins with taking notes and reviewing those notes as the case develops.
Taking notes should be seen more than documenting your investigative steps. Note taking is one of your investigative steps. Whether your notes are scribbled in a notepad or entered into a database, when reviewed at later dates, you most likely will be able to put one piece of information together with another that you didn’t see before, forming an inference and potentially leading to case resolution. It’s getting a “Eureka!” moment when you least expect it by analyzing your own notes and reports.
One method of keeping all investigative notes and related information in one place can be accomplished through multifaceted programs, such as the OneNote from Microsoft (http://office.microsoft.com/en-us/onenote/) and EverNote (https://evernote.com/). There are similarities between both programs, such as being able to save all your notes in one location with search capabilities. Your notes can include pictures, audio and video recordings, faxes, emails, and almost any electronic file format you may be using as you conduct your analysis and investigation.
A benefit of programs like OneNote (Figure 6.5) and EverNote (Figure 6.6) is that the information can be sent and accessed in the field through mobile devices. Investigators can take a photo of evidence with a mobile device in the field and send it directly into the case file. Web screenshots can also be saved directly into the program. As an information management option, these types of programs may be useful to your investigation to organize case data.
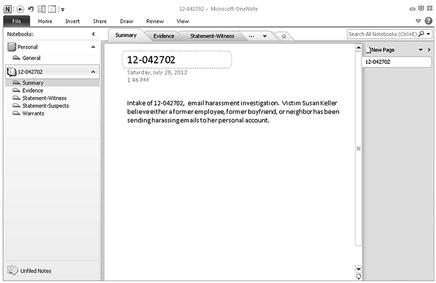
Figure 6.5 OneNote interface with a sample case.
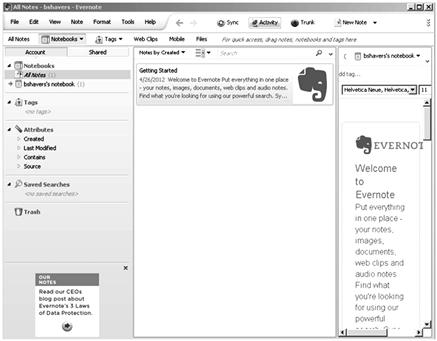
Figure 6.6 EverNote interface.
Analyzing your notes
Gone are the days of typewriters. Reports are now typed using any one of many word processing software applications or typed directly into an internal system. Report narratives, summaries, and briefs are created and stored electronically. The ability to search these electronic files for information that may have been entered months or years earlier eliminates the need for physically searching for paper documents. Spending hours sifting through a dozen boxes of case files looking for one document can be done electronically in seconds.
But is typing your notes using a word processing application good enough? For a final report, most any word processing application will work, however, reviewing a word processed report may not be the easiest to analyze. As notes are written and typed chronologically, reviewing all instances of a specific event is a difficult process with a chronological report. As an example would be finding all instances that a USB device was connected in multiple systems. A typed, chronological report requires reading through every page to find every instance this information was typed. Sometimes, being able to review notes out of chronological order helps find the information needed to understand a case. Perhaps an application that is not a simple word processing program would be better.
One example of such an application is KeepNote (http://www.keepnote.org), a cross platform, note taking utility. As seen in Figure 6.7, data is stored in a hierarchy format and customizable to a specific case or need. The information is able to be searched electronically, files of various formats can be attached, and reports generated in html or xml format. KeepNote can also be run from a portable storage device. Although KeepNote has a simple interface, it provides the analysis of investigator notes with supporting evidence without completely relying upon chronological information.
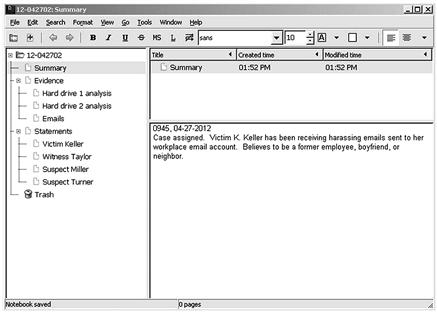
Figure 6.7 KeepNote, http://www.keepnote.org.
There are other similar applications, available freely through open source or freeware applications. Some of these are primarily report writing utilities or light case management utilities, which leaves scalability as a drawback. A program like KeepNote is NoteKeeper (http://www.tolon.co.uk/software/notekeeper/). NoteKeeper is also freeware and useful for organizing investigative notes. Another note taking utility with capabilities of encryption and tamperproof notes is CaseNotes (http://qccis.com/resources/forensic-tools/casenotes-lite/). CaseNotes, like NoteKeeper and KeepNotes, is freely available.
The point to be made in analyzing your notes is that although the information in the notes consists of investigative steps taken, including analysis of electronic evidence, being able to analyze your actual notes can be productive. Sometimes, a short sentence created weeks earlier can take on a whole new meaning when reviewed with other notes created later.
Analysis with spreadsheets
The spreadsheet is perhaps one of the most commonly used, versatile, and powerful software applications used in digital forensics investigations. The spreadsheet could be used for entering text as if it were a word processing application, but it shines when used to analyze massive amounts of information such as displaying events in a chronological timeline. Timeline analysis allows viewing and interpreting of data through sorting of the data by various criteria, such as chronological dates or specific event types.
Timelines can be used to display Internet history, event logs, registry files, or a combination of system and file data. Important events in a timeline can be given focus through the use of color and bold text to draw attention during review of the data. As spreadsheets can be sorted by columns, any header of interest can be chosen to view in ascending or descending order, or other selection of criteria available. The header columns are the titles for the metadata for each data item. The metadata consists of timestamps, filenames, file paths, or any user selected metadata descriptor that may be available.
Manipulating a spreadsheet in this manner allows finding specific information quickly, even if there are hundreds of thousands of data rows. This manipulation of how data is viewed also helps to change your perspective on the data to perhaps see information leading to investigative leads or conclusions.
Creating a timeline usually involves importing a raw or filtered amount of information in .csv format into a spreadsheet that can range from thousands to millions of rows of data. This data can be collected using timeline applications, including such applications as Log2timeline (http://log2timeline.net/), Aftertime (http://www.holmes.nl/NFIlabs/Aftertime), or through scripts and applications such as RegRipper (http://code.google.com/p/regripper/) developed for collecting timeline data.
Even the export of file lists from forensic analysis applications such as X-Ways Forensics (http://www.x-ways.net) can be used to create a timeline. However, exporting massive amounts of data most likely will contain an amount of information not needed for your investigation. At that point, time will be needed to substantially cull the data in order to understand specifics and context of a certain incident.
As information can be imported into a timeline that is specific to a file type, separate timelines are able to show focus on specific events. For instance, graphic files, documents, or system related data such as registry files can be either combined into one timeline or separated into individual timelines depending on your objective. Figure 6.8 shows filtered data of USB device use only, sorted by date created, as an example of a narrowly focused timeline, or mini-timeline, displayed in a spreadsheet.
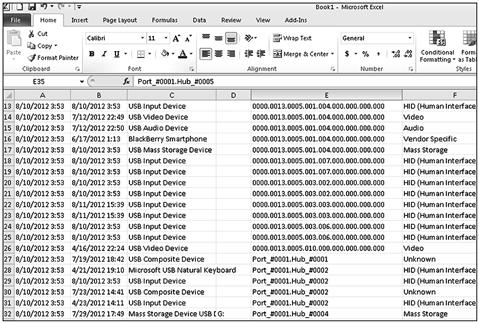
Figure 6.8 Spreadsheet timeline example with USB device data.
Since a spreadsheet timeline can contain millions of rows of data, analysts may simply underutilize this method of analysis simply for being overwhelmed. Even if a massive spreadsheet was sorted and filtered for review, the time spent can be intensive. However, I know of no better method of showing the chronology of events than a timeline.
Charts and graphs created in spreadsheet applications are an effective means to visualize massive amounts of data. Using data in a particular spreadsheet, charts and graphs can be updated as information is updated. Visual representations of data may be easier to comprehend the nuances of relationships between events. The visual impact of a chart as compared to a listing of information is shown in Figures 6.9 and 6.10. Figure 6.9 is an example of Internet history shown in a spreadsheet which includes the number of visits per website. Creating a chart of this data gives a clearer picture of the differences of website visits as seen in Figure 6.10.

Figure 6.9 Example of a spreadsheet displaying Internet history.
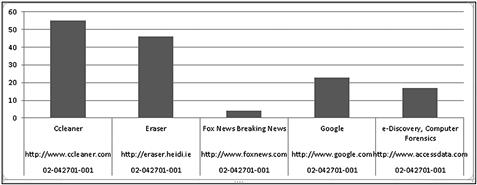
Figure 6.10 Example of a graph visually displaying the number of website visits.
The chart seen in Figure 6.10 shows that the “Ccleaner” website was visited much more than the other listed websites. As a case presentation method, this is impactful to explain data. As an analysis method, it can be insightful into your data. Given massive datasets of Internet history, outliers of pertinent facts are glaringly obvious.
The spreadsheet timeline is an effect method of analyzing data, finding patterns or anomalies, and differentiating which data is evidence from data which is not. Although using charts and graphs in spreadsheets assists in the analysis of data, these same methods can be used in the presentation of data, which will be discussed in a following chapter.
Analysis with databases
As storage device capacity grows, the amount of data grows with it. Spreadsheets can become overwhelmed with data and at that point, become useless. A database is an option to consider helping with data analysis when the amount has outpaced a spreadsheet. Relational databases, such as Microsoft Access seen in Figure 6.11, can be linked to spreadsheets, searched, shared, and used to determine relationships between data.
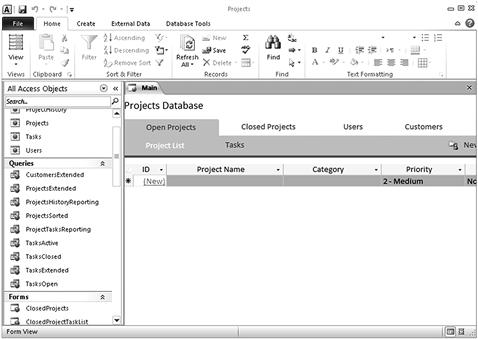
Figure 6.11 Microsoft Access, http://www.microsoft.com.
Depending upon the chosen database application, scalability can extend from small teams of investigators to an entire organization. A spreadsheet timeline can be imported into a database or converted into a database for analysis. Since databases have a powerful ability to store, organize, and manage large datasets, the ability to import multiple spreadsheet timelines allow management of many separate datasets as one.
Especially when multiple timelines have been created for multiple computer systems, databases are an effective means of analyzing the timelines through importing into a single database. Creating queries to generate tables and reports based on a single or multiple filters can be run against millions of rows of imported spreadsheet timelines. One example of a query could be a search for a USB device serial number or particular file. When queried, a database will output a table or report of all instances of that file, across all imported spreadsheet timelines. Mini-timelines consisting of hundreds or fewer rows can be created from a query in a short period of time rather than searching millions of rows in multiple spreadsheets for the same information.
Since timelines are based on timestamps from the filesystem, combining different timelines into a single database requires converting all timestamps into a common time zone, such as Coordinated Universal Time (UTC) also known as Greenwich Mean Time (GMT). UTC/GMT is the time standard used worldwide and is a good option of standardization multiple time zones in your investigation. Otherwise, the timeline will be confusing at best.
An example of the searching capability of a database is seen in Figure 6.12. Using FileMaker Pro (http://www.filemaker.com), multiple spreadsheet timelines have been imported into one database. Through the search feature, any number of metadata fields can be specified for searching, either through one selected evidence item or all evidence items.
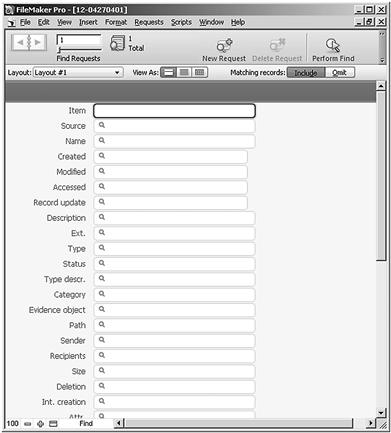
Figure 6.12 Sample of metadata fields created in FileMaker Pro.
The result of a search can be viewed within the database program or exported into a mini-timeline spreadsheet or document. One search example for a date of 10/20/2010 is seen in Figure 6.13. Through the use of a database, individual or multiple timelines, especially those with millions of rows, can more easily be searched, managed, and exported into smaller and narrowly focused timelines.
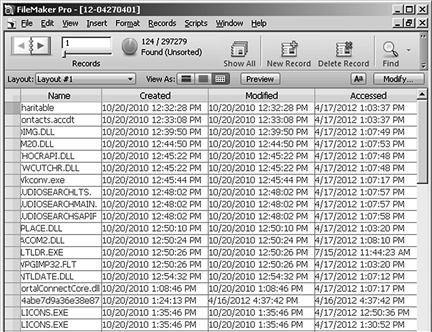
Figure 6.13 Results of a date search using FileMaker Pro database.
Nearly all forensic analysis applications can sort and search like the described database programs. The forensic analysis applications can even export the results to a spreadsheet format too. However, the more powerful capability of a database program is the manipulation of data to create a uniquely desired product suited for a specific purpose. Through this manipulation of displaying data, inferences can be gained toward reaching that Eureka! moment where you recognize the evidence placing your suspect at the computer.
Analysis using charts
Charting information allows for visual representations that can help interpret data, and turn a complex investigation into an easy to understand concept. The type of chart depends upon the type of information to be displayed. Link charts and matrix charts show relationships, flow charts and event charts show a sequence of events or processes, and organization charts show hierarchy.
The matrix chart has been discussed in a previous chapter as a means of identifying and eliminating potential suspects. Although simple, the matrix chart is extremely effective given almost any number of potential suspects and can quickly be understood. See Figure 5.1 as an example of a matrix chart.
Link charting is another method to quickly visualize relationships between persons or events. As a data analysis method, suspected or confirmed relationships are immediately made obvious through symbols. A basic foundation of symbols used in a link chart can be seen in Figure 6.14. Through the use of basic and simple symbols, clarity in relationships becomes obvious.
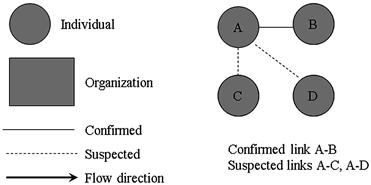
Figure 6.14 Basic foundation of link chart symbols.
Using the basic design symbols from Figure 6.14, an example has been created in Figure 6.15. In this example, it is clearly seen that only Suspect B has access to both evidence computers, PC 1 and PC 2. Suspect C has access only to one evidence computer and Suspect A might have access to PC 1.
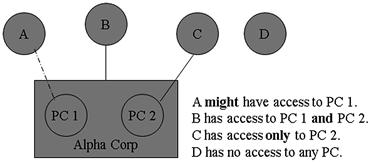
Figure 6.15 An example of a link chart showing relationships between persons and personal computers.
Suggestions for link charts include avoiding crossing lines to avoid confusion, and keep the charts simple and to as few points as possible. Solid connecting lines are confirmed relationships whereas dotted lines are not confirmed. If there is not a relationship between a person and/or evidence item, then no connecting line is made, showing no relationship. Although Figure 6.15 is a simple example, it only takes seconds to see relationships without requiring explanation even if the data was more intensive.
The creation of link charts can be made using paper and pens or using any number of software applications. Microsoft Visio (http://www.microsoft.com) is one example of a program developed for this type of diagram. As seen in Figure 6.16, Visio allows for easy creation of link charts and analysis with pre-defined shapes and symbols. Programs developed specifically for data analysis, such as the IBM i2 Analyst’s Notebook (http://www.i2group.com), allow for automated creation of links, charts, and graphs. These more powerful programs have advanced features of data analysis beyond creating link analysis diagrams which may be necessary in large investigations.
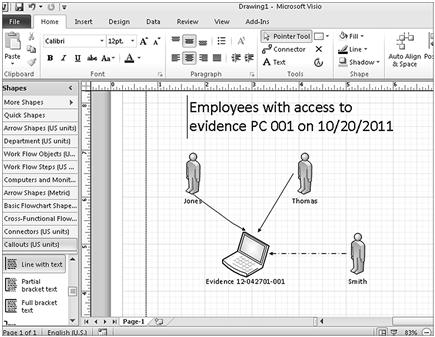
Figure 6.16 Microsoft Visio link charting example; http://www.microsoft.com.
Event and flow charts can be used to display a chronological chain of events of an investigation or a computer application process. Figure 6.17 shows the requirements to physically access a computer which was used to send an email under investigation. The chart implies only one employee had physical and login access rights to the suspect computer out of over 100 persons at the location. Actual cases will most likely require more complex charting but the concept remains the same; visually show facts to more easily see the less obvious.
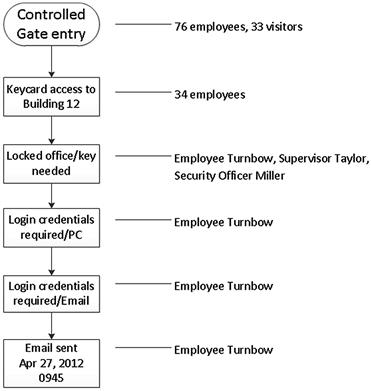
Figure 6.17 Event flow chart depicting physical access to an evidence computer, where 109 persons are initially suspected, but only 1 person had access.
Used in combination to the information displayed in Figure 6.16, a visual timeline created from both a forensic analysis of the suspect computer and investigative information can be seen in Figure 6.18. By employing several analytical methods to analyze information, a narrowing list of suspects is created or may show that only one suspect could have committed the alleged acts.
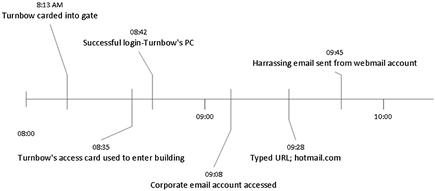
Figure 6.18 Visual timeline showing activity of an employee in relation to computer activity.
Analysis using maps
Previously discussed geolocation data showed that suspects can be tracked by several means, such as call data records, IP addresses, and physical surveillance. Plotting this data on a map shows a suspect’s movements and location in relation to an investigated event, such as downloading contraband or unauthorized access to networks. Of course, a mobile device must be attributed to a suspect before assuming the geolocation in a particular device belongs to the suspect. This can be done in varied ways, such as reviewing the call records and verifying calls made were the suspect’s. These calls can be to the suspect’s home, workplace, or to witnesses corroborating the calls.
Plotting geolocation can be accomplished manually, either by plotting each separate location onto a map or by creating mapping data files which can be read and imported by geolocation plotting applications. One such application is GPS Visualizer (http://www.gpsvisualizer.com). GPS Visualizer is a free online utility that creates maps from GPS data. The GPS data can be a combination of way points, EXIF geolocation data, or manually imported locations.
Given a mobile device, the amount of data to analyze may be more than simply creating a map and need specialized software. An example of an application well suited for cell phone analysis is GeoTime (http://www.geotime.com). As seen in Figure 6.19, GeoTime can show the time and location of a mobile device. GeoTime can also show the frequency of calls made.
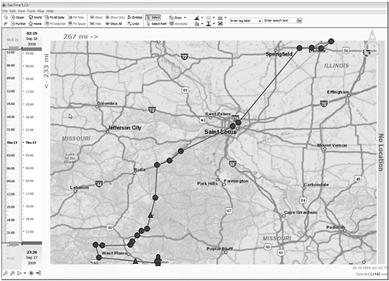
Figure 6.19 GeoTime screenshot, courtesy of GeoTime, http://www.geotime.com.
Perhaps the biggest benefit to using specialized analysis applications is the ability to easily manipulate the viewing of the data. As opposed to manually updating and revising visual appearances, programs such as GeoTime allow for instantaneous changing of views and data through an intuitive interface.
PerpHound, a law enforcement only program provided by NW3C, provides a similar function to GeoTime. PerpHound also exports call data records into a Google Map, showing a suspect’s movements. Figure 6.20 is a screenshot showing a call data records of a suspect in relation to his home.
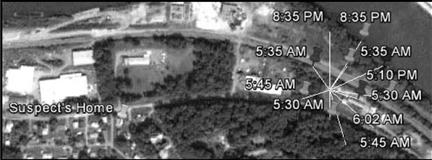
Figure 6.20 PerpHound, courtesy of NW3C, http://www.nw3c.org.
As with any analytical method, mapping coordinates without a purpose may lead to being overwhelmed with information but also is a powerful method that visually places a suspect at locations of activity under investigation.
Fresh set of eyes
Sometimes, by staring at data for long periods of time, the only result is eye strain. Even working a long-term investigation can result in a lack of results by not being able to truly understand the context of events. When that happens, it’s time for a new set of eyes. This requires the analyst to take a step back and regroup.
Or even better, someone else should take a look at the data and case. Having a different perspective makes a huge difference in how information is seen and understood. Having several sets of eyes looking at the same information usually results in new ideas, better comprehension, and finding the evidence that was sitting there the entire time. That makes all the difference in a case.
Summary
The forensic analysis of electronic storage devices uncovers details of activity under an investigation, whether it is criminal violations of law or internal corporate violations. Yet, without supporting evidence, the forensic analysis does not unequivocally place a suspect to that activity. This chapter gives insight into the analysis of information, both recovered through digital forensics and that of traditional investigation methods.
Another aspect to consider when analyzing datasets is that all types of information can be analyzed to develop investigative leads and additional evidence. As deleted emails can be recovered from a hard drive for analysis, the actual words of the email can be analyzed for comparison against sample writings of the suspect. The analysis of text can show how specific words are used, the frequency of words, grammar, and level of writing, all of which may be attributed to a person.
Internet history in and of itself will show use of browsers and the websites visited. An analysis of the actual types of websites, typed URLs, bookmarked pages, and number of visits to each page can show the intention and knowledge of the computer user related to alleged acts.
The secret ingredient in this chapter has been to look into the data, look into each specific data, and look at the data holistically to find the meaning of the evidence, not just hard facts. Even as the suspect’s data can be analyzed, your own notes may hold the key that is missing to place the suspect at the keyboard.
Bibliography
1. Bulk Rename Utility. <http://www.bulkrenameutility.co.uk>.
2. Carvey H. (2012, June 11). Timeline analysis. <http://windowsir.blogspot.com/2012/06/timeline-analysis.html>.
3. CaseNotes. <http://qccis.com/resources/forensic-tools/casenotes-lite1>.
4. EverNote. <http://www.evernote.com>.
5. FileMaker. <http://www.filemaker.com>.
6. GeoTime. <http://www.geotime.com>.
7. GPS Visualizer. <http://www.gpsvisualizer.com>.
8. IBM i2 Analyst’s Notebook. <http://www.i2group.com>.
9. KeepNote. <http://www.keepnote.org>.
10. Log2timeline. <http://log2timeline.net/>.
11. Microsoft Office. <http://www.microsoft.com>.
12. NoteKeeper. <http://www.tolon.co.uk/software/notekeeper>.