
Case Presentation
Information in this chapter:
Introduction
This chapter will discuss methods of presenting electronic evidence for a variety of audiences. The admissibility, authentication, chain of custody, and other aspects of what is evidence are extremely important to every case; however, this chapter will only minimally discuss the actual evidence and focus more on methods of presenting your case. After all, the objective of any investigation is to convey to an audience the facts of the case in a manner that they understandit.
Keep in mind that your goal of placing the suspect behind the keyboard rests upon your presentation clearly describing your case. Articulating your case in a manner in which your audience will have a picture in their mind, will also have your audience place the suspect behind the keyboard. This can be accomplished without you having to say it directly as the audience will say it for you.
It’s Not Whether You Win or Lose
As a witness, your primary function in presenting case information is simply explaining the facts. Experts will give opinions, keeping that these experts’ opinions are just as truthful as any fact and include their interpretations of computer user activity.
Investigations are conducted to uncover the truth, where both inculpatory and exculpatory evidence is authenticated, corroborated, analyzed, and interpreted for relevance and veracity. To have any preconceived beliefs or opinions discredits a fair investigation. You must be open to all possibilities and eliminate possible suspects through a fair investigation until you are left with only a list of reasonable suspects.
With an open and inquisitive mind, the facts will lead you to the truth of the investigation and analysis. Proving and disproving theories, corroborating and discrediting alibis, and verifying information will allow the case to speak for itself. But how do you convey this information to your audience and how can you have an inquisitive or investigative mindset to accomplish this?
Investigative Mindset
Having an investigative mindset helps you to prepare your presentation as you need to know the why and the how of presenting information to convey the facts just as you did investigating your case. One of your goals in presenting your case is showcasing how you arrived at your beliefs without actually saying it. As you answer the fundamental investigative questions of who, what, why, where, when, and how, your audience can put the case together in their own minds, as if they were the investigator. When that happens, your audience places the suspect behind the keyboard, not you.
Good investigators get asked the same questions time and time again. How do you do it? Why are you so lucky? What is your secret? Another set of similar types of questions are asked at trials and hearings. Why did you suspect this person and not that person? Did you focus your entire investigation on one person? These types of questions are intended to discover your mindset and to find out what you were thinking. The investigative mindset not only helps you be a great examiner or investigator, but it also helps you prepare your case for presentation by being able to articulate your thought processes.
Whether you are an investigator conducting surveillance on a suspect or examining the registry for computer system settings, being curious most always leads to uncovering evidence or leads to evidence. Perhaps there is one clue that happens after days or weeks of intense focus, but sometimes that one clue is what makes a case. Whether you wait for a clue to appear or relentlessly dig for it, the clue is there. You just have to find it and know it when you see it. You want your audience to see it just as you did.
An example I have given in workshops on investigative mindsets is a personal experience where I’ve seen two police officers, standing side by side, and both looking at the same street corner. One officer saw several criminal acts occur where the other did not, even though they were looking at the same activity. This occurred many times. Simply, one officer observed and asked why is that person there and what is he doing, whereas the other officer accepted two people standing on a street corner as just being there. Just as important is the ability to effectively communicate these observations, feelings, and beliefs to your audience.
Digital forensics is not so different when looking at computer activity. Being able to ask questions such as, “why does this file have a modification data stamp that precedes the creation data stamp” does not require a law enforcement commission to possess the superpower of curiosity. If any detail of an investigation doesn’t seem right, maybe it is not right and should be examined more closely. This even applies to your gut feeling or intuition where you should ask yourself, “why do I get the feeling something is missing.”
Asking these questions during your investigation and analysis allows you to miss less evidence. This mindset will help you to develop an effective means to convey your investigation to others for your case presentation so your audience will also have a clear understanding.
Your Audience
You need to know your audience and the venue for your case presentation to be effective. This chapter gives several methods of presenting your information, but not every method will be appropriate for every type of audience. Your presentation could be informally presented to a supervisor or formally before a Congressional hearing. Even different courtrooms and judges will have varied rules on how digital evidence is presented.
Not knowing your intended audience or their needs most likely will result in at least embarrassment of a presentation or the complete failure of presenting your case effectively. There are instances where an audience, such as an attorney, just wants to know if the evidence points to guilt or innocence of a client, without having to read dozens of pages of forensic analysis. Other audiences require minute details of analysis, but both audiences require the presenter to be aware of the objectives for presentations.
The one thing to avoid is to think that you are the audience. As much as you may want to toot your horn, show off your great work, and speak in complicated technical jargon, the only person that will be impressed is you. Everyone else will be dazed, confused, and not at all impressed. Some in your audience may be plainly irritated. Case presentation is for your audience and you succeed when your information is clearly understood and this requires preparation.
Preparation
The work of preparing your presentation may be the only part of case presentation where you have total control. The information is in your hands, arranged in the manner you prefer, and any technical problems can be tested and corrected. Since you have this luxury during the preparation phase, take advantage of it because during the presentation, the control of the information may be completely out of your hands.
The amount of time to prepare depends on the complexity of the investigation and your audience. One case presentation may require an hour to prepare while another requires weeks to prepare. The objective in both of these scenarios is the same, only the time needed will vary.
Organizing Case Information
Maybe you are the sole investigator tasked with an entire case, conduct all forensic analysis and interviews personally, and maintain all information centrally. If that is the situation, gathering and organizing case information will be fairly easy. However, many investigations have more than one person involved to include a variety of third parties such as Internet Service Providers, witnesses, co-case agents, and multiple examiners. For these situations, collecting and organizing case information takes a life of its own just trying to track down all reports that may have been written. But it has to be done, especially finding all written reports.
Read all the reports. Read them all again. Find any inconsistencies and loose ends and make sure each written statement is corroborated with supporting evidence. During this process of reviewing reports, should anything negative to the case be found, take corrective measures and inform your client or legal counsel immediately. No one likes surprises during a presentation of evidence. If supplemental reports are needed to clarify information, make sure they are written and submitted to the case file.
Organize your information. Printed information can be organized in folders, but what about a gigabyte or more of data collected throughout the case? Emails, electronic documents, scanned letters, and other electronic evidence files contained on an external drive may need immediate and unplanned production at any time during case presentation. One answer is to use forensic applications that can double in organizing your case data. An example seen in Figure 7.1 is dtSearch, an indexing application typically used as a forensic tool but also excels at indexing your case information to be searched on the fly.
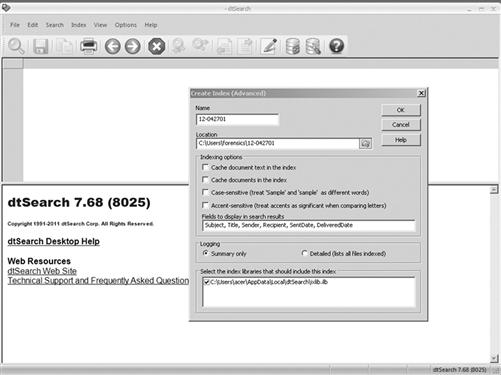
Figure 7.1 dtSearch indexing application, http://www.dtsearch.com.
Complex cases that contain hundreds of thousands of electronic files are better served being indexed, that is, a database of words and numbers of the files created for ease of searching. dtSearch not only indexes large datasets, but it can create reports of the searches, export the files found, and even highlight the keywords found. A utility such as dtSearch enables you to find information quickly that might have been easily be overlooked when manually searching files on a hard drive. Being asked a question on the spot by your boss, client, or judge for whom you don’t have answer is stressful enough, but not being able to find the answer makes it that much worse.
Value of Visuals
The cliché that a picture is worth a thousand words does not accurately describe a visual used in your presentation. In a case presentation, one visual can be worth the entire case. As most people grow up learning visually, whether in math class using charts and graphs to see numbers or through art, understanding by seeing is an effective method of learning.
In the tale of three blind men attempting to describe an elephant with words, each basing their description on the part of the elephant each person touched, such as the tusk or the tail, they could not agree on the totality of the elephant’s description. Presentations require the spoken word for descriptions, but visuals can make sure that each person in your audience understands and sees thesamething.
Compare the following examples. Figure 7.2 shows a paragraph describing an average evidence scene with multiple evidence items.
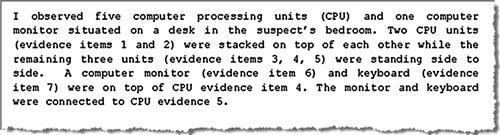
Figure 7.2 Written description of an evidence scene with multiple items.
The accompanying figure to the written description is seen in Figure 7.3. Although this is a simple photo of the items described in Figure 7.2, the photo clarifies the scene in the mind of your audience without misunderstanding.
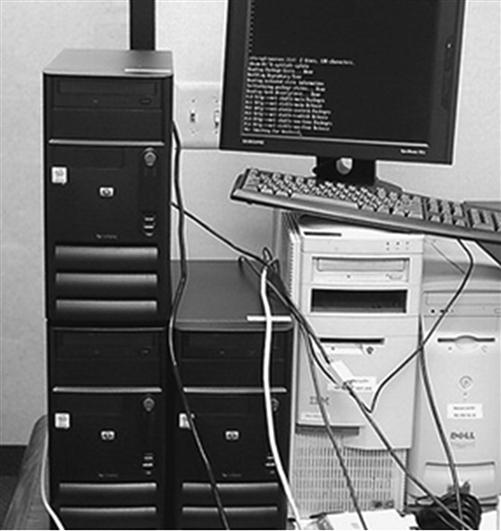
Figure 7.3 A sample photo of the evidence seen described in Figure 7.2.
Although the report accurately reflected the physical evidence scene, the ease at which a visual aid clarifies the words is dramatic. Taking this one step further to clarify the physical connections described in the report, review Figure 7.4 as an example of a visual created to visually show the connections.
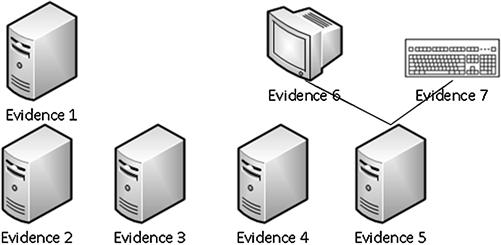
Figure 7.4 Visual created to show connections between devices.
The value of visuals cannot be understated but can be overused. As long as your audience has the sense of sight, visuals will enable all to see that which you verbally describe. The key ingredient, however, is to choose the right type of visual to use for each situation and only use visuals when needed, not just for the sake of creating visual aids.
Presentation media
Not all media presentation methods, visuals, or equipment used may be suitable for every type of presentation. Your audience may be a technically proficient supervisor who will not need visual aids to understand a verbal presentation. Another audience could be a jury where your audience’s technical knowledge is unknown and can range from someone never operating computers to computer experts.
Within this range are presentation limitations based on limited technical resources or even restrictions on using specific types of technical resources by a specific judge. Therefore, having access to a wide range of presentation media and the ability to use each effectively will allow you to tailor your presentations accordingly.
As much as any forensic examiner uses technology, reliance on any technology cannot be taken for granted nor expected to work all the time. Computers and software programs crash, a surprise shortage of outlets prevents use of a projector, bulbs burn out, and sometimes, nothing seems to work as expected when needed. These electronic devices, such as projectors, computers, video players, and televisions, will eventually fail, all of them, at some point in their normal lifecycle. Expecting that this day of equipment failure will occur when you are presenting your case will make a big difference in the outcome if you are prepared with backup plans.
Backup plans include the use of non-technical media devices such as white boards, flip charts, posters, and even chalk boards. These will work as long as you have writing utensils. When technology fails and you are not allowed the time to correct the issues, having a backup plan may save your presentation. However, there are substantial drawbacks to using these items.
As an example, using a flip chart or standing dry erase board, as seen in Figure 7.5, requires that you write on it, and therefore, be in front of it, blocking the view of the flip chart. Your writing legibility is critical, as is your artistic ability, in order for your audience to read your writing and interpret your drawing.

Figure 7.5 Flip chart/standing dry erase board, when technology fails, may be a good backup visual aid.
There are no “do-overs” either, as that what you write and draw, unprepared, has been memorialized. But most importantly, is that at least having non-technical devices as a backup, you will still be able to deliver your information in a credible manner should you need to visually illustrate your information when technology fails.
Beyond the physical devices and articulation needed to convey your investigation, there is the dilemma of choosing the manner that electronic data is visualized. Since electronic data is not a physical object that can be held with hands, choosing the right format to display the data is crucial for understanding by your audience. Luckily, there are many ways to visually display any amount of data.
Slideshows and animations
A slideshow presentation can be one of the best methods to display your case. It can also be the worst if incorrectly used. When used appropriately, a slideshow presentation allows conveying of information in an organized manner. Depending upon technical arrangements, a slideshow can be projected onto large screen or onto individual monitors for each member of your audience. The individual slides most likely will also need to be printed, which allows for note taking and review. Examples of website screen captures are seen in Figure 7.6 with note taking area for each slide. Diagrams, charts, graphs, and other depictions of case information can just as easily be displayed.
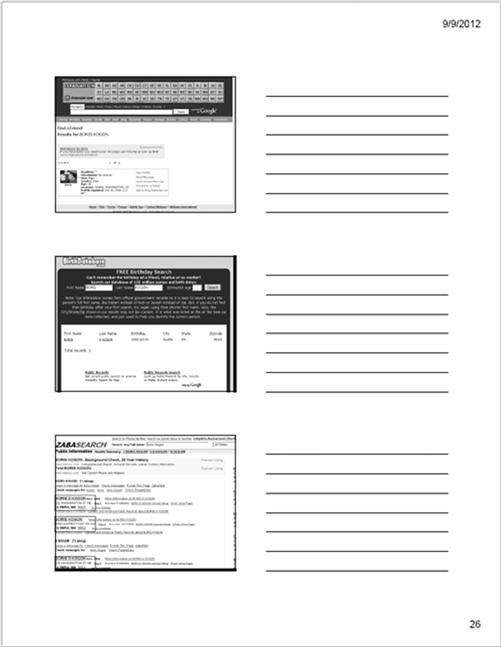
Figure 7.6 Example of a printed slideshow presentation showing three website pages.
The phrase “death by Powerpoint” is a truism when a slideshow consists of excessive, unnecessary, irrelevant, or confusing information. Case presentation can be supported by use of a slideshow if it is put together coherently. A slideshow is not your case presentation. Each slide should have specific relevance and give context to the data you are explaining, with as few words on the slide as possible. The goal is not having a pretty presentation, but creating a method that the data can speak for itself by way of visual representations.
Fancy fonts, transition effects, and sounds may not only detract from the meaning of each slide, but can also have a negative impact on a particular person. These unwanted impacts could be the result of the use of colors used in a graph that have negative connotations based on culture. Even a certain combination of colors can have a negative meaning that detracts from your data presentation. Additionally, any person who is color blind may not be able to see the point of the colors chosen. Some colors may even be likened to causing a prejudicial emphasis. To lessen the risk of offending your audience, avoid the use of colors in your charts and graphs and use shades of black.
Charts and diagrams
The objective of visualizing a dataset depends upon the type of data and the point you want to convey to your audience. These visual aids can be created using commercial software, such as Microsoft Visio or even drawn on poster boards. The visual can be a direct representation of data, such as seen in Figure 7.7. This type of chart easily shows a listing of different types of data by the amount of each kind of data.
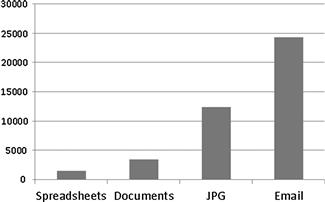
Figure 7.7 A graph of number of files on a hard drive as a comparison to each other.
This type of chart can be broken down even further within each type of file format to emphasize a fact. Figure 7.8 extrapolates a file type from Figure 7.7 into a separate chart to emphasize the context of graphics. This method can easily be used to show the number of any file type of relevance. Another example could be to show the number of stolen intellectual property spreadsheets as compared to the number of other spreadsheets on a system.
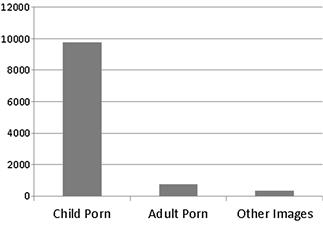
Figure 7.8 Extrapolation of graphics taken from figure 7.6 comparing the content of graphics on a computer system.
As easy it may be for you to visualize the data that you have come to know in the investigation, as the presenter, your objective is to make your audience quickly and accurately interpret your work as you know it. Charts are an easy and effective means to visualize some types of data in a way that fewer words are needed to explain the data.
Complex computer systems, such as corporate networks, are difficult to describe in words. The biggest hurdle is describing computer networks or even describing how a computer works. Many computer users have not seen how computers are physically connected in a network or how data moves between systems. Diagrams may be the best solution, if not the only solution other than building a network, to show the inner workings of complex computer networks. Figure 7.9 shows an example of a shared network printer, where four client computers have access.
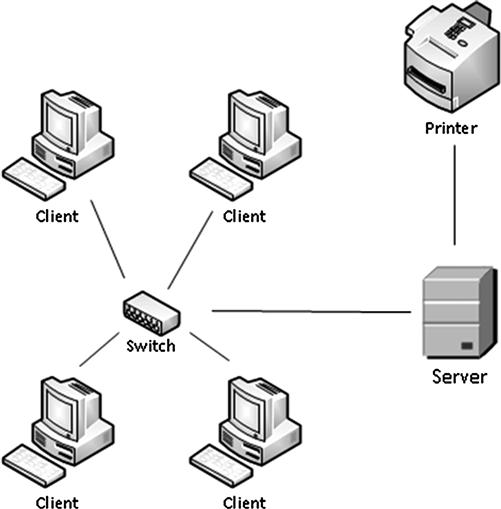
Figure 7.9 Example of a network diagram showing a shared network printer.
As large networks contain many servers of various types with hundreds of client machines, complex diagrams can quickly overwhelm an audience. If the objective is to show the connection between client computers and a shared printer, the diagram should be made simple enough to only show that facet. Unnecessary information only clouds understanding.
Diagrams can also be used to show movement, or flow of processes. The booting of a computer system can be shown through a flow chart diagram, visually depicting each step in the booting process. Flow charts can be used to show how a virus infected a system and spread. Even the historical movement of a file across computer systems can be shown through a flow chart or visual timeline.
An example seen in Figure 7.10 shows one identical evidence file created on different computers depicting a timeline of the file traveling to different computers. This could be through emails, external media, or through a network, but regardless of the method, gives a visual of when this particular file came into existence on different computer systems.
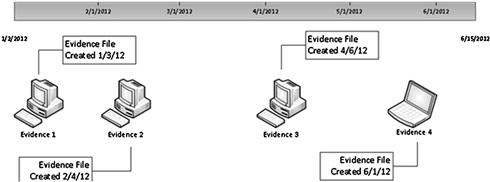
Figure 7.10 Example of one identical evidence file as it was created on four different computers over a period of time.
This same concept of historical file movement and changes on a single system can be shown on the same type of timeline as seen in Figure 7.11. Tables, or spreadsheets, that contain data organized by date and time are effective in showing extreme detail of activity of a computer system. Specific types of activity of importance can be pulled out of the spreadsheet and visually shown to an audience to emphasize the importance of that specific data. Such would be the case seen in Figure 7.11, where one file is shown from creation to deletion, including the possibility of being copied onto a USB device.
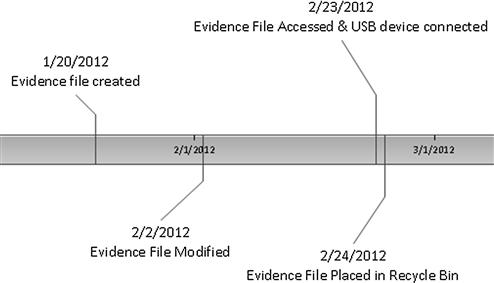
Figure 7.11 Historical file movement on a single computer system.
Most events taken from detailed spreadsheet timelines can be visually shown in graphic timelines such as these. However, the time required to create each timeline compared with the number of important events must be taken into consideration. Simplicity is also important as not to cause your audience to shut down their senses due to being overwhelmed with information.
Data from timelines can be shown as it relates to each other, outside of relation to dates and times. For example, a listing of phone call records with hundreds of calls is difficult to visualize. Figure 7.12 shows a call detail record from the Casey Anthony trial. As you can see, this is only a portion of the entire record and even though the calls are listed in chronological order, the numbers dialed are not in order, nor could they be. It is difficult, if not impossible, to visualize which numbers most often.
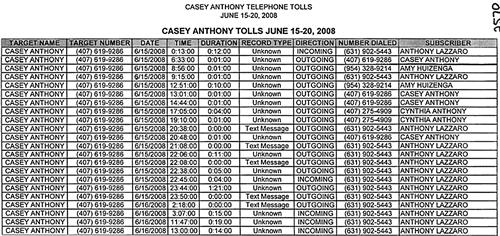
Figure 7.12 Portion of a call detail record (State of Florida v. Casey Marie Anthony (2011)).
This information can be displayed in a graph, as the previous Figures 7.7 and 7.8, to show the number of calls to each number compared to each number. Another method of displaying the call detail records other than a list of the information can be seen in Figure 7.13 where outgoing calls made to individual phones are easily understood. Diagrams such as this can be created using software applications that automatically cull data from spreadsheets or even created with markers on a flip chart.
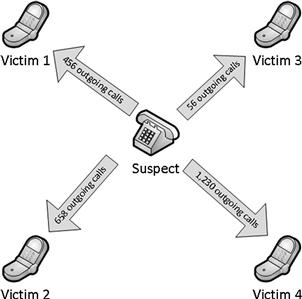
Figure 7.13 Example flow chart showing outgoing calls.
There are many different types of graphs and charts to display any type of data, from pie charts, bar charts, area charts, scatter charts, and bubble charts. Depending upon the data you need to display, the type of chart used will either make it easy to understand or be completely confusing. Examples of poorly chosen charts include pie charts with more than five pieces. Seen in Figure 7.14, there are too many unrelated data items on the same chart resulting in a fairly useless and probably confusing visual aid.

Figure 7.14 Ineffective use of a pie chart, where there are more slices of the pie that can be effectively understood.
Even bar charts, which are simple to view and understand, can be made complicated if the bars are random and not ordered. Never randomize data as your audience will have to figure out a pattern out of random data. It should be visualized either by location, chronology, category, hierarchy, numerical, alphabetical, size, or amount. Figure 7.15 shows how random bars do not effectively represent the data as compared to ascending or descending bars. In this example, Chart A is the clearer method, whereas Chart B does not have a pattern.
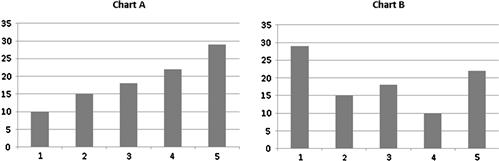
Figure 7.15 Examples of an effect bar chart (Chart A) and ineffective bar chart (Chart B).
As the data presented in many forensic exams consist of numbers and that charts and graphs may be used to visualize this data, it is prudent to be aware of basic math as it applies to your data. By not knowing the difference between the Mean (simple average), Median (middle value of a data set), or Mode (most often occurring data) could affect your credibility since you are displaying numerical data.
Even percentages can be misstated with a great negative effect. Stating that 10% of all internet sites visited were related to “murder” is not the same as saying the top ten internet sites visited were related to “murder.”
There is high value in using charts and diagrams as long as reasonableness is constantly considered. Overuse or misuse will not only cause confusion, but may counter the point you wanted to get across in the first place. Charts and graphs with incorrect data can discredit your presentation altogether.
The Suspect’s Machine
There are instances where a file listing or chart won’t do justice as much as seeing the actual file as it exists on the suspect computer. Describing how a suspect computer has been configured is one thing but showing it on a projection screen is much more effective. The best method to show the suspect’s computer system is through creating a virtual machine from the suspect’s computer system. A virtual machine is a software implementation of a guest virtual operating system that runs within a host physical computer system.
There are several methods in which a forensic image of a suspect’s operating system can be converted into a virtual machine which can be run on almost any computer as a program. One of these methods involves using software utilities, such as Virtual Forensic Computer (http://www.virtualforensiccomputing.com/), to create virtual machine configuration files that will allow the forensic image to run as a normal operating system.
The power of a visual to describe a virtual machine can be seen in Figure 7.16, where a guest operating system can be seen running within a host operating system. The virtual machine is a complete operating system, running within a program window and separate from the host machine. The virtual machine can be paused and reset to its original state at any time, making it a great tool of representing the suspect’s operating system as part of a case presentation.
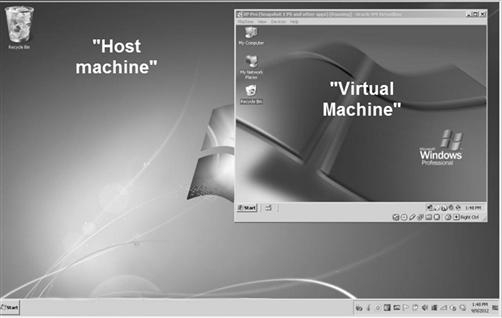
Figure 7.16 A “virtual machine” running on a “host machine.”
There are several benefits to using a virtual machine to visually display a suspect’s computer system. The most important benefit is that it avoids having to boot an evidence computer which would irreparably alter electronic data contained on it. A virtual machine can be booted and restored to its original state as many times as needed to test theories and show the file settings chosen by the computer user as the computer user saw it.
The effect this has compared to the written or verbal description is dramatic. Consider describing an evidence file discovered on the suspect’s computer. An example of a file residing on the desktop can be described in a report as seen in Figure 7.17. A person unfamiliar with file paths on computer systems could have a difficult time visualizing this description, even if the description is concise and accurate.
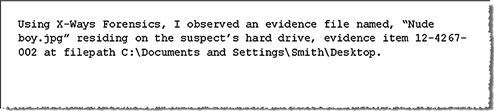
Figure 7.17 Description of an evidence file by filepath.
Using a virtual machine to show this description of a file’s location takes on an entirely different and more accurate meaning as seen in Figure 7.18. Any person who has ever used a computer has also seen the desktop and icons on the desktop. This type of visual demonstration quickly and accurately conveys your thoughts to the audience without misunderstandings. Using a virtual machine can be used to show Internet settings, such as bookmarks chosen by the suspect, files residing in the Recycle Bin, and other aspects of user activity as it exists on the suspect’s computer.
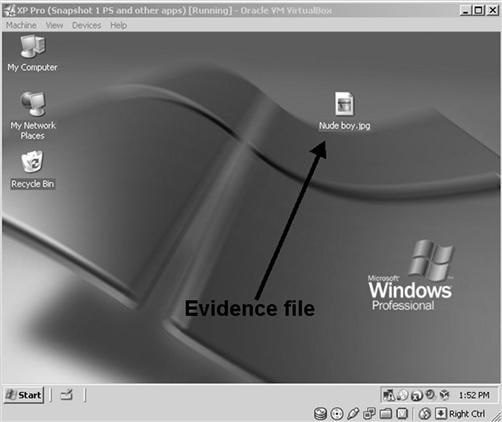
Figure 7.18 A suspect’s computer system, booted virtually, showing the location of an evidence file on the desktop.
Analogies
Over the past decade, a new language has been developed in the digital forensics community. A mixture of legalese and technical terms, spoken only by those in the community, tends to confuse those outside this community. Terms such as “prefetch files” and “jump lists” are meaningless to the layperson if not understood. Forensic examiners know the importance of these files as artifacts of user activity, but should not expect the audience to have the same knowledge without some explanation.
Generally, when a presenter knows a subject matter very well, the information can be presented verbally in a manner that can be easily understood in clear language. Sometimes this is not possible and analogies may be needed to describe intangible electronic data by comparing it to tangible objects. Comparisons between items are commonly used, such as comparing the tastes of foods, appearances of objects, and even comparisons between persons.
However, an important aspect to remember is to choose an analogy that can be compared reasonably. As an example, a library is a common object to use as an analogy, such as a hard drive stores electronic files like a library stores books. Libraries are well known and do not need much more description to be understood. Choosing a relative unknown item for comparison, such as a “Mars Rover” to compare with a hard drive not only confuses the audience about a hard drive, but adds a new confusing concept of a vehicle on Mars.
The use of analogies can also create other problems. The opposing counsel or your audience may disagree with your analogy, or twist the intention of the analogy to the point of being meaningless or opposite to your original goal. Other analogies may be too simplified for the subject you are attempting to describe. The risk of using an analogy which your audience may not understand can result in confusion of the analogy, how it relates to the data you are explaining, and a decrease in your credibility of knowing the subject matter. When analogies are to be used, test them with a non-computer literate audience by quizzing your audience to explain it back to you. Better to find your analogy doesn’t work in the office rather than during your presentation.
Luckily, due to a multitude of court cases and police television dramas, the public is more aware of electronic evidence than ever before, even if they have some misperceptions. The ability to recover deleted files is nearly a commonly known fact among any computer user. As digital forensics becomes even more widely known and each new generation of computer users are more knowledgeable about technology, the need to use analogies will decrease.
Sometimes, the use of analogies to help place a suspect behind a keyboard can be an effective tactic. Consider having to explain to your audience that the suspect was the only person that could have sent an email from a specific computer and email account, from a specific location such as the suspect’s home. Acommon defense is “some other dude did it.”
Through visual aids, such as slideshow showing a computer screen captures, you can show the effort and knowledge needed to send this email. The following section shows a visual timeline of the actions a suspect had to take to send an email.
First, since the computer in this example was seized from the suspect’s home, physical access to the computer was needed. Physical access usually means having a legal right to be in the residence along with the means to enter such as having a key to unlock the door of the residence.
Next as seen in Figure 7.19, in order to operate the computer system, the suspect needs to enter the username, password, and select a domain to log onto the computer.
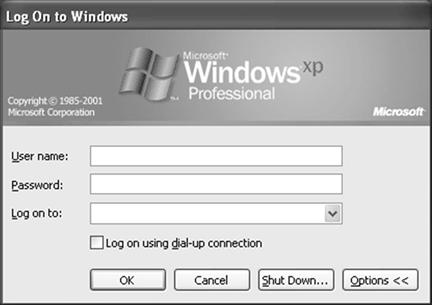
Figure 7.19 Windows operating system login screen, requiring user name, password, and domain for access.
After logging into the computer system with this information, in this same example, the suspect would log into webmail as seen in the screen capture in Figure 7.20. Again, the suspect would need to know the username and password. This may be the same user name and password used for the computer login or it may be completely different.
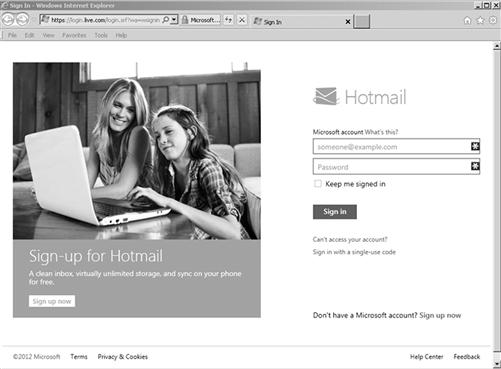
Figure 7.20 Webpage login for Hotmail webmail, requiring username and password (http://www.hotmail.com).
So far in this part of your presentation, you have shown the suspect needed to have physical access to the residence, which requires a physical key, plus also have five items of personal information consisting of 2 user names, 2 passwords, and 1 domain name.
One analogy that could be used in this example is that of a password to an email account or computer can be compared to having a key to open the front door of a home. Typically, the resident of the home controls any and all keys and does not lend them out to strangers or make the keys easily accessible. If a password is commonly known and shared with others, then that would be like giving copies of the key to your home to anyone.
An analogy to guessing the password or cracking the password can be compared to trying to open a combination safe. The person attempting to open a locked combination safe would have to guess every combination of turns and numbers to find the right combination. The more complex the combination is for the safe, the more difficult to guess. Passwords are similar in order to correctly guess the password, every combination of letters, numbers, and special characters would have to be attempted until the right password is found. This could take days, years, or centuries.
The use of this type of analogy would ring true for any person that has a key to their home or ever used a combination lock. It also lends credibility to the likelihood that only the suspect would know the personal information needed to log into the computer and email. Granted, given more than one person having access to the home, the investigation needsinformationidentifying this one suspect, but the analogy remains accurate.
Until then, there are many analogies that have been tried and tested which you can use when needed. Comparing hard drives to libraries, books, or buildings to describe partitions and file storage are effective methods of conveying technology to your audience. The goal should also include the analogies to show the suspect’s relation to the evidence being explained.
Another example of an analogy tying a suspect to having access to certain files is that of file access rights. If a specific folder seized from a computer network is evidence in your case and that folder had restricted rights, then the list of suspects can be narrowed.
Perhaps only a few users had access to the folders, including the network administrator. The analogy to be used could be that of an apartment building. In an apartment building, tenants have physical access only to their apartment and any common area such as a laundry room. The tenants in the apartment building are like computer users on a network, each having their own access to certain folders, some shared and others not. The landlord would have physical access to all areas of the building for maintenance and can be compared to the network administrator. This analogy not only helps explain user rights on a network, but also helps your audience see for themselves a list of possible suspects.
Remember that any analogy can be broken and use them with care. Even the previous example of a building tenant having physical access to their apartment can be broken. A burglary can occur in an apartment, just as a computer can be hacked.
Avoid TMI (Too Much Information)
When you spend weeks, months, or years on a case, it is tempting to talk about every detail to your audience. In legal proceedings, your presentation may be controlled by an attorney and this won’t be an issue. In other venues, such as within your organization or for a client, you could have unfettered ability to discuss the entire investigation with a potpourri of charts, diagrams, and spreadsheets, describing your great work. This may not be a good idea.
You just want understanding of your investigation that places the suspect behind the keyboard. The selective use of analogies to easily describe complex information, specific charts to visually display massive amounts of information, and perhaps timelines of specific events showing and eliminatingall known possible suspects. Most certainly, you probably should not detail every single minutiae of information as at some point, your audience may stop taking in your presentation due to being overloaded with too much unnecessary information.
Your Presentation
Any of the methods and examples in this chapter may be of use in your presentation, but probably not all the examples will be used in one presentation. Beyond accurate technical explanations of computer activity, audiences want a roadmap of what they are about to endure. They want to know where they are going and how they are going to get there. You’ve already done it, now you are going to present the highlights to your audience.
Within this presentation, where you use visual aids and analogies, you are painting a picture in the mind of your audience. Without having to explicitly accuse any suspect of an act, your presentation does it for you. As you have had Eureka! moments during the analysis, so will your audience where they place the suspect behind the keyboard. This can only happen if you know your material well, explain it in layman’s terms, treat your audience as if they are more important than you, and remember the objective; place the suspect behind the keyboard.
The skill in presenting goes beyond this book, but is definitely worth talkingabout. All basic foundations of public speaking apply in every venue of case presentation. Confidence, speaking clearly, professionalism, and being extremely careful with humor all play a part in presenting your information. The use of any visual aids also requires skill and practice. Not blocking the screen or talking to the screen instead of your audience not only detracts from the presentation, but also does not effectively convey your talking points. One of the first rules to become proficient in both public speaking and use of visual aids is practice. The second and third rule is practice more.
Summary
The importance of case presentation is on equal standing of case investigation. A failed investigation cannot be saved by a good presentation and a good investigation can be ruined by a poor presentation. Both require attention to detail and the objective to not only find the alleged activity under investigation, but also identify the suspect or suspects behind that activity and convey that information to your audience.
Your case presentation, using analogies and visual aids, will help your audience determine the suspect and place that suspect behind the keyboard. Building the presentation with direct and indirect evidence, shown for what it is, can show the audience that of course the suspect you identified was responsible for the alleged acts, because no one else could have done it.
Bibliography
1. dtSearch <http://www.dtsearch.com>.
2. State of Florida v. Casey Marie Anthony (Ninth Judicial Circuit of Florida,. 2001).
3. Virtual Forensic Computing <http://www.virtualforensiccomputing.com/>.