18
Environmental Aspects of Power Station
Contents
18.1 Environmental aspects
18.2 Global warming and green house effect
18.3 Thermal pollution of water and its control
18.4 Acid precipitation – acid rain and acid snow
18.5 Effluents from power plants and impact on environment
18.6 Environmental impact of power plant: social and economical issues of the power plants
18.1 ENVIRONMENTAL ASPECTS
The design, location, construction and operation of electrical power generation facilities have been affected by environmental concern. Hence, a power engineer must have concern for the environment while producing enough power to meet public demand at low cost. Government has passed environmental legislation that limits the amount of certain solid and gaseous pollutants that can be discharged to the atmosphere. The legislation also limits the amount of thermal energy that can be discharged to natural waters.
Even though power plants are not alone the largest contributors to environmental problems, the growing number of plants is of serious concern about the same.
18.1.1 Constituents of the Atmosphere
Major constituents of atmosphere are nitrogen and oxygen with traces of argon, carbon dioxide and helium. The atmosphere can be subdivided into a clean dry air, water vapour, and aerosols, namely water droplets, as well as ice crystals, salt grains and dust particles, which help in condensation of water.
Table 18.1 gives the composition of the composition of clean dry air in the troposphere (i.e. at altitudes ≤ 16 km). Altogether, N2, O2 and Ar represent 99.96 per cent in volume. The concentration of CO2 at ground level may vary between day and night by up to a factor of two, and all other composition of gases is homogeneous and constant. In addition, there are also traces of SO2, O3, NO and CO.
Table 18.1 Constituents of Atmosphere

Figure 18.1 indicates the four layers of the earth's atmosphere. From the earth's surface, it is the troposphere that ranges from 0 to 8 miles – the next being the stratosphere that ranges from 8 to 30 miles. Next to stratosphere lies the mesosphere that ranges from 30 to 50 miles. The outermost layer is the thermosphere that ranges from 50 to 120 miles.

Fig. 18.1 Layers of Atmosphere
18.1.2 Different Pollutants Due to Thermal Power Plant and Their Effect on Human Health
The most commonly observed pollutants from fossil power plants (oil or coal based) are the following:
- Sulphur oxide (SOx)
- Nitrogen oxides (NOx)
- Carbon oxides (COx)
- Particulate matter or PM
- Thermal pollution
Coal-fired power plants directly emit particulate matter (PM, also called “soot”) in addition to gases that undergo chemical reactions to form fine particles in the atmosphere: SOx and NOx. These emissions of PM in conjunction with SOx and NOx increase the ambient concentration of PM less than 2.5 μm in diameter (PM2.5) over hundreds to thousands of kilometres downwind of the plants. Continuous exposure to PM2.5 may lead to increased mortality from cardiopulmonary diseases, lung cancer [1,2] and numerous other respiratory illnesses and associated morbidity.[3]
Although most modern power plants have some modern pollution controls, such as electrostatic precipitators (ESPs), the use of flue–gas desulfurization (FGD) is relatively rare in the developing countries. FGDs if installed can reduce sulphur dioxide emissions by 90 per cent, resulting in substantial human health risk reductions.
18.1.3 Environmental Control of Different Pollutants Such as Particulate Matter PM
PM comprises smoke, dust and other solids made of a wide variety of organics and metals. Both natural and human activities are responsible for PM in the atmosphere.
Natural causes include natural dust caused by wind, storms, volcanoes and natural fires, meteoritic dust and fog. Fog when combined with smoke forms smog. Human causes include dust and ash emanating from large industries, fossil-based power plants and other combustion processes. Out of these, power plants contribute to about one-third. Sulphur compounds are larger contributors to PM.
Effects
- Decreases visibility, increases soiling and corrosion and affects climatic conditions.
- Causes health hazard, which causes breathing problem with particulate sizes ranging between 2 and 1.25 μm. An individual breathes about 1 mg of particulate matter/day during times of heavy pollution. These particles deposit in the mucous lining and deeper parts of lungs.
- Particulate matter in the atmosphere is highly toxic; it absorbs toxic substances and obstructs respiratory passages. An annual mean of 100–200 μg/m3 results in respiratory illness, whereas 300–600 μg/m3 causes a large increase in the number of patients suffering from bronchitis.
18.1.4 Oxides of Sulphur
Sulphur in the atmosphere exists essentially in the following three forms:
- Sulphur dioxide, SO2 that comes from artificial causes.
- Hydrogen sulphide, H2S that comes from natural sources.
- Various sulphates that come from sea spray and oxidation of SO2.
• Sulphur dioxide
Since it comes from artificial causes, it is of primary concern even though it contributes less than 25 per cent of all sulphur in the atmosphere. It is estimated that more than 90 million tons of sulphur dioxide are discharged to the atmosphere every year.
Effects
Acid rain and acid snow are caused by SO2, hydrogen sulphide, H2S and the oxides of nitrogen, NOx in the atmosphere. These gases carried along wind currents combine with water molecules in the water vapour of the atmosphere, forming tiny drops. These drops mainly contain nitric acid, HNO3 and sulphuric acid, H2SO4. These drops when encountered by snow or rain-producing clouds result in acid rain which:
- Results in lowering of pH values of lakes and streams.
- Results in leaching of essential plant nutrients from soil and reduce nitrogen fixation by microorganism. This makes soil less fertile.
- Dissolve aluminium and cadmium out of soil minerals, allowing them to enter roots and kill trees.
18.1.5 Oxides of Nitrogen
Production of NOx is an endothermic reaction and its concentration is temperature dependent. NOx emissions can be reduced by lowering the combustion temperature and by eliminating hot spots in the furnace. It can also be inhibited by lowering the air–fuel ratio or by employing exhaust gas re-circulation. Lowering the air–fuel ratio restricts the amount of oxygen available for combustion while exhaust gas recirculation reduces the combustion chamber temperature.
18.1.6 Oxides of Carbon
Carbon monoxide, CO, methane, CH4 and carbon dioxide, CO2 are the most widely used contaminants.
Carbon monoxide is caused by natural causes partially, such as marsh gas, coal mines, vegetation and forest fires. This contribution is small when compared to human generated causes. A total of 90 per cent of CO is produced by motor vehicles, whereas power plants contribute less than 1 per cent. The CO additions to the entire earth's atmosphere are about 230 million tons/year.
Effects
- Like NO, it deprives body tissues from oxygen by absorbing haemoglobin.
- A CO concentration of 100 ppm causes headache, 500 ppm causes collapse and 1,000 ppm is fatal.
Carbon dioxide
It is largely contributed by power plants. CO2 added to nature by natural causes such as decay of organic matter contributes more than that by artificial causes. In addition, CO2 contaminates the atmosphere; it is not considered as a pollutant as it is essential for plants.
CO2 can be removed by photosynthesis. This process converts CO2 back into oxygen and organic compounds in the presence of sunlight and water. However, more concentration of CO2 results in green house effect.
18.2 GLOBAL WARMING AND GREEN HOUSE EFFECT
The concentration of CO2 has increased to a level that is beyond the capacity of plant life and the oceans to completely remove it. 50 per cent of CO2 added is retained in the atmosphere. The existence of CO2 in the atmosphere causes green house effect. The atmosphere, analogous to the glass panes of a green house, transmits the radiation from sun. The surface of the sun is about 6,000 K and most of the radiation is in the form of short waves and visible portions of the spectrum, and only a portion of this radiation is absorbed or scattered back to space by the atmosphere. The transmitted radiation is largely absorbed by the surface of earth and thereby warming it.
Part of the resulting heat of the earth is transmitted by conduction, convection, evaporation and reradiated away from the surface. Because of the low surface temperature, this radiation is by infrared portion of the spectrum. The presence of CO2 and H2O in the atmosphere results in the absorption of large portions of infrared radiations (long wave) from the surface and partial of those radiations, back to earth. Thus, atmosphere is not transparent completely to the reradiated energy and traps much of the energy from the sun. Thus, growing levels of concentrations of CO2 increases the surface temperature of the earth. This may result in climatic changes with disastrous consequences, such as melting of polar ice caps, raising the sea level and flooding the coastal areas of the world (Figure 18.2).
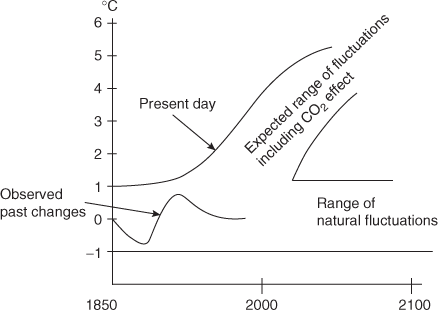
Fig. 18.2 Change in Global Temperature with and without CO2 Effect
To counterbalance the effect of CO2, PM in the atmosphere should be increased. PM helps in reflecting some of incidents from the sun back to space and thus prevents it from reaching the earth's surface.
18.3 THERMAL POLLUTION OF WATER AND ITS CONTROL
The discharge of thermal energy into natural waters is called thermal pollution. The addition of heat to the water reduces the water's ability to hold dissolved gases, including dissolved oxygen that is vital for aquatic life. If the water temperature exceeds 35oC, the dissolved oxygen contents are low to support life. At lower temperature, aquatic growth is enhanced and most plants and fishes grow at a faster rate. During cold weather, warm water discharge from a power plant is an excellent place for fishes.
To compare power generating systems with respect to the amount of thermal energy discharged to the environment, a term known as thermal discharge index (TDI) is introduced. The TDI of any power system is the number of thermal energy units discharged to the environment for each unit of electrical energy produced by the plant, that is
TDI = ![]()
TDI should be as low as possible and preferably non-zero to satisfy second law of thermodynamics.
Let Pth = input thermal energy to power station
Pth ηth = electrical power output of the system
then
TDI = ![]()
= ![]()
= ![]()
In a nuclear reactor, thermal energy discharge is by condenser, using large volumes of water. For gas turbine and IC engine power plants, thermal energy is discharged to the atmosphere. For a fossil-fuelled power system, thermal discharge can be divided into the following three groups:
- Electrical power output, Pe
- Stack power, Ps = Pth (1 − ηb); ηb = boiler efficiency
- Condenser power, Pc
Therefore,
total power Pth = Pe + Ps + Pc
= ηth Pth + (1 − ηb)Pth + Pc
Therefore, Pc = Pth [1 − ηth − (1 − ηb)]
= Pth [ηb − ηth]
18.4 ACID PRECIPITATION – ACID RAIN AND ACID SNOW
The tiny droplets of water in the clouds have the tendency to continuously absorb the suspended solid particles and gases in the atmosphere. The gases of sulphur oxides and nitrogen oxides while coming in contact with water molecules are converted into sulphuric and nitric acids as per the following chemical reactions. The non-metal oxide gases react with water and produce acids.
SO2 + H2O→H2SO3
2 NO2 + H2O → HNO2 + HNO3
When large numbers of such tiny cloud droplets coalesce together, they form a larger water drop that falls in the form of precipitation: acid rain, acid snow, ice, sleet or fog. The pH of acid rain or snow varies from 3.6 to 5, whereas normally accepted pH of rain water is 5.6. Figure 18.3 shows the process of acid rain formation.

Fig. 18.3 The Process of Acid Rain Formation
18.5 EFFLUENTS FROM POWER PLANTS AND IMPACT ON ENVIRONMENT
18.5.1 Radiation from Nuclear Power Plant Effluents
Effects of nuclear radiation
Biological damage by interaction of radiation and tissue:
- Ionization – λ-, β-, γ-radiations ionize tissues into which they penetrate resulting in complete damage of tissue.
- Displacement – atom in the tissue is displaced by neutron and γ-radiation.
- Absorption – absorption of neutron by a tissue nucleus leads to radioactive nucleus, which results in change in chemical nature and mal-functioning of cell. Due to this, cell gets damaged, leading to genetic modification.
Inhalation of radioactive material through air, food and water result in radiation hazard.
18.5.1.1 Handling Nuclear Waste and Safety Measures
Wastes associated with nuclear power are as follows:
- (i) Gaseous effluents
Under normal operation, these are released slowly from the power plants into the biosphere and become diluted and dispersed harmlessly.
- Uranium mine and mill tailings
Tailings are residues from uranium mining and milling operations. They contain low concentration of naturally occurring radioactive materials. They are generated in large volumes and are stored at the mine or mill sites.
- (iii) Low level wastes
Low-level waste (LLW) includes items that have become contaminated with radioactive material or have become radioactive through exposure to neutron radiation. This waste typically consists of contaminated protective shoe covers and clothing, wiping rags, mops, filters, reactor water treatment residues, equipments and tools, luminous dials, medical tubes, swabs, injection needles, syringes, laboratory animal carcasses and tissues, etc. These contain less than 10 nCi per gram of trans-uranium contaminants containing low, but potentially hazardous, concentrations of radioactive materials. These are generated in almost all activities (power generation, medical, industrial, etc.) involving radioactive materials, require little or no shielding. These are disposed of in liquid form by shallow land burial.
- High-level wastes
High-level wastes (HLWs) are generated in reprocessing of spent fuel. They contain all fission products and contain most of the trans-uranium elements not separated during reprocessing. Such wastes are to be disposed off carefully. Since the only way for radioactive waste finally to become harmless is through decay, which for HLWs can take hundreds of thousands of years; the wastes must be stored and finally disposed off in such a way that it provides adequate protection of the public.
- Spent fuel
This is unprocessed spent fuel that is removed from the reactor core after reaching its end-of-life core service. It is removed and then stored for 3–4 months under water in the plant site to give time for the most intense radioactive isotopes to decay before shipment for reprocessing or disposal.
Note: Units of nuclear radiation – Roentgen: amount of radiation that will, on passing through pure air under standard condition, produce 1 electrostatic unit of ions/cm3 of air ⇒ 86.9 ergs of energy absorbed/gm of air, Rem – dose of absorbed radiation that will have the same effect that exposure to 1 Roentgen of γ-radiation will have ⇒ 100 ergs/gm of tissue, total dose driving a person's life time < 200 Rem weekly dose < 0.3 Rem.
Figure 18.4 shows a typical fuel cycle generating these wastes.

Fig. 18.4 A Typical Fuel Cycle
18.5.1.3 Radioactive Waste Disposal
One of the major problems in the nuclear plants is the disposal of waste products that are highly radioactive. They emit large quantities of γ-rays, and these high energy γ-rays destroy all living matter through which they pass.
The radioactive products of 400 MW power station would be equivalent to 100 tons of radium daily, and the radioactive effect of this plant products if exposed to atmosphere would kill all the living organisms within an area about 1002 miles.
The disposal of nuclear waste is the great problem for the engineers and scientists.
In a nuclear fuel cycle, the solid, liquid and gaseous radioactive wastes are produced at different stages. These radioactive wastes must be disposed off in such a manner that these do not cause hazard to human and plant life. Moderate active solid wastes are buried in the ground. Moderate liquid wastes after preliminary treatments are discharged in deep pits or day well from which they sweep out into the surrounding ground. Active liquids are kept in concrete tanks, and these tanks are buried in the ground until their decay of radioactivity. Many times, the radio activity increases the temperature of the liquid waste or sometimes these liquids boil and the activity decreases with time. Gaseous wastes are discharged to atmosphere through high stacks if the wind permits.
The waste is disposed to air, ground and ocean.
(a) Air
There are lots of problems in disposing radioactive gases in to the air. Because strong radioactive gases such as strontium and iodine are absorbed by the plants and they enter in to the human body through food. Cesium is absorbed in muscle and strontium in bones and paralyses the health. Generally, radioactive gases are collected and stored in a tank buried in the ground and disposed off to the atmosphere when activity level is sufficiently low.
The amount of radioactivity presently disposed to the air is well below the harmful level, but the problem will get serious when large number of power reactors will come up in operation.
(b) Ground
This is one of the easy and cheapest methods of disposal because soil absorbs radioactive material easily. This disposal is suitable mostly in areas of low rainfall at points that are high above the ground water level.
Most of the radio activeness of waste is removed just by storage. The storage problem is simplified by separating cesium and strontium that are extremely radioactive. These are generally stored in tanks that are buried in ground and then disposed in to the sea after 13 years of storage.
Vacated coal mines are used for waste disposal. The wastes are disposed in the salt heaps provided in the mines, because salt is a powerful absorber of radioactive emissions. It is the easy and more economical method of disposing off liquid waste by freezing.
18.5.2 Pollution Standards
As per the Environment (Protection) Rules, 1986 of the Government of India, with regard to PM emissions, the following standards should be adhered to by the thermal power plants (Table 18.2).
Table 18.2 Government of India Standard for PM Emissions

As per the study conducted by Green Peace India, India does not impose technology-based control for SO2 and NOx, and India's ambient air quality standards have not been used to impose such controls. With unregulated pollutants such as SO2 and NOx, emission rates can vary widely depending on the sulphur and nitrogen content of the coal being used and the operating temperature of the boiler. Table 18.3 extract from Green Peace India4 shows technology-based pollution limits for several countries.
Table 18.3 Technology-Based Pollution Limits for Selected Countries
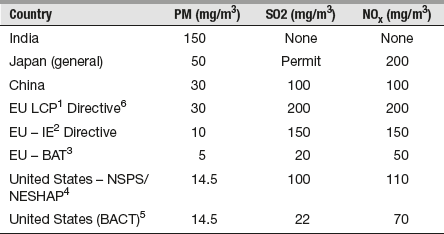
Note: 1Large Combustion Plant; 2Industrial Emissions; 3Best Available Technique; 4New Source Performance Standards; 5Best Available Control Technology.
Table 18.4 gives the National Ambient Air Quality Standards as prescribed by the Central Pollution Control Board of India, under section 16 (2) (h) of the Air (Prevention and Control of Pollution) Act, 1981 (14 of 1981).
Table 18.4 The National Ambient Air Quality Standards

*Annual arithmetic mean of minimum 104 measurements in a year taken twice a week 24 hourly at uniform interval.
**24 hourly/8 hourly values should be met 98 per cent of the time in a year. However, 2 per cent of the time, it may exceed but not on two consecutive days.
18.5.3 Methods of Pollution Control
With stringent air quality restriction by the governments, majority of the power plants in the world use ESPs for dust removal and FGD technology for sulphur removal. An ESP can handle large volumes of flue gases accompanied low pressure drop and high collection efficiency (99.5%). It facilitates easy removal of dust particles.
18.5.3.1 Electrostatic Precipitator
Figure 18.5 shows a general arrangement of an ESP. It consists of two sets of electrodes the emitting or discharging electrode and collecting electrode. In the case of a tubular-type precipitator emitting electrodes are placed in the centre of the pipe; whereas in the case of plate-type precipitator, emitting electrodes are placed midway between the two plates. The emitting electrodes are connected to negative polarity of high voltage (20–100 kV) DC source. The collecting electrodes are connected to the positive polarity of the source and earthed.

Fig. 18.5 A General Arrangement of an ESP
When high voltage is applied, it generates a unidirectional non-uniform electric field having greater magnitude at the discharge electrodes. This results in a blue luminous glow, called a corona around them. This corona is an indication of negatively charged ionized gas molecules that travel from discharge electrodes to grounded collection electrodes. The dust particles thus get deposited on the collector electrodes and lose their charge. Remaining dust particles cling to the electrode surface due to electrical resistivity, are removed by rapping the electrodes using rapping motors. The detailed working principle of an ESP is already explained in chapter Section 3.12.2.
18.5.3.2 FGD Technology
FGD is a technology that extracts sulphur dioxides from flue gases produced in coal-based thermal power plants, where sulphur content in coal is more than 0.5 per cent. The coal produced from Indian mines contains only 0.4 per cent sulphur contents; therefore in India, this technology was not required much. Now, a lot of companies in India are importing coal from other countries such as Indonesia, South Africa, which contains sulphur contents 0.6–0.9 per cent. Therefore, it is made mandatory to install the FGD plant to maintain the ambient air quality standards.
Sulphur dioxide is extracted from flue gases in wet scrubber, slurry of alkaline sorbent; lime stone reacts with the sulphur dioxide. More than 90 per cent of the limestone particles in the limestone powder (85% purity) are made to pass through a screen (325 mesh) to ensure that maximum amount of limestone particles comes in contact with the sulphur dioxide molecules in the flue gas.
To have a chemical reaction, the limestone powder is mixed into 15–30 per cent slurry introduced into the FGD vessel, re-circulated, and sprayed into the flue gas stream. The following chemical reactions happen in the FGD system:
- Flue gases containing SO2 enter the absorber and come in contact with limestone slurry (CaCO3) in the wet scrubber producing calcium sulphite.
CaCO3 + SO2 → CaSO3 + CO2
- Further, Ca(OH)2 in lime, when combined with SO2 gas produces calcium sulphite and water
Ca (OH) 2 + SO2 → CaSO3 + H2O
- Calcium sulphite is further oxidized by forced oxidation utilizing blowers to produce marketable CaSO4 2H2O, popularly known as gypsum.
CaSO3 + H2O + ½O2 → CaSO4.2H2O
18.5.3.3 Handling Fly Ash and Bottom Ash of a Thermal Power Plant
With pulverized coal, all the ash particles are formed in suspension and tend to remain in suspension in the furnace. In slag-type furnace, a portion of ash (20–30%) is drained to the furnace bottom in a molten state. The portion of ash that tends to escape towards the stack is called flyash and a portion that is collected at the bottom of the furnace and is removed either in dry or wet state is called bottom ash.
A 500 MW power plant boiler consumes 300 tons of coal per hour and produces 120 tons of total ash per hour in India. Out of this, 20 per cent (24 tons/hr) comes out in the form of clinkers and remaining 80 per cent (96 tons/hr) is carried in the gas stream and is collected in hoppers beneath economizer, air preheater, mechanical collector and electronic precipitator. The chemical composition of ash varies as per the source of coal and its origin.
The broad composition of ash is given below in Table 18.5:
Table 18.5 Composition of Ash

Uses of ash and dust
Coal source, quality, degree of grinding, combustion characteristics and boiler design are some of the factors that affect chemical and physical quality of the ash and its potential use. Combustion conditions as percentage of air and furnace temperature are important for the ash quality as they influence the degree of oxidation of the metals. Ash quality is also affected by the use of additives to control boiler corrosion or to aid in collecting ash in ESP.
Ash is widely used in the production of cement. Fly ash is pozzolanic and develops self-hardening characteristics. Concrete made of ash can yield improved workability and strength greater than all cement-based concrete. The pozzolanic quality of ash–lime mixture creates a healing of cracks in the pavement themselves.
Due to their better alkali values, they are used for treating acidic soils. Its use for agricultural purposes is recently experimented in Japan, and it is found that it supplies essential nutrients as sulphur, boron, calcium and zinc. It also adjusts pH to optimum levels for plant growth. It is also found that if the ash in used in limited quantity in soil, it increases the yield of corn, turnip, white clover and asfalfa.
The use of ash in the production of concrete is technically established. 20 per cent of fly ash and 30 per cent bottom ash are presently used constructively in the United States.
Utilization of fly ash
The disposal of ash using low-grade coal (30–50% ash content) in thermal power plants in India has created lot of problems as large land area and huge quantity of water are required for the same. The fly ash generation 1998 was around 60 million tons per year from 75 coal-fired thermal plants that had increased to 90 million tons per year by 2,000 and 110 million tons in 2010.
About 20 per cent of coal ash in the coal is converted into bottom ash and 80 per cent fly ash. India has a current annual generation of approximately 112 million tons (2011 data) and its proven suitability for variety of applications as admixture in cement/concrete/mortar, lime pozzolana mixture (bricks/blocks), etc. Cement and concrete industry accounts for 50 per cent fly ash utilization; the total utilization of which at present stands at 30MT (28%). The other areas of application are low-lying area fill (17%), roads and embankments (15%), dyke raising (4%) and brick manufacturing (2%); other new areas for safe disposal of fly ash is in paint industry, agriculture, etc.[4] Government of India is not fully prepared to appreciate the magnitude of the fly ash problem. Disposal of fly ash is extremely water- and land-intensive, leading to diversion of fertile land and unsustainable water usage. It also causes displacement of people since large tracts of land are acquired for fly ash disposal, besides leading to air, water and soil contamination. Disposal of fly ash is equally costly as 2 per cent of the cost of the plant goes into disposal of fly ash from the site of generation to the disposal site. It addition to this, the water required to remove and transport the fly ash in the form of slurry is considerably high. Approximately 1 m3/hr is required per MW generating capacity.
Fly ash can be used for making a variety of building products as discussed below.[5]
- Mixing with cement: 10–25 per cent dry fly ash can be used as during manufacture of cement or blended with finished portland cement to produce portland pozzolana cement whose strength is higher. The major drawback of this cement is its high cost, and it requires more setting time.
- Sintered light-weight aggregates: This is produced by pelletization or nodulization of fly ash and sintering them at 1,000–1,300°C. Unburnt fuel in the fly ash modules supports ignition. Sintered weight aggregate substitutes chips in concrete reducing dead weight. The process know-how developed by CBRI, Roorkee has yet to go in for commercial production.
- Fly ash–stone powder–cement bricks: These types of bricks are manufactured by mixing weighted fly ash, cement and stone powder in a mixture and moulded and pressed in brick making machine. The compacted bricks are water cured for 28 days. The compressive strength of these bricks varies from 70 to 110 bar depending on the cement content.
CFRI-Dhanbad has developed a process to manufacture bricks using dry fly ash. This process is chemically bounded. The brick material contains 83 per cent fly ash, 10 per cent sand, 7 per cent limestone and 0.2 per cent accelerator. The mixture of the above constituents is subjected to formation as per required shape in the mould and then naturally cured for 2–3 days. These bricks are then steam cured at 2–5 bar pressure for giving the strength. The brick can bear 125 bar compressive load.
- Cast-in-situ fly ash walls: Using high fly ash mix comprising of cement, lime fly ash and sand in appropriate proportions depending on the quality of fly ash with pre-measured water cement ratio, cast-in-situ can be built. These can be cast to any thickness using steel shuttering. By using this system, we can achieve 20 per cent economy, quicker construction, good finish on both sides of wall and more carpet area.
- Cellular light-weight concrete: This can be manufactured by a process involving the mixing of fly ash, cement, coarses and fines and a foaming agent. The slurry formed is poured in moulds and allowed to set. The blocks are then removed and are cured by spraying water on the stack. The bulk density of the products varies from 400 to 1,800 kg/m3 against ordinary brick bulk density of 1,600–1,920 kg/m3. The blocks are especially useful in high rise construction reducing the dead weight of the structure. DLF Universal Ltd., New Delhi, is using these blocks in their construction projects for the last 8 years. In agriculture: It improves permeability status 1, fertility status (soil health)/crop yield of soil and soil texture.
Fly ash reduces bulk density of soil, improves water holding capacity/porosity and optimizes pH value and soil aeration. It provides micro-nutrients such as Fe, Zn, Cu, Mo, B, Mn, etc., and macro-nutrients such as K, P, Ca, Mg, S, etc.[4] It is reported that the agricultural increase of grains is around 15 per cent, green vegetables 35 per cent and root vegetables 50 per cent, when fly ash is mixed with soil.[5]
18.6 ENVIRONMENTAL IMPACT OF POWER PLANT: SOCIAL AND ECONOMICAL ISSUES OF THE POWER PLANTS
A power plant can affect the environment by its construction and its operation with could be either temporary or permanent. Some of the environmental impacts of power plant with strong connection to social and economic issues could be as follows.
18.6.1 Land and Air Space
- A power plant and its auxiliary components such as natural gas pipelines, water lines coal-handling and storage systems, transmission lines and waste disposal sites occupy considerable space on the ground and in the air, emitting pollutants into the ground and air. This may eliminate opportunities for others to purchase or use the land. It may also affect the existing or future uses of adjoining and nearby land parcels.
- The plant's height viz. tall buildings, chimney and towers may result in safety concerns for aircraft or visual impacts for local landowners.
- If the land to be used for the power plant is agri-based, growing mostly vegetation (crops, pasture, or old-field vegetation), a power plant could pose serious threat on land use, soils and wildlife.
18.6.2 Water
Fossil fuel-fired and biomass-fired plants burn fuels to generate power. The burning of fuel creates exhaust gases and other by-products, including air pollutants. In addition, large amount of cooling water requirements in these plants is met from nearby rivers or lakes, or from local underground water. The effluents and used water discharged back to land or river, the concentration of pollutants in the water and ground are bound to increase.
18.6.3 Solid Waste
Power plants produce a variety of solid wastes such as ash in thermal plants spent nuclear fuel rods and low-level radioactive wastes in nuclear plants. The filtered solids from the effluent treatment plants are a by-product that must be disposed appropriately.
18.6.4 Construction and Operation
Construction and operation of a power plant can have unsettling effects on the community in which the power plant is built. Construction of the power plant could create nuisance to the surrounding landowners and other citizens. This in turn may affect community aesthetics or business. Costs for community services such as police, fire protection, emergency medical service, schools, hospitals and traffic control can increase. Additional demand requirements might be placed on the municipal water supply or wastewater treatment capacity, or on solid-waste management systems.
Construction of new transportation facilities such as rail, road or barge may make road or rail traffic complicated or burdened by delivery of materials, particularly large items.
Water and natural gas are transported by using pipelines that often require the digging of trenches that may impact residential yards, roads, farm fields, forest or agriculture lands.
18.6.5 Noise
Noise and vibration levels in neighbourhoods might increase during construction and power plant operation. The cooling towers of an operating power plant can also create fog and rime ice. Air space issues and compatibility with local land use must be considered in the light of the space the power plant occupies and the way in which it operates.
18.6.6 Economical Aspects
The commissioning of power plants can create positive effects on the community such as employment for local residents and purchases of locally produced goods and services creating additional income to the localities. Local tax revenue or state shared revenue for the local governing bodies such as municipalities would also increase.
The electricity produced by the plant could be utilized for more reliable power supply to the local residents by stabilized the local electric transmission grid.
18.7 QUESTIONS
18.7.1 Objective Questions
- As per the government of India, regulations limitation of particulate material in thermal power plants below 210 MW generating capacity is
- 350 mg/normal m3
- 150 mg/normal m3
- 250 mg/normal m3
- 100 mg/normal m3
- As per the government of India, regulations limitation of particulate material in thermal power plants more than 210 MW generating capacity is
- 350 mg/normal m3
- 150 mg/normal m3
- 250 mg/normal m3
- 100 mg/normal m3
- Percentage by volume of nitrogen in the atmosphere is
- 78
- 21
- 2
- 0.93
- Percentage by volume of oxygen in the atmosphere is
- 78
- 21
- 2
- 0.93
- Percentage by volume of argon in the atmosphere is
- 78
- 21
- 2
- 0.93
- Layers of atmosphere in correct sequence from earth's surface is
- Troposphere, stratosphere, mesosphere, thermosphere
- Stratosphere, mesosphere, thermosphere, troposphere
- Mesosphere, stratosphere, thermosphere, troposphere
- Thermosphere stratosphere, mesosphere, troposphere
Answers
- b 2. a 3. a 4. b 5. d 6. a
18.7.2 Review Questions
- Discuss the environmental aspects of power generation.
- What are the constituents of the atmosphere? Mention different pollutants due to thermal power plant and their effect on human health.
- Explain environmental control of different pollutants such as particulate matter.
- Write short notes on the following and mention their contribution in pollution:
- Oxides of sulphur
- Oxides of nitrogen
- Oxides of carbon
- Explain global warming and green house effect.
- Define thermal pollution of water and its control.
- Explain how acid precipitation is responsible for acid rain and acid snow.
- What are the effluents from power plants, and how do they impact the environment?
- Discuss the contribution of radiation from nuclear power plant effluents.
- 10. What is the environmental impact of power plant in relation to social and economical issues?
18.7.3 References
- Cohen, A. J.; et al., “The global burden of disease due to outdoor air pollution,” J Toxicol Environ Health A., 2005, Jul-9-23; 68(13–14); 1301–7.
- Pope, C. A.; et al. Lung cancer, cardiopulmonary mortality, and long-term exposure to fine particulate air pollution. Journal of the American Medical Association. 287(9), 1132–1141, 2002.
- Pope, C. A.; Epidemiology of fine particulate air pollution and human health: biologic mechanisms and who's at risk? Environmental Health Perspectives. 108(suppl. 4), 713–723, 2000.
- Alam1, J.; and Akhtar, M. N.; “Fly ash utilization in different sectors in Indian scenario” International Journal of Emerging Trends in Engineering and Development. 1(1), August, 2011.
- “Building Materials in India: 50 Years – A commemorative volume” Mohan Rai BMTPC, Ministry of Urban Affairs and Employment, Govt. of India, 1998-Technology and Engineering.