© Carlos Oliveira 2021
C. OliveiraPractical C++20 Financial Programminghttps://doi.org/10.1007/978-1-4842-6834-6_6

6. Plotting Financial Data

Carlos Oliveira1  
(1)
Seattle, WA, USA
 

A very common activity in financial programming is the generation of price-related data that needs to be visualized by traders or other business stakeholders. Most of the time, the data is expected to be plotted in the form of a chart for easy visualization. Visualization strategies for financial data range from simple line charts for daily prices to complex graphical output using candles, superposed studies, and other less conventional notation.

In this chapter, you will see a number of coding examples for creating and displaying charts based on prices and related quantitative data analysis. You will learn how to perform such tasks using a few different techniques, including external software such as Gnuplot as well as graphical C++ libraries such as Qt. Both techniques may be useful in different situations, as they have their own advantages and disadvantages.

The following are a few things you will learn in this chapter:
  • How to create a class that provides a plotting interface

  • How to use external plotting applications such as Gnuplot

  • How to convert your data to a format that can be understood by external programs

  • How to plot csv (comma-separated values) files on UNIX and Windows

  • How to generate commands to control the open source Gnuplot application

  • How to create a plot using an open source and multiplatform graphical user interface (GUI) library

  • How to use Qt to generate a basic plotting window

Plotting with Gnuplot

Create a price chart using Gnuplot.

Solution

Gnuplot is a very popular software package used to create charts based on mathematical functions and data points. You can use Gnuplot in a stand-alone fashion or as an embedded viewer for graphs created by other applications. In this section, you will learn how to generate files that can be easily visualized using Gnuplot.

The first step in using Gnuplot is to make sure that it is properly installed in your system. You can easily install this package for data visualization by visiting its website (www.gnuplot.info) and downloading the required files. There are binary installation files available for most operating systems, including Windows, Mac OS X, and Linux. Run the installer and execute the main application. You should see something similar to the screen displayed in Figure 6-1.
../images/323908_2_En_6_Chapter/323908_2_En_6_Fig1_HTML.jpg
Figure 6-1

Gnuplot main application running on Windows

The basic application is composed of a simple shell where you can type some of the commands Gnuplot recognizes. The most basic of such commands is plot , which allows you to display plots on the screen. For example, you can easily create a plot for a mathematical function, such as sine or cosine. The command necessary for this can be typed at the main prompt of the application.
>  plot sin(x)
You can see the results for this simple function plot in Figure 6-2.
../images/323908_2_En_6_Chapter/323908_2_En_6_Fig2_HTML.jpg
Figure 6-2

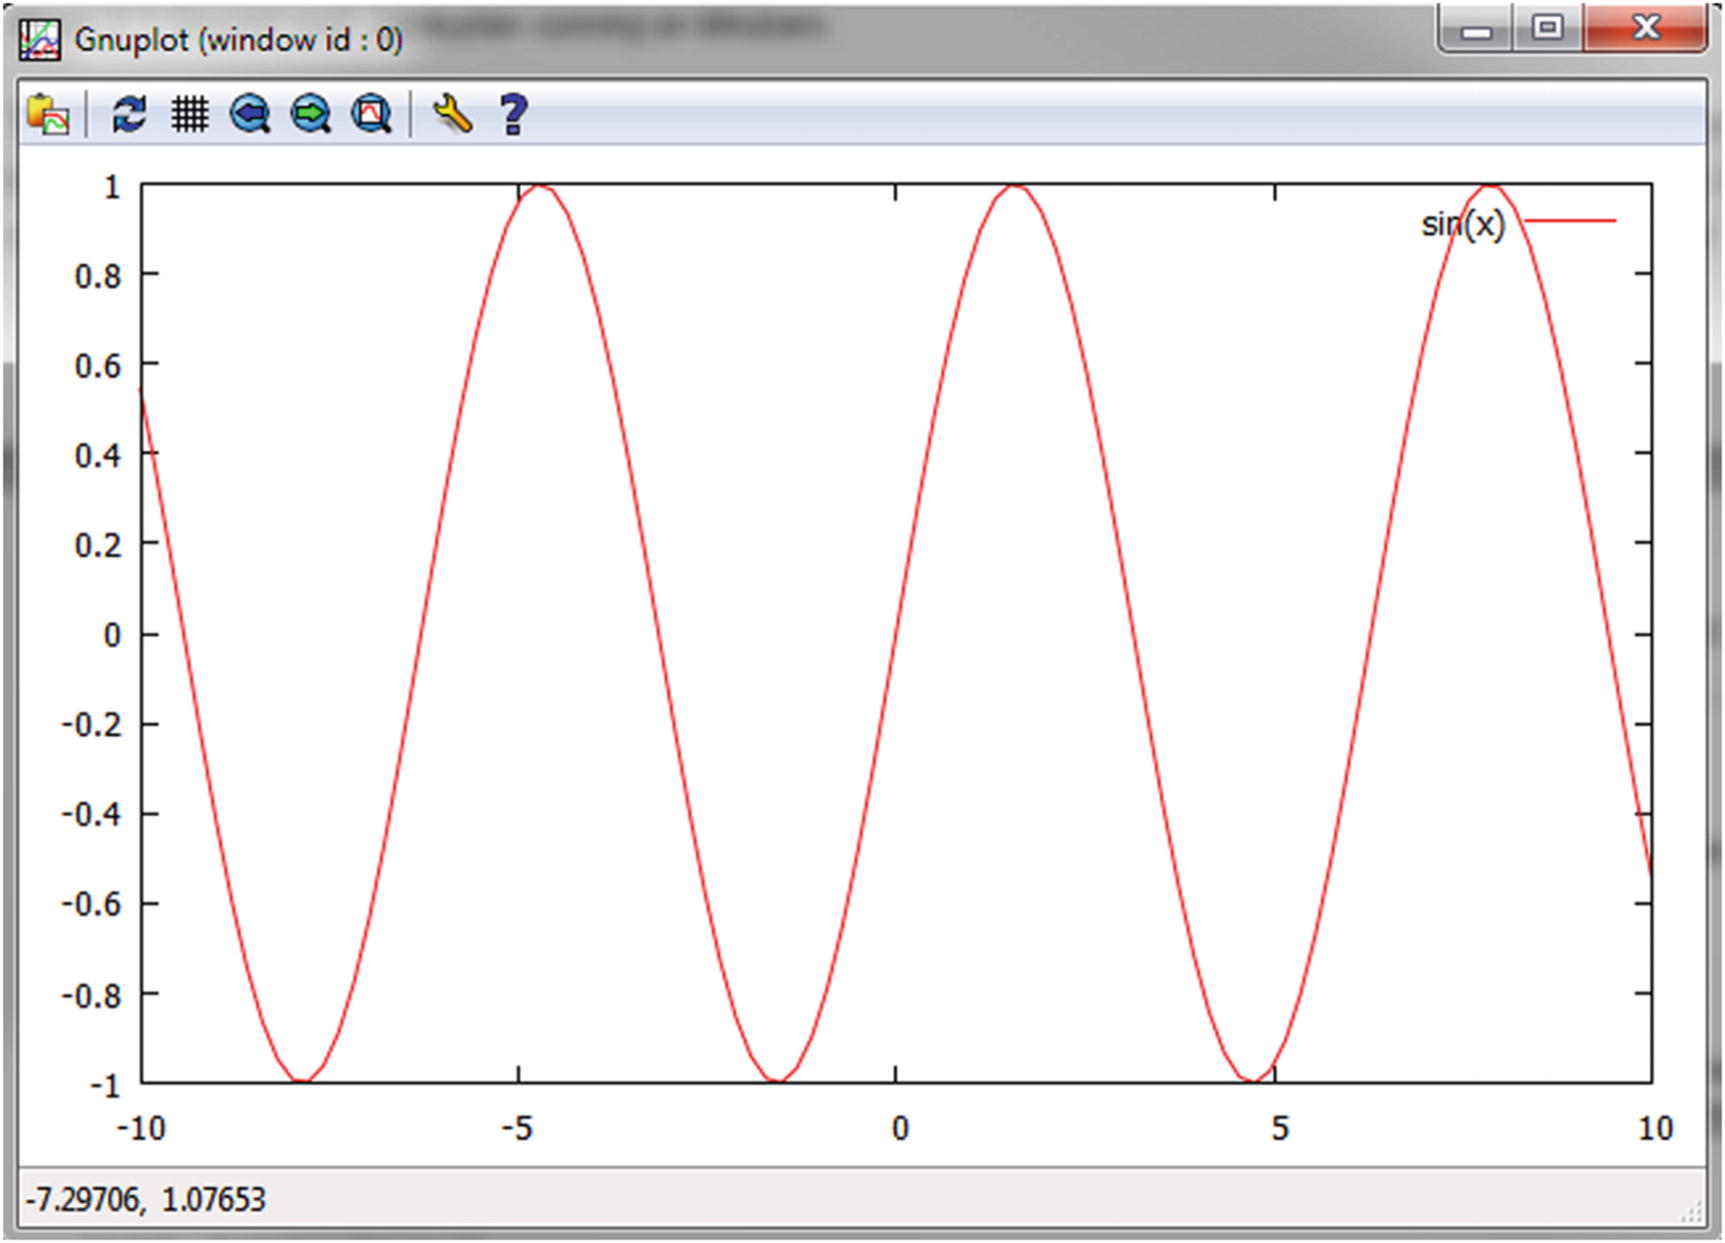
Plot of the mathematical function sin(x) using Gnuplot

In this plot, you supplied the mathematical function defined by sin(x) , and Gnuplot is responsible for creating a plot of the values, where the default range is from -10 to 10. You can easily tweak the parameters used to determine the range, as well as other attributes of the plot such as the title, the legend, and the units used in both axes.

Another way to use Gnuplot is to directly plot numeric data, instead of a mathematical function. This is possible by referencing the name of the files that should be imported by the plot command. Most data imported in this way is in the csv (comma-separated values) format, although Gnuplot doesn’t mandate that the number be in csv—any file with numeric data organized as columns will do.

Consider the following data as an example. These are prices for IBM downloaded from Yahoo! Finance.
Date,Open,High,Low,Close,Volume,Adj Close
2014-07-01,181.7,187.27,181.7,186.35,6643100,186.35
2014-06-30,181.33,181.93,180.26,181.27,4223800,181.27
2014-06-27,179.77,182.46,179.66,181.71,4575500,181.71
2014-06-26,180.87,181.37,179.27,180.37,3258500,180.37
2014-06-25,180.25,180.97,180.06,180.72,2762800,180.72
2014-06-24,181.5,183,180.65,180.88,3875400,180.88
2014-06-23,181.92,182.25,181,182.14,3231700,182.14
2014-06-20,182.59,182.67,181.4,181.55,10686800,181.55
2014-06-19,184.12,184.47,182.36,182.82,3551100,182.82
2014-06-18,182.04,183.61,181.79,183.6,3931800,183.6
2014-06-17,181.9,182.81,181.56,182.26,2445400,182.26
2014-06-16,182.4,182.71,181.24,182.35,3538700,182.35
2014-06-13,182,183,181.52,182.56,2773600,182.56
2014-06-12,182.48,182.55,180.91,181.22,4425300,181.22
2014-06-11,183.61,184.2,182.01,182.25,4061700,182.25
2014-06-10,186.2,186.22,183.82,184.29,4154900,184.29
2014-06-09,186.22,187.64,185.96,186.22,2728400,186.22
I am displaying here only the few first lines of the file that contains daily stock prices. You can save this data in the file IBM.csv and use it as the source for a price plot employing Gnuplot with the following commands :
gnuplot> set xdata time
gnuplot> set datafile separator ","
gnuplot> set timefmt "%Y-%m-%d"
gnuplot> plot 'IBM.csv'  using 1:7  title columnhead with lines
Note

When running the previous commands, make sure that you’re in the same directory in which you have saved the data file (IBM.csv). Another way to do this is to use the full path for the file, for example, "c:\testdata\IBM.csv" (escaped path separators are needed in the Windows platform).

The first command is used to tell Gnuplot that the data in the x axis is time-oriented. The second command defines the separator used in the file. The third command describes the date format stored in the csv file. Finally, the last line tells Gnuplot to plot the contents of file IBM.csv , using columns 1 and 7 (column 1 contains dates, while column 7 has adjusted closing prices), and with the title of the time series defined by the headers for each column of the csv file.

These commands will generate the plot displayed in Figure 6-3.
../images/323908_2_En_6_Chapter/323908_2_En_6_Fig3_HTML.jpg
Figure 6-3

Plot of the adjusted prices for IBM stock, stored in a csv file using Gnuplot

The plot in Figure 6-3 is just a sample of what Gnuplot can do. There are literally hundreds of parameters that can be tweaked using the set command . Among these options, you can find three-dimensional plots, different colors, and line styles, among others.

To solve the problem presented in this section, you need to create a class that receives some data in the form of vectors of doubles or strings and produces output data suitable for consumption by Gnuplot. I have created such a class, which is called GnuplotPlotter and is responsible for the generation of the files needed by Gnuplot.

The operation of the class depends on the determination of data for the x axis as well as for the y axis. The class is created using a constructor that takes the output filename as a parameter. To define the data that will be used in the plot, use the setData member function. The parameters must be vectors for data in the x dimension and y dimension, respectively. The following is a summary of the class:
class GnuplotPlotter {
public:
    GnuplotPlotter(const std::string &fileName);
    GnuplotPlotter(const GnuplotPlotter &p);
    ~GnuplotPlotter();
    GnuplotPlotter &operator=(const GnuplotPlotter &p);
    void generateCmds(const std::string &cmdFileName);
    void setHeaders(const std::string &xheader, const std::string &yheader);
    void setData(const std::vector<double> &xdata, const std::vector<double> &ydata);
    void setData(const std::vector<std::string> &xdata, const std::vector<double> &ydata);
    void csvWrite();
    // private variables here.
};

To access the results of the class, two member functions are available. The csvWrite member function will write the data stored in GnuplotPlotter to the file specified in the constructor, using the csv format. The second member function is generateCmds , which allows one to create a command file with the necessary instructions to Gnuplot. This way, you don’t need to worry about the exact syntax for plotting the file. The commands are stored in a filename specified by the parameter cmdFileName .

An example for the GnuplotPlotter class is given in the main function. First, you need to define two vectors with the desired data. In this case, you will use data generated by the function sin, which returns the trigonometric sine of a number. Notice that we do this only to simplify data testing. The data file, however, can have numbers generated from any source. After the content has been defined, you can call the member functions csvWrite and generateCmds to create the files needed by Gnuplot. You can see the result of this process in Figure 6-4.
../images/323908_2_En_6_Chapter/323908_2_En_6_Fig4_HTML.jpg
Figure 6-4

Plot generated using the test data created in GnuplotPlotter.cpp

Complete Code

The code to generate plots and Gnuplot commands has been implemented in the class GnuplotPlotter . You can add this class to your project and access the same member functions to generate data plots (see Listing 6-1).
//
//  GnuplotPlotter.h
#ifndef __FinancialSamples__GnuplotPlotter__
#define __FinancialSamples__GnuplotPlotter__
#include <vector>
#include <string>
class GnuplotPlotter {
public:
    GnuplotPlotter(const std::string &fileName);
    GnuplotPlotter(const GnuplotPlotter &p);
    ~GnuplotPlotter();
    GnuplotPlotter &operator=(const GnuplotPlotter &p);
    void generateCmds(const std::string &cmdFileName);
    void setHeaders(const std::string &xheader, const std::string &yheader);
    void setData(const std::vector<double> &xdata, const std::vector<double> &ydata);
    void setData(const std::vector<std::string> &xdata, const std::vector<double> &ydata);
    void csvWrite();
private:
    std::string m_fileName;
    std::string m_xheader;
    std::string m_yheader;
    std::vector<std::string> m_xdata;
    std::vector<double> m_ydata;
    bool m_isDate;
};
#endif /* defined(__FinancialSamples__GnuplotPlotter__) */
//
//  GnuplotPlotter.cpp
#include "GnuplotPlotter.h"
#include <fstream>
#include <iostream>
#include <sstream>
#include <cmath>
using std::ofstream;
using std::vector;
using std::cout;
GnuplotPlotter::GnuplotPlotter(const std::string &fileName)
: m_fileName(fileName),
  m_isDate(false)
{
}
GnuplotPlotter::GnuplotPlotter(const GnuplotPlotter &p)
: m_fileName(p.m_fileName),
  m_xheader(p.m_xheader),
  m_yheader(p.m_yheader),
  m_xdata(p.m_xdata),
  m_ydata(p.m_ydata),
  m_isDate(p.m_isDate)
{
}
GnuplotPlotter::~GnuplotPlotter()
{
}
GnuplotPlotter &GnuplotPlotter::operator=(const GnuplotPlotter &p)
{
        if (&p != this)
        {
                m_fileName = p.m_fileName;
                m_xheader = p.m_xheader;
                m_yheader = p.m_yheader;
                m_xdata = p.m_xdata;
                m_ydata = p.m_ydata;
                m_isDate = p.m_isDate;
        }
    return *this;
}
void GnuplotPlotter::setData(const std::vector<std::string> &xdata,
                             const std::vector<double> &ydata)
{
        m_xdata = xdata;
        m_ydata = ydata;
        m_isDate = true; // assume that x-axis is a date
}
void GnuplotPlotter::setData(const std::vector<double> &xdata, const std::vector<double> &ydata)
{
        for (unsigned i = 0; i < xdata.size(); ++i)
        {
                std::stringstream ss;
                ss << xdata[i];
                m_xdata.push_back(ss.str());
        }
        m_ydata = ydata;
        m_isDate = false; // x-axis cannot be a date.
}
void GnuplotPlotter::setHeaders(const std::string &xheader, const std::string &yheader)
{
        m_xheader = xheader;
        m_yheader = yheader;
}
void GnuplotPlotter::generateCmds(const std::string &cmdFileName)
{
        ofstream file;
        file.open(cmdFileName.c_str());
        if (file.fail())
        {
                cout << "failed to open file " << m_fileName << endl;
                return;
        }
        if (m_isDate)
        {
                file << "set xdata time"  << endl;
                file << "set timefmt "%Y-%m-%d" "  << endl;
        }
        file << "set datafile separator "," "  << endl;
        file << "plot '" << m_fileName <<  "'  u 1:7  title columnhead w lines " << endl;
        file << "pause -1" << endl;
}
void GnuplotPlotter::csvWrite()
{
        ofstream file;
        file.open(m_fileName.c_str());
        if (file.fail())
        {
                cout << "failed to open file " << m_fileName << endl;
                return;
        }
        if (m_xdata.size() != m_ydata.size())
        {
                cout << "data has incorrect size " << endl;
                return;
        }
        file << m_xheader << "," << m_yheader << endl;
        for (unsigned i = 0; i < m_xdata.size(); ++i)
        {
                file << m_xdata[i] << "," << m_ydata[i] << endl;
        }
}
int main()
{
    GnuplotPlotter plotter("test.csv");
    plotter.setHeaders("x", "sin(x)");
    vector<double> xdata;
    vector<double> ydata;
    for (int i=0; i<100; ++i)
    {
        double x = i*10/100.0;
        xdata.push_back(x);
        ydata.push_back(sin(x));
    }
    plotter.setData(xdata, ydata);
    plotter.csvWrite();
    plotter.generateCmds("testcmds.gp");
    return 0;
}
Listing 6-1

GnuplotPlotter.h and GnuplotPlotter.cpp

Running the Code

The code in Listing 6-1 can be compiled using the free gcc compiler. The solution was tested on the Mac OS X and Windows platforms. You can, for example, create an application using the following command :
gcc –o gnuplotter gnuplotplotter.cpp
Then, you can run the program using the command line
./gnuplotter
This will generate two files, test.csv and testcmds.gp, which Gnuplot will use to generate the desired plot. You can run Gnuplot on UNIX as follows:
cat testcmds.gp | gnuplot
In the Windows platform, you can load the commands file into the Gnuplot application in the following way:
c:>  gnuplot
>  load "testcmds.gp"

The plot will be displayed in a separate window, as shown in Figure 6-4.

Plotting Data from a GUI

Create an application that can plot data using the GUI.

Solution

Although it is great to have the ability to create charts with external packages such as Gnuplot, sometimes it is necessary to have a larger degree of control over the output generated by plots. If you cannot find a way to use one of the parameters in Gnuplot to get the desired results, it becomes necessary to implement a plotting solution that runs in C++. This section shows how to achieve this.

There are many graphical libraries available for C++ developers, and the final decision depends mostly on your target environment. However, in this section, I use the Qt library to implement the desired solution.

Qt is probably the easiest to use graphical programming package around. You will see that with just a dozen lines, we are able to create a complete application. Moreover, Qt is available for all major operating systems, so that your application can be easily ported to other targets as necessary.

The class used is called QtPlotter , and it receives data using the setData member function, just as we did with the GnuplotPlotter. The main part of the implementation, however, is performed in the PlotWindow class , which is derived from QMainWindow , one of the key classes in the Qt framework. The PlotWindow class is responsible for managing the window and, most important, painting the plot when necessary.

The plotting functionality is implemented in the paintEvent member function. This member function is invoked whenever the window needs to paint itself. First, it paints the x and y axis and calculates the size of a unit on each axis, storing that information in variables called unitX and unitY . To draw the axis, the paintEvent member function uses the painter object, which is provided by Qt. The drawLine member function is the simplest way to draw line between the given coordinates, as shown in the following code:
// define margins
double marginX = 10;
double marginY = 10;
double lengthX = 500;
double lengthY = 400;
// define axis
int maxX = lengthX, maxY = lengthY;
painter.drawLine(marginX,marginY, marginX, lengthY+marginY);
painter.drawLine(marginX,lengthY + marginY, lengthX, lengthY + marginY);

In the next step, the function paintEvent draws the tick markers along the axis. Finally, the code paints lines between the points given as input to the plot.

The last part of the implementation is encapsulated in the plotWindowRun member function, which is part of the QtPlotter class , as follows:
int QtPlotter::plotWindowRun()
{
    char *arg = (char *)"plotter";
    int argc = 1;
    QApplication app(argc, &arg);
    app.setApplicationName("Qt Plotter");
    PlotWindow window;
    window.resize(600, 600);
    window.show();
    return app.exec();
}

This code does most of what is necessary to create a Qt application and display a window on the screen. The window created is the PlotWindow class that we discussed previously, so that the plot is displayed as desired. The QApplication object is part of the Qt framework. It manages the workflow of a graphical application, including menus and windows. When creating a QApplication, we are able to determine the application name with the setApplicationName member function. Finally, we resize and show the plot window and call the exec member function to start the window display loop.

Figure 6-5 shows the results of this code.
../images/323908_2_En_6_Chapter/323908_2_En_6_Fig5_HTML.jpg
Figure 6-5

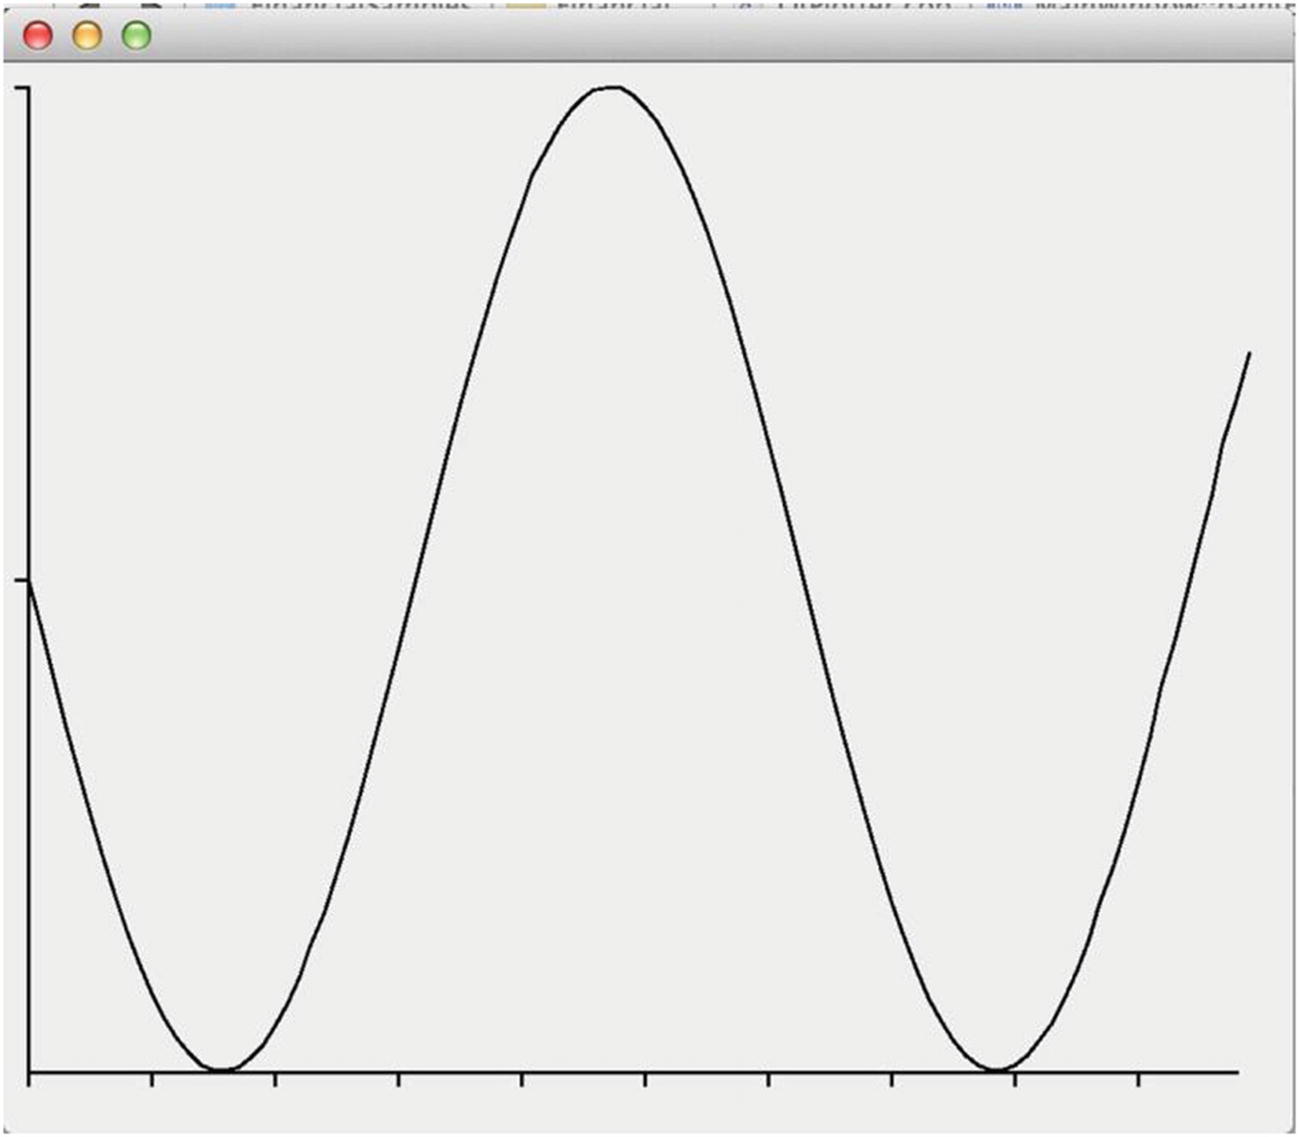
Plot produced by class QtPlotter

Complete Code

The class QtPlotter, displayed in Listing 6-2, implements the necessary functionality to show a plot in a Qt window, as explained in the previous section. To compile this code, you need to install the Qt libraries in your system.
//
//  QtPlotter.h
#ifndef __FinancialSamples__QtPlotter__
#define __FinancialSamples__QtPlotter__
#include <string>
#include <vector>
class QtPlotter {
public:
    QtPlotter();
    QtPlotter(const QtPlotter &p);
    ~QtPlotter();
    QtPlotter &operator=(const QtPlotter &p);
    void setData(const std::vector<double> &xdata, const std::vector<double> &ydata);
    int plotWindowRun();
private:
    std::vector<double> m_xdata;
    std::vector<double> m_ydata;
};
#endif /* defined(__FinancialSamples__QtPlotter__) */
//
//  QtPlotter.cpp
#include "QtPlotter.h"
#include <QtGui/qapplication.h>
#include <QtGui/qmainwindow.h>
#include <QtGui/qpainter.h>
#include <algorithm>
#include <cmath>
#include <iostream>
using std::vector;
class PlotWindow : public QMainWindow {
public:
    PlotWindow();
    ~PlotWindow();
    void paintEvent(QPaintEvent *event);
    void setData(const vector<double> &xdata, const vector<double> &ydata);
private:
    vector<double> m_xdata;
    vector<double> m_ydata;
};
PlotWindow::PlotWindow()
{
}
PlotWindow::~PlotWindow()
{
}
void PlotWindow::setData(const vector<double> &xdata, const vector<double> &ydata)
{
    m_xdata = xdata;
    m_ydata = ydata;
}
void PlotWindow::paintEvent(QPaintEvent *event)
{
    QMainWindow::paintEvent(event);
    QPainter painter(this);
    // define margins
    double marginX = 10;
    double marginY = 10;
    double lengthX = 500;
    double lengthY = 400;
    // define axis
    int maxX = lengthX, maxY = lengthY;
    painter.drawLine(marginX,marginY, marginX, lengthY+marginY);
    painter.drawLine(marginX,lengthY + marginY, lengthX, lengthY + marginY);
    // find units
    int largeX = 0, largeY = 0;
    double largeXd = 0, largeYd = 0;
    for (unsigned i=1; i<m_xdata.size(); ++i)
    {
        if (largeXd < m_xdata[i]) largeXd = m_xdata[i];
        if (largeYd < m_ydata[i]) largeYd = m_ydata[i];
    }
    largeX = (int)largeXd + 1;
    largeY = (int)largeYd + 1;
    int unitX = maxX / largeX;
    int unitY = maxY / largeY;
    // paint ticks
    for (int i=0; i<largeY; ++i)
    {
        painter.drawLine(marginX-5, i*unitY+marginY, marginX, i*unitY+marginY);
    }
    for (int i=0; i<largeX; ++i)
    {
        painter.drawLine(marginX+i*unitX, lengthY+marginY, marginX+i*unitX, lengthY+5+marginY);
    }
    // draw plot
    for (unsigned i=1; i<m_xdata.size(); ++i)
    {
        painter.drawLine(marginX+unitX*m_xdata[i-1], unitY*m_ydata[i-1]+marginY,
                         marginX+unitX*m_xdata[i], unitY*m_ydata[i]+marginY);
    }
}
QtPlotter::QtPlotter()
{
}
QtPlotter::~QtPlotter()
{
}
QtPlotter::QtPlotter(const QtPlotter&p)
: m_xdata(p.m_xdata),
  m_ydata(p.m_ydata)
{
}
QtPlotter &QtPlotter::operator=(const QtPlotter &p)
{
    if (&p != this)
    {
        m_xdata = p.m_xdata;
        m_ydata = p.m_ydata;
    }
    return *this;
}
void QtPlotter::setData(const std::vector<double> &xdata, const std::vector<double> &ydata)
{
    m_xdata = xdata;
    m_ydata = ydata;
}
int QtPlotter::plotWindowRun()
{
    char *arg = (char *)"plotter";
    int argc = 1;
    QApplication app(argc, &arg);
    app.setApplicationName("Qt Plotter");
    PlotWindow window;
    window.resize(600, 600);
    window.show();
    return app.exec();
}
int main()
{
    QtPlotter plotter;
    vector<double> xdata;
    vector<double> ydata;
    for (int i=0; i<100; ++i)
    {
        double x = i*10/100.0;
        xdata.push_back(x);
        ydata.push_back(sin(x)+1);
    }
    plotter.setData(xdata, ydata);
    return plotter.plotWindowRun();
}
Listing 6-2

QtPlotter.h and QtPlotter.cpp

Running the Code

To use the QtPlotter class, you need to have the Qt4 library installed in your system. The installation process requires you to visit the developer website (www.qt.io/developers/), download, and run the installer application. After the installation is complete, the libraries will be copied to a user-defined folder.

The next step is to tell your compiler or IDE (Integrated Development Environment) where the libraries can be found. The two main parameters are the include path (used by the compiler) and the link path (used by the linker). For example, if Qt4 was installed in the directory /usr/local/qt4, the include path should be /usr/local/qt4/include, and the link path should be /usr/local/qt4/lib. From the library directory, at least two libraries are needed: libQtCore and libQtGui. You can refer to the Qt documentation for details on how to link to Qt libraries for specific systems, such as Windows. To compile and link your application using gcc, for example, the following command line would provide the necessary information :
$ gcc -o qtExample QtPlotter.cpp -I/usr/local/qt4/include –L/usr/local/qt4/lib –lQtGui -lQtCore

Conclusion

In this chapter, you learned a few techniques to plot financial data using C++. Visualization is one of the factors that shouldn’t be overlooked in the creation of efficient investment strategies. The better your visualization facilities, the easier it is to spot trends and opportunities in the markets. While there are many free and commercial alternatives to display stock charts, we frequently need to present data in a more flexible way.

I started the chapter with a recipe for creating numerical plots using Gnuplot. Gnuplot is a free, widely available package for data visualization, which runs in most operating systems, including Windows, Mac OS X, and UNIX. You have seen how to create a class that encapsulates the information necessary to create graphs in Gnuplot.

The next section gave you another approach to create your own financial plots, using a C++ graphical library called Qt. You can employ this type of code in multiple platforms, taking advantage of the high portability of the underlying framework. The QtPlotter class presented here exposes an interface that your program can use to display a single plot based on values for the x and y axis.

Many of the algorithms in finance depend on the solution of systems of equations, which are based on linear algebra concepts. For the developer on the financial industry, it is very useful to have a basic knowledge of linear algebra and its software implementations. These concepts can be viewed as the building blocks used by financial engineers and can be easily accessed in C++. In the next chapter, you will see a few programming examples that make use of linear algebra concepts as part of financial applications.

..................Content has been hidden....................

You can't read the all page of ebook, please click here login for view all page.
Reset
18.218.70.93