
Chapter 6. Frontend Monitoring
Many companies often overlook frontend monitoring, usually due to monitoring being the “thing that Ops owns.” Your average sysadmin/ops engineer doesn’t often think about the frontend of an app, aside from the public-facing web servers. Unfortunately, this represents a pretty large blind spot, as we will soon see.
In this chapter, we’ll talk about why this is a blind spot and how to change that by looking at various approaches for frontend monitoring. We’ll wrap up the chapter with how to integrate frontend monitoring into other tools you’re already using to make sure you don’t lose those performance gains over time.
What do I mean by frontend monitoring? I define the frontend as all the things that are parsed and executed on the client side via a browser or native mobile app. When you load a web page, all of the HTML, CSS, JavaScript, and images constitute the frontend. All of the work a webapp does on fetching data from databases, executing backend code (e.g., Python, PHP), or calling APIs for data—that’s the backend. As more and more work is moved from the backend apps to the frontend, this delineation can get a little blurry.
In fact, with the proliferation of single-page apps (SPAs), it’s not uncommon for a spike in JavaScript errors to occur without any corresponding spikes in HTTP errors. Traditional approaches to monitoring simply aren’t suited for a world of client-side browser apps.
How you approach frontend performance is going to be a little different than what you’re used to. Your goal with monitoring frontend performance isn’t stay up, but rather, it’s load quickly. Over time, as you develop new features in your app, frontend performance has a habit of taking a hit due to the size of static assets, that is, all of your images, JavaScript, and CSS.
Using the strategies here for assessing performance and ensuring your improvements aren’t lost over time, we’ll make sure your frontend performance is always improving—or, at least, you’re always aware of where you stand.
The Cost of a Slow App
As engineers, we intuitively understand that a slow app is bad for business. I can’t count how many times a day I get frustrated with a slow website and just move on. But how bad is it for the bottom line, really? How do you convey the importance of frontend performance in a tangible, dollars-focused way? How do you convince people that spending time on frontend performance is worthwhile? How do you measure the outcomes?
According to a 2010 study conducted by Aberdeen Research, a one-second delay in your page load time results in an average of 11% loss in page views, 7% loss in conversions, and 16% loss in customer satisfaction. Aberdeen found that the business begins to suffer when the page load time reaches 5.1 seconds, while the sweet spot for load time is under 2 seconds.
Shopzilla and Amazon had similar findings. Shopzilla’s page load time dropped from 6 seconds to 1.2 seconds, resulting in a 12% increase in revenue and a 25% increase in page views. Meanwhile, Amazon found that revenue increased by 1% for every 100 ms of load time improvement.
In more recent times, Pinterest undertook a frontend performance project in March 2017 with equally astounding and impactful results: 40% drop in perceived wait time, 15% increase in SEO traffic, and a 15% increase in signups. As the authors of the blog post wrote, “Because the traffic and conversion rate increases are multiplicative, this was a huge win for us in terms of web and app signups.” That’s quite the endorsement for the impact of tuning for performance on the frontend.
Even with these hard, concrete numbers, it’s amazing how many teams still don’t prioritize frontend performance improvements. I was recently speaking with a colleague who specializes in this area and helps other companies get these same sorts of results. He observed that even though he could tie actual bottom-line dollar amounts to the improvement efforts, teams were still hesitant, and sometimes unwilling, to dedicate any time to the work. Don’t be one of those teams: great site performance is a requirement for profitable businesses that sell something online.
Two Approaches to Frontend Monitoring
There are two main approaches to frontend monitoring: real user monitoring (RUM) and synthetic. The difference between them has to do with the type of traffic you’re using for monitoring.
Note
Technically, these two approaches extend to all monitoring, not just frontend. You may know them as whitebox monitoring and blackbox monitoring.
If you’ve ever seen Google Analytics, that’s a type of RUM. In essence, RUM uses actual user traffic for the monitoring data. It does this by having you put a small snippet of JavaScript on every page. When someone loads that page, it sends some metrics off to the monitoring service.
On the flip side, tools like WebpageTest.org are synthetic monitoring: they create fake requests under a variety of test conditions to generate the data. Many software vendors try to tout their RUM and synthetic monitoring tools as something unique and special, but the only thing special about them is their particular implementation.
RUM will be the core of your frontend monitoring efforts, as it’s monitoring performance experienced by real users under real conditions. We’re going to focus on methodology and foundations of RUM for much of this chapter, and wrap up with some thoughts on synthetic monitoring.
Document Object Model (DOM)
Before we get into the nitty-gritty of frontend monitoring, we first need to talk about a core concept: the Document Object Model, commonly known as the DOM.
The DOM is the logical representation of a web page. The DOM is roughly tree-like, with every HTML tag making up a node in the DOM. When a page is requested, the browser parses the DOM and renders it into a page that’s visually readable. Technically speaking, HTML is not the DOM, nor is the DOM just HTML—though, to make things more confusing, a completely static website’s source HTML is a complete representation of the DOM. As soon as you introduce JavaScript, the DOM and the HTML source diverge.
As you may know, a JavaScript script can reference an HTML element and change the data in it on the fly, after the page has loaded, making the page dynamic. If you’ve ever used an online calculator, you’ve seen this in action. This is how the modern web works, just with a whole lot more JavaScript and complexity. As a result of this capability, the DOM that the browser parsed and the final page your browser presented to you aren’t the same.
The reason web page performance is a big deal is because of the multitude of ways JavaScript impacts it. By default, scripts are loaded synchronously. That is, if the DOM is being parsed and a <script> tag is encountered, the browser will stop parsing the DOM and load the script. This makes a full HTTP connection to request the script, download it, execute it, load it into the DOM, then continue with parsing the DOM.
HTML5 supports an async attribute on <script> tags, which tells the DOM to not block on loading the script. This async attribute allows the script to be downloaded in the background while the DOM continues to be loaded, executing the script when it’s finished downloading. This capability improves page performance greatly, but it’s certainly not a silver bullet.
I know this is a book about monitoring, so you might be wondering why we’re talking about JavaScript so much. I find it’s helpful to understand the underlying mechanics of what it is we’re monitoring, and when it comes to frontend monitoring, we’re really talking about the mess that JavaScript can cause.
To wit, imagine you have dozens of these scripts: you can see how page performance would degrade. As an example, as of this writing, cnn.com loads 55 scripts, while google.com loads a mere five. The load times correspond as you might imagine: 8.29 seconds for cnn.com and a snappy 0.89 seconds for google.com.
Frontend Performance Metrics
With that lesson about the DOM out of the way, let’s get down to business: metrics. Many people aren’t aware of how much data the browser itself collects and exposes to anything that asks for it. In fact, your browser exposes a wealth of information such as your device’s battery level, current time, time zone, and even the size of your screen (and more!). Of course, we’re interested in performance metrics, which the browser has as well.
While many of the tools available on the market abstract frontend measurements away, rolling them up into a nice easy-to-use package, it’s helpful to understand what they’re doing. In most cases, you’re going to be using some SaaS tool to keep tabs on frontend performance, but let’s look at what’s going on under the hood.
Navigation Timing API
Browsers expose page performance metrics via the Navigation Timing API, a specification recommended by the W3C. This API is enabled by default for every page and provides a lot of information about the page performance. This API exposes 21 metrics in total, though in my experience, most of them are useful for troubleshooting performance while only a few are necessary for regular monitoring of trends.
The full list of metrics available in this API are shown in Table 6-1.
navigationStart |
unloadEventStart |
unloadEventEnd |
redirectStart |
redirectEnd |
fetchStart |
domainLookupStart |
domainLookupEnd |
connectStart |
connectEnd |
secureConnectionStart |
requestStart |
responseStart |
responseEnd |
domLoading |
domInteractive |
domContentLoadedEventStart |
domContentLoadedEventEnd |
domComplete |
loadEventStart |
loadEventEnd |
Figure 6-1 will make more sense of them:
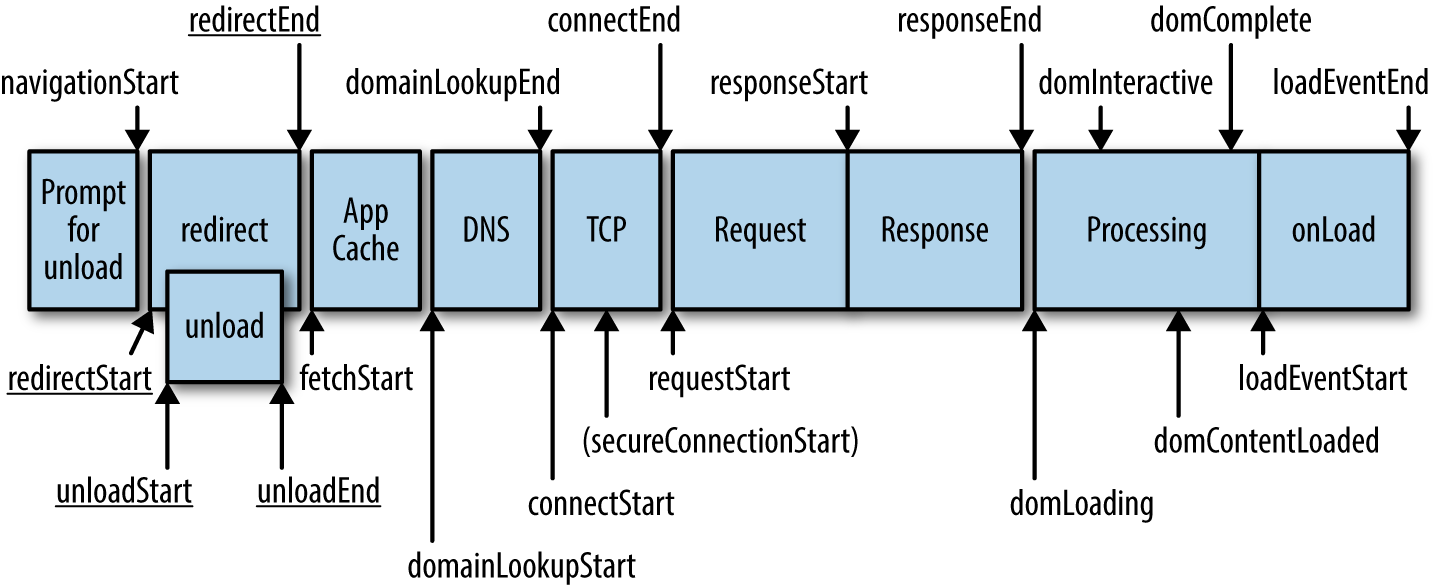
Figure 6-1. Navigation Timing API measurements
These are the metrics I’ve found most consistently useful:
-
navigationStart
-
domLoading
-
domInteractive
-
domContentLoaded
-
domComplete
Let’s look at what these mean in more detail:
- navigationStart
-
This marks the time when the page request is made by the browser.
- domLoading
-
This marks the time when the DOM has been compiled and begins loading.
- domInteractive
-
This marks the time where the page is deemed to be usable, but not necessarily finished loading.
- domContentLoaded
-
This marks the time when all scripts have been executed.
- domComplete
-
This marks the time when the page has finished loading everything (HTML, CSS, and JavaScript).
There’s another API in the browser called the User Timing API that’s potentially useful for the more adventurous among you. Whereas the Navigation Timing API’s metrics are set, the User Timing API allows you to create your metrics and events.
Speed Index
WebpageTest, being the de facto frontend performance testing tool, has quite a few interesting and useful metrics. Chief among them, one you may be familiar with already, is Speed Index.
Whereas Navigation Timing metrics rely on accurate reporting by the browser, Speed Index uses video capture at a rate of 10 frames per second to determine exactly when a page is finished loading from a visual perspective. It’s far more accurate than browser-reported metrics for determining the user-perceived completeness. The test results are then computed according to the Speed Index algorithm, which is represented as a single number where lower is better. Speed Index is a good number to get a general understanding of performance, but I would caution you about relying too much on it, since it doesn’t include a lot of details that browser-reported metrics give you.
OK, That’s Great, but How Do I Use This?
A list of metrics isn’t that useful if you can’t use them for anything. So, for example, with a little math, you can compute some useful numbers:
-
domComplete-navigationStart= Total page load time -
domInteractive-navigationStart= Time until the user perceives the page as loaded
Once you’re instrumenting your app to get this data, you can send it to any number of places. Example 6-1 shows how you can use Google Analytics and its analytics.js library to instrument your app, sending the metrics to Google Analytics:
Example 6-1. Using the Navigation Timing API with Google Analytics (code by Google)
// Feature detects Navigation Timing API support.if(window.performance){// Gets the number of milliseconds since page load// (and rounds the result since the value must be an integer).vartimeSincePageLoad=Math.round(performance.now());// Sends the timing hit to Google Analytics.ga('send','timing','JS Dependencies','load',timeSincePageLoad);}
If you’d prefer to use existing tools, such as StatsD and Graphite, you have a bit of a harder time. It’s not straightforward to send to a UDP/TCP socket from JavaScript, but there are StatsD backends that accept an HTTP POST.
More likely (and I recommend this), if you’re doing frontend monitoring, you’ll be opting for a specialized SaaS product. These come with their proprietary libraries for instrumentation, and they’re quite simple to use. Under the hood, they’re leveraging the same APIs we’ve discussed, just in a very simple-to-use manner, plus great dashboards. If you’re not going that route, the Google Analytics option is probably your best bet, especially if you’re running a small site with little infrastructure.
Logging
If you’ve spent any time in the JavaScript world, you are likely already familiar with the console statement. console is used primarily for debugging and development purposes. For example: console.log("This statement logs an entry");. These sort of debug statements are certainly useful, but unfortunately, not all that helpful when you’re wanting to stay on top of errors in production. After all, you don’t want to be flooding the user’s browser console with messages meant for you. For logging in production, you need something more robust.
Unfortunately, options are limited in this area. There’s not much in the way of a generic logging infrastructure like syslog, resulting in dozens of libraries of varying quality that essentially try to accomplish the same goal of sending log entries somewhere.
However, if you can use a SaaS product, your options open up substantially: there are several products out there that handle all of the hard parts of collecting exceptions and log statements from JavaScript and sending them to a hosted service. Google for exception tracking saas and you’ll find plenty of great options.
Synthetic Monitoring
If you’ve ever run curl on a website to ensure it was working, you’ve performed a synthetic test. There are tools out there that take it much further, specifically designed for web page performance. The big dog in that space is WebpageTest.org.
I’ve mentioned WebpageTest (they’re the folks who created the Speed Index), but I want to come back to it for a particularly neat use case: integrating it into your testing suite. Performance of webapps tends to degrade over time, unless you actively optimize for performance on a regular basis. Since you can’t improve what you don’t measure, what if you could measure the frontend performance impact of every pull request? This is where WebpageTest private instances save the day.
By making use of WebpageTest’s API in your automated testing process, you can ensure your team is considering the performance impact of new features and not lose those hard-won performance gains.
Wrap-Up
As we’ve learned, frontend monitoring, despite being largely overlooked, is not only possible, but relatively easy to do. Like all monitoring, it’s a rabbit hole that can go on seemingly forever, but the basics are simple:
-
Monitor page load times for actual users.
-
Monitor for JavaScript exceptions.
-
Keep track of page load time over time with your CI system, ensuring load times stay within an acceptable range.
The frontend of your app is closely tied to the backend, though, and performance in the backend can often manifest as frontend issues (for example, slow reaction times when clicking buttons). To that end, let’s move on to instrumenting the backend of your app (in other words, the code).