
Chapter 7. Application Monitoring
I’ve seen many companies with robust monitoring on their server infrastructure, great security monitoring, and a very capable network monitoring strategy—yet their applications are an unknowable black box. This always strikes me as odd, since most organizations are changing their applications more often than they are changing anything else, which means visibility into the performance of those applications should be of high importance.
I think it’s mostly because many teams think application monitoring is too hard or requires some highly specialized skillset. Thankfully, neither is true, and this chapter will help you on your way to having high visibility into your applications.
Instrumenting Your Apps with Metrics
One of the most powerful things you can do in monitoring is also one of the most overlooked things: instrumenting your own applications. Why would you want to do this? Easy: your apps have a ton of valuable information about their performance, many of which will allow you to move from reactive to proactive in maintaining that performance.
One common fear I’ve heard is that it’s difficult and time-consuming to add metrics to apps, but I’m here to tell you neither are true. As with all things, starting simple is the key: what about timing how long database queries take? Or how long some external vendor API takes to respond? Or how many logins happen throughout the day?
Once you start instrumenting your app, it becomes addictive. App metrics are so useful for a variety of things, you’ll wonder why you didn’t get started sooner.
An Aside About Application Performance Monitoring (APM) Tools
There are a lot of tools out there under the umbrella of application performance monitoring (APM) tools. The idea is that adding an agent or library to your app will allow them to automatically find all sorts of information about application performance, slow queries, and waterfall charts of your app. It’s a compelling pitch, and it’s not wrong: they will do all of these things and often more.
Here’s the rub: these tools have zero context about your app or the business logic behind it. While you’re looking at pretty waterfall charts of time spent on certain queries, it’s not telling you anything about latency on a critical workflow path—or anything else that requires context around what it is the app does.
APM tools aren’t bad, but understand their inherent limitations.
I know I’ve said that I wouldn’t be talking about specific tools in this book, but there are exceptions. StatsD is one of those due to how easy it is to use in a variety of situations. It also perfectly illustrates how simple it is to instrument your apps.
StatsD is a tool used to add metrics inside of your code. Created by Etsy in 2011, StatsD has become a staple in any modern monitoring stack due to its ease of use and flexibility. Even if you don’t use StatsD, the takeaways are still valuable. StatsD was originally designed for a Graphite backend, so the metric names are dot-delimited (e.g., my.cool.metric).
I think explaining the value by example is the best way to really get a sense of the benefits here. Let’s take this simple login function:
deflogin():ifpassword_valid():render_template('welcome.html')else:render_template('login_failed.html',status=403)
If the password is valid, we return the welcome page (and an implicit HTTP 200), but if the login fails, we return the login_failed.html page and an HTTP 403 Access Denied. Wouldn’t it be nice if we knew how often each happened? I’m so glad you asked:
importstatsdstatsd_client=statsd.StatsClient('localhost',8125)deflogin():statsd_client.incr('app.login.attempts')ifpassword_valid():statsd_client.incr('app.login.successes')render_template('welcome.html')else:statsd_client.incr('app.login.failures')render_template('login_failed.html',status=403)
I’ve added three metrics to this function now: how many times a login is attempted, how many logins succeed, and how many logins fail.
StatsD also supports timing how long something takes, and this is where we get into interesting things. What if our login service was a separate microservice, or even external? How would you know if things were about to go wrong?
importstatsdstatsd_client=statsd.StatsClient('localhost',8125)deflogin():login_timer=statsd_client.timer('app.login.time')login_timer.start()ifpassword_valid():render_template('welcome.html')else:render_template('login_failed.html',status=403)login_timer.stop()login_timer.send()
In this example, we’re setting up a timer to record how long the function takes, in effect, telling us how long a login takes. Once you know how long it normally takes to process a login, the question of “Do logins seem slower to you?” is immediately answered with data instead of instinct and a shrug.
And that’s only the beginning of what you can do with instrumenting your application with StatsD!
How It Works Under the Hood
StatsD is comprised of two components: the server and the client. The client is the code library itself that instruments the app and sends the metrics to the StatsD server over UDP. The StatsD server can live locally on each of your servers, or you can have a centralized StatsD—both patterns are commonly used.
The choice of UDP is important here. As UDP is a nonblocking protocol, that is, there is no TCP handshake to slow things down, instrumenting the app with StatsD calls won’t have any significant impact on the app’s performance. StatsD does support TCP as well, though I haven’t found any good reason to use it over UDP.
StatsD “flushes” all collected metrics on its configured flush interval to all configured backends. By default, metrics are flushed every 10 seconds. An important bit about the flush is that all metrics collected during the flush interval are aggregated and then sent to the backend. Each data type aggregates in a different way.
Timers compute several separate metrics:
-
The mean of the 90th percentile
-
The upper bound of the 90th percentile
-
The sum of the 90th percentile
-
The upper bound of all timers in the time period
-
The lower bound of all timers in the time period
-
The sum of all timers in the time period
-
The mean of all timers in the time period
-
A count of the timers collected during the time period.
This sounds like a lot, but it’s actually quite straightforward. For example, if you sent these values as timers:
5
9
30
25
7
3
2
15
17
80
then the results that StatsD would send are:
mean_90: 10.37
upper_90: 25
sum_90: 83
upper: 80
lower: 2
sum: 193
mean: 19.3
count: 10
If you send a gauge, only the last value in the flush period is sent. A set behaves the same way as a gauge. If you send a counter, then two metrics are sent: the counter value and the per-second value. For example, if you increment the counter 11 times during the flush period, then the counter value sent will be 11, and the per-second value will be 1,100 ($value / ($flushInterval / 1,000)).
On the backend, you can send metrics to all sorts of places, including Carbon (Graphite), OpenTSDB, InfluxDB, and many SaaS tools. Configuring a backend is different for each backend, but it’s all straightforward. StatsD comes with the Graphite backend built in. Check the documentation for your specific backend on how to set it up.
There’s a lot more to StatsD that you can find in the documentation, which I encourage you to read if you’re interested. It’s also worth mentioning that most of the SaaS monitoring vendors have their own implementation of StatsD or StatsD-like functionality.
Monitoring Build and Release Pipelines
Monitoring a build/release pipeline or procedure is an oft-overlooked aspect of the build-release process. Monitoring the process yields so much more insight and information into your app and infrastructure and helps you spot regressions and other problematic areas. You might be asking, “What could you possibly be monitoring here? A deploy either works or it doesn’t!” That’s mostly true. The real benefit here is in the meta-information (when did the deploy start, when did it end, what build deployed, who triggered the deploy) being available in the same place as your other app and infrastructure metrics.
Etsy popularized this concept in its seminal blog post, “Measure Anything, Measure Everything”, resulting in many different new ideas and tools for making it work even better. These days, most moderns metrics tools (both SaaS and on-premise) contain some way to implement this functionality (usually called events, annotations, or most aptly, deployments).
You’re probably wondering why this is useful at all, so let’s look at Figure 7-1: deployment events overlaid on API error rates.
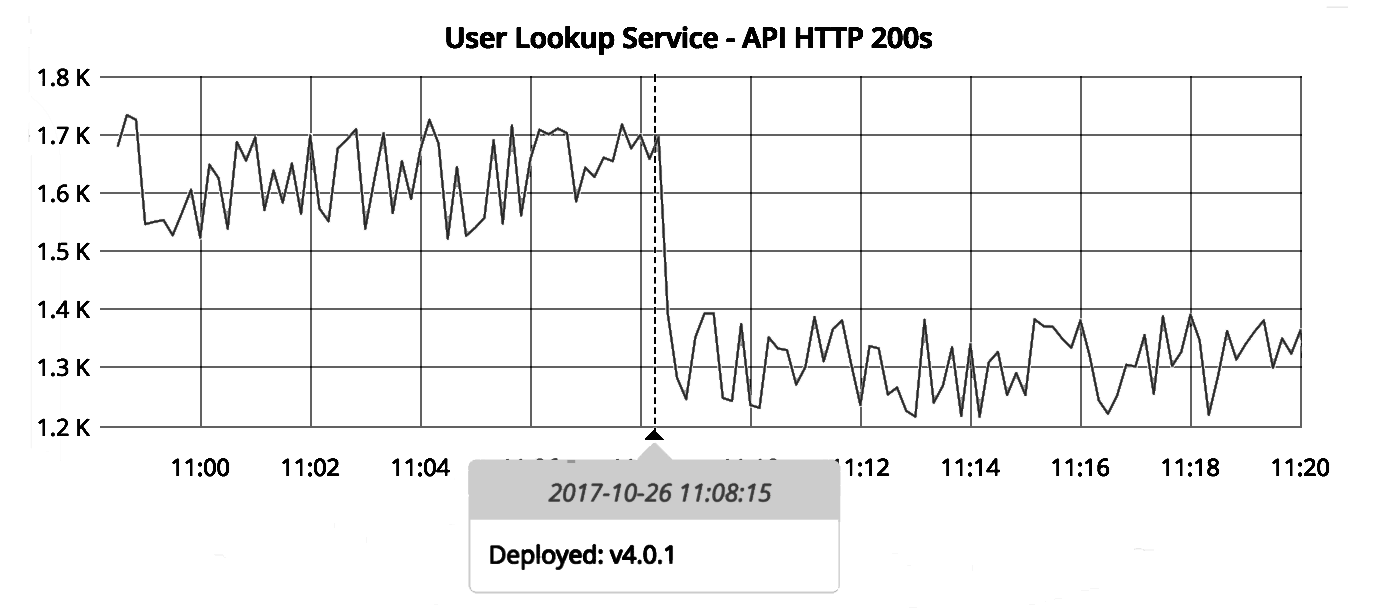
Figure 7-1. Deployment marker and API errors
The graph clearly shows a correlation between a recent deploy and significantly lowered API success rates. While correlation does not equal causation, this graph shows a strong case for the deploy having caused a problem somewhere. Recording information about deploy timing, the build data, and the deployer gives us more useful information for troubleshooting. Recording this information isn’t often helpful by itself; but by combining this information with other metrics, we gain a whole new perspective and understanding of what our app and infrastructure is doing.
Health Endpoint Pattern
Oddly enough, this concept has been around for ages, but no one seems to have settled on an official name for the pattern. I’ve taken to calling it the /health endpoint pattern, while there are also some articles online referencing the concept as a canary endpoint. Some just call it a status endpoint.
Whatever you call it, the concept is straightforward: an HTTP endpoint in your app that tells you the health of the app, and sometimes includes some basic information about the app (such as deployed version, status of dependencies, etc.). Underlying the endpoint is separate code that pulls information about the app’s health and state. The implementation can range from simple to incredibly complex, as we’ll soon see.
Why would you want to use this pattern? After all, we just spent several pages talking about how great push-based performance data is, so why would you want to use something that requires regularly pulling data?
There are several benefits to this pattern that you can’t get with metric-based approaches:
-
This endpoint can be used as the health check for a load balancer or for service discovery tools.
-
The endpoint is helpful for debugging: exposing build information in the endpoint helps with determining what is running in the environment easily.
-
Increasing the depth of the health check eventually yields an app that is aware of its own health.
Of course, it’s not an either-or situation: you can implement both patterns, emitting metrics and providing a /health endpoint. Many teams do exactly that, depending on their needs.
Let’s look at a simple implementation to illustrate. Consider a simple Django (a Python framework) app with a database dependency. I’m glossing over the underlying Django configuration, which I’m leaving as an exercise to you; this code is simply to illustrate how the health check might work, not how to use Django. You’ll want to configure your app to call health() at whatever route you use (such as /health):
fromdjango.dbimportconnectionassql_connectionfromdjango.httpimportJsonResponsedefhealth():try:# Connect to a SQL database and select one rowwithsql_connection.cursor()ascursor:cursor.execute('SELECT 1 FROM table_name')cursor.fetchone()returnJsonResponse({'status':200},status=200)exceptException,e:returnJsonResponse({'status':503,'error':e},status=503)
This example reuses the existing database configuration for the app, which is a great idea so that you don’t end up in the situation of the /health endpoint and the app using different credentials. This example just does a very simple query to return a single row. If the connection is successful, an HTTP 200 is returned, while an HTTP 503 is returned if it fails.
What if this app had more dependencies than just MySQL? What if it also depended on, say, Redis?
fromdjango.dbimportconnectionassql_connectionfromdjango.httpimportJsonResponseimportredisdefcheck_sql():try:# Connect to a SQL database and select one rowwithsql_connection.cursor()ascursor:cursor.execute('SELECT 1 FROM table_name')cursor.fetchone()return{'okay':True}exceptException,e:return{'okay':False,'error':e}defcheck_redis():try:# Connect to a Redis database and retreive a keyredis_connection=redis.StrictRedis()result=redis_connection.get('test-key')# Compare the key's value against a known valueifresult=='some-value':return{'okay':True}else:return{'okay':False,'error':'Test value not found'}exceptException,e:return{'okay':False,'error':e}defhealth():ifall(check_sql().get('okay'),check_redis().get('okay')):returnJsonResponse({'status':200},status=200)else:returnJsonResponse({'mysql_okay':check_sql().get('okay'),'mysql_error':check_sql().get('error',None),'redis_okay':check_redis().get('okay'),'redis_error':check_redis().get('error',None)},status=503)
In this example, we’ve moved the two health checks into their own functions, then call them both from the health() function. If both return that they’re working, the code returns an HTTP 200. However, if either one (or both) return otherwise, the code returns an HTTP 503.
If your service depends on other services, you could use this health check to check those too. For example, if your service has a hard dependency on an external API, why not check that?
fromdjango.httpimportJsonResponseimportrequestsdefhealth():r=requests.get('https://api.somesite.com/status')ifr.status_code==requests.codes.ok:returnJsonResponse({'status':200},status=200)else:returnJsonResponse({'status':503,'error':r.text},status=503)
You aren’t restricted to read-only operations with this, either—feel free to write data and test that. Let’s see how that might look with our preceding Redis example:
fromdjango.httpimportJsonResponseimportredisredis_connection=redis.StrictRedis()defwrite_data():try:# Connect to Redis and set a key/value pairredis_connection.set('test-key','some-value')return{'okay':True}exceptException,e:return{'okay':False,'error':e}defread_data():try:# Connect to Redis and retrieve the key/value we setresult=redis_connection.get('test-key')ifresult=='some-value':return{'okay':True}else:return{'okay':False,'error':'Redis data does not match'}exceptException,e:return{'okay':False,'error':e}defhealth():ifnotwrite_data().get('okay'):returnJsonResponse({'status':503,'error':write_data().get('error')},status=503)else:ifread_data().get('okay'):# Clean up the old data before returning the HTTP responsesredis_connection.delete('test-key')returnJsonResponse({'status':200},status=200)else:# Clean up the old data before returning the HTTP responsesredis_connection.delete('test-key')returnJsonResponse({'status':503,'error':read_data.get('error')},status=503)
In this example, we first write a Redis key-value pair, then read the data back. If the value matches what we set (which means all connections worked well), then we return HTTP 200, and HTTP 503 if any part of the test fails.
As you can see, after only a few iterations of this pattern, the health check has become much more complex than when we first started. Using this pattern extensively in a distributed microservice architecture for every microservice would ultimately result in all your services knowing their own health at all times. Essentially, you would have just automated constant testing of the entire environment.
It is worth noting, however, that some teams have found that overly complex /health endpoints actually make it harder to debug problems when the endpoint says there’s an issue, as well as the endpoint becoming needlessly noisy due to all of the dependencies it might be checking. It’s not hard to imagine a scenario where a highly interconnected service has so many health checks that it would become hard to determine where problems actually lie.
One question people often have is whether the endpoint should be just another route in the app, or a separate app entirely. You want to do the former, so that your monitoring is shipped right alongside the app. Otherwise, you’re defeating the point of this pattern.
One important thing I’ve found when using this pattern that is easy to overlook: you should be using the proper HTTP return codes. If everything is fine, return HTTP 200. If things aren’t fine, return something other than HTTP 200 (HTTP 503 Service Unavailable is a good one to use here). Using the correct HTTP response codes makes it easy to determine when things are working, without having to parse any text that is returned.
Speaking of returning text, depending on what you’re using this pattern for, it can be useful to return some data in the response. I’m a big fan of returning data as JSON, but feel free to use any other structured format—I don’t recommend using unstructured formats, as they’re more difficult to parse by machines. If your endpoint’s implementation is relatively simple, then there’s really no need to return data—just return an HTTP code and call it done.
What About Security?
I have heard objections to this pattern around security concerns. After all, you wouldn’t want your users to be able to access this endpoint. You can generally solve this by using access restrictions on your web server and allowing only certain source addresses to access the endpoint, redirecting all others somewhere else.
There are downsides to this pattern, too. The biggest issue is that it’s a lot more engineering work to implement than a simple metrics-based approach (that is, push-based) requires. You also need tooling that can consistently check the endpoint. If you come from metrics-based culture, you may not have this sort of infrastructure available to you.
So there you have it, the /health endpoint pattern. I’m rather fond of the pattern, but it certainly has its challenges and hurdles. In my opinion, the pattern is still useful, even if you aren’t in a microservice environment, simply for being able to easily run a sanity check on the app.
Application Logging
Metrics can only tell you so much about what your application is up to, which is why it’s important to also be logging behavior and actions from your applications.
If you recall back from Chapter 2, we talked about the importance of using structured logs over unstructured logs. While using structured logs in some server-side applications (e.g., Apache) requires real configuration that could be non-trivial for some people, emitting structured logs from your applications is super easy thanks to direct access to the data structures. Since JSON is simply a dictionary/hash, you can build up log data using those structures, then output using the logging library in your language of choice. Of course, many languages and frameworks have specialized libraries for emitting JSON-structured logs, which makes this even easier (to name a few, Python has structlog, Rails has lograge, and PHP has monolog).
Wait a Minute…Should I Have a Metric or a Log Entry?
The question of metric versus log can be a tricky one. Consider the following:
A metric: app.login_latency_ms = 5
A log entry: {'app_name': 'foo', 'login_latency_ms': 5}
If you have a sufficiently robust log analysis system, turning the log entry into metrics is trivial. A single log entry can contain significantly more metadata than a single metric entry can (in other words, more context):
{'app_name': 'foo', 'login_latency_ms': 5, 'username': 'mjulian', 'success': false, 'error': 'Incorrect password'}
This log entry is far more useful than the metric. In fact, from this log entry I can spot several distinct metrics that could be interesting. So why bother with metrics at all when logs can be so much more robust? Part of why this approach hasn’t caught on is simply a matter of tooling: the tools that do support this sort of approach are still in their infancy (or very expensive). The other part is that the common wisdom just isn’t there yet. My prediction: five years from now, we’ll all be discussing better ways to do logging for the purpose of performance analysis.
Until then, I have two rules of thumb for log versus metric:
-
Is it easier for your team to think about metrics or logs?
-
Is it more effective for the thing in question to be a log entry or metric? (In other words, think through your use cases.)
What Should I Be Logging?
Anything and everything!
Well, that’s not completely true. Writing logs for every little thing that happens is a great way to saturate your network or disk (depending on where you’re writing the logs to) and could potentially create a bottleneck in the app, due to spending so much time on writing log entries. For a particularly busy app, this could be a very real concern: your app might spend more time writing log entries than it does on doing the work it was created for.
The Solution Is Log Levels…or Is It?
The concept of log levels has been around for quite some time. The syslog protocol has been around since the 1980s, though it was only codified 2001 in RFC 3164. A later RFC, RFC 5424, updated and codified a few more things, such as severity levels. If you’ve ever wondered where those severity levels DEBUG, INFO, ERROR, and others came from, that’s where.
Many *NIX daemons support logging output based on these severity levels, getting more or less verbose depending on the level set. It’s common that using DEBUG in production settings will make the service unusable, due to the volume of log entries being generated from the service.
Here’s the problem with severity levels: you set them based on the assumption that everything is working fine. When you have a problem necessitating a DEBUG level (in other words, tricky, hard problems), you don’t have the data you need in the logs (since you probably set the default severity level to INFO or ERROR). Now you’re missing the data you desperately need.
When writing your own apps, you get to pick the severity level a particular entry is outputted at, which makes this problem much worse. Is an API connection failure severity ERROR? Or is it severity INFO? What if you have robust throttling, exponential backoff, retries, and other mitigation strategies? Are all of those DEBUG severity?
As you can see, severity levels are useful, but come with a big caveat. Use them wisely.
Instead of going wild and peppering logging statements everywhere, slow down a bit and think about the behavior of your application. When something goes wrong, what questions do you usually ask first? What information would be really useful to have during troubleshooting or even just for reporting mechanisms? Start there. In essence, it’s impossible to set up logging (or any monitoring, really) for a system that you don’t completely understand. Spend the time to think through the app, and the log statements you need (as well as metrics and alerts) will become obvious.
Write to Disk or Write to Network?
Write to disk, with a service that comes along at regular intervals to send to an external location.
Many log services support writing from inside the app directly to a network location. This makes it easy to ship your logs off for storage and analysis, but as your app’s traffic increases, this could become a significant and troublesome bottleneck. After all, you’re having to make a network connection every time you send a log entry, which can get expensive in terms of resource utilization.
Instead, it’s better to write the log entry to a file on disk. You can have a service that comes along at regular intervals (even near real time) to send the log entries to an external location. This allows for log shipping to be done asynchronously from the app, potentially saving a lot of resources. You can have this done using rsyslog’s forwarding functionality. Alternatively, many of the SaaS logging services have agents that perform the same job.
Serverless / Function-as-a-Service
Consider this problem: a serverless app (which I’ll refer to as a function) exists only as long as there is work to do. It’s invoked, does a job, then ceases to exist. The entire execution time? Under a second. Sometimes way under.
How in the world do you monitor such a thing? Traditional polling models don’t work: the polling interval isn’t short enough.
Many serverless platforms are already recording some metrics for you, such as execution time, number of invocations, and error rates. But, you’d probably like to know about what’s happening inside the function too.
The answer is quite simple: StatsD. Have a look back at the beginning of this chapter for more on that.
Also, don’t forget: your functions are probably making use of other established services with metrics and logs already available (e.g., AWS S3, AWS SNS, etc.), so be sure to check on those too.
Of course, monitoring one or two functions is different from monitoring an entire architecture built around them. If you’re in that situation, you are probably going to be very interested in distributed tracing. Let’s take a look at that now.
Monitoring Microservice Architectures
In a world where microservices are taking over everything, great monitoring becomes a must-have. Whether you’ve got three or four microservices or a hundred (or more!), understanding the interactions between these services can get complex, which makes monitoring challenging.
Consider the case of the monolith application in Figure 7-2:

Figure 7-2. A simple monolith app architecture
It’s easy and straightforward to understand the requests coming in, the results going out, and what’s happening between. And remember, a monolith need not be run on a single server—this example shows a monolith application scaled horizontally across four nodes.
What happens if we have even a small microservice environment? Imagine the preceding architecture—except repeated multiple times and abstracted away as a stand-alone service. Suddenly, you’re no longer certain where a request started, where it ended up, and where it might have gone wrong (Figure 7-3). Latencies are hidden in a microservice architecture unless you have rather robust and mature monitoring practices.
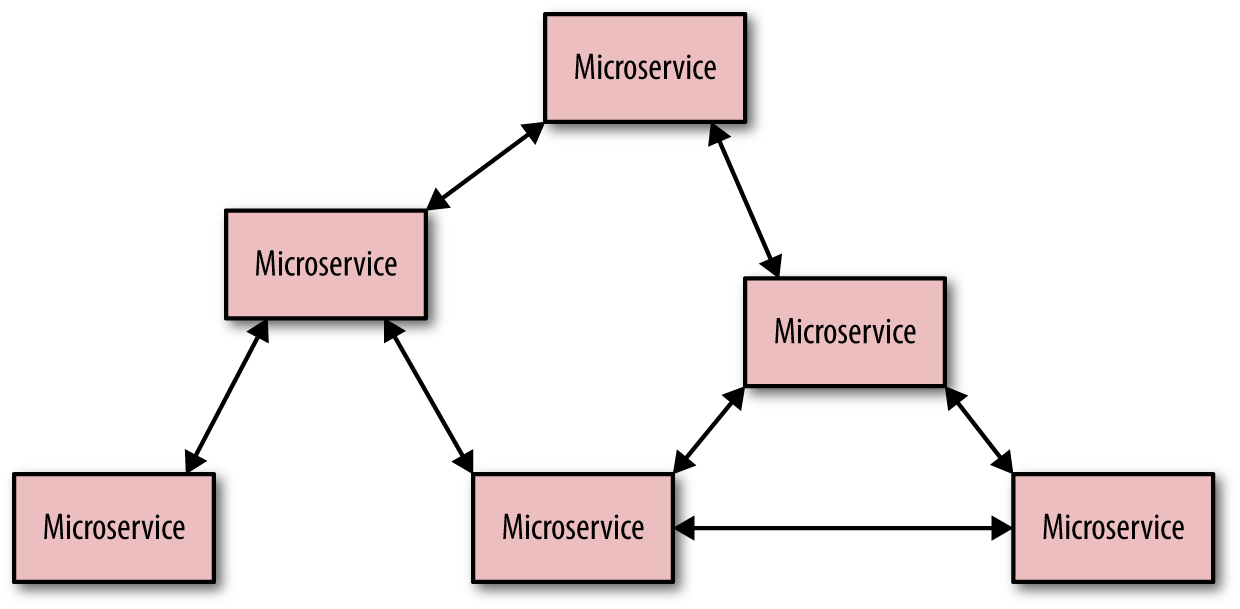
Figure 7-3. Microservice app architecture
Suddenly, understanding what happens with user requests is much more challenging. Enter distributed tracing.
Distributed tracing is a methodology and toolchain for monitoring the complex interactions inherent in a microservice architecture. Popularized by the Google Dapper paper and first implemented outside of Google with Zipkin, distributed tracing is becoming an integral component of the monitoring toolset for teams running microservice architectures.
How it works is straightforward: for every request that comes in, “tag” it with a unique request ID. This request ID stays with the request and resulting requests throughout its life, allowing you to see what services a request touches and how much time is spent in each service. One important distinction of tracing versus metrics is that tracing is more concerned with individual requests than the aggregate (though it can also be used for that). Figure 7-4 shows an example of a trace.
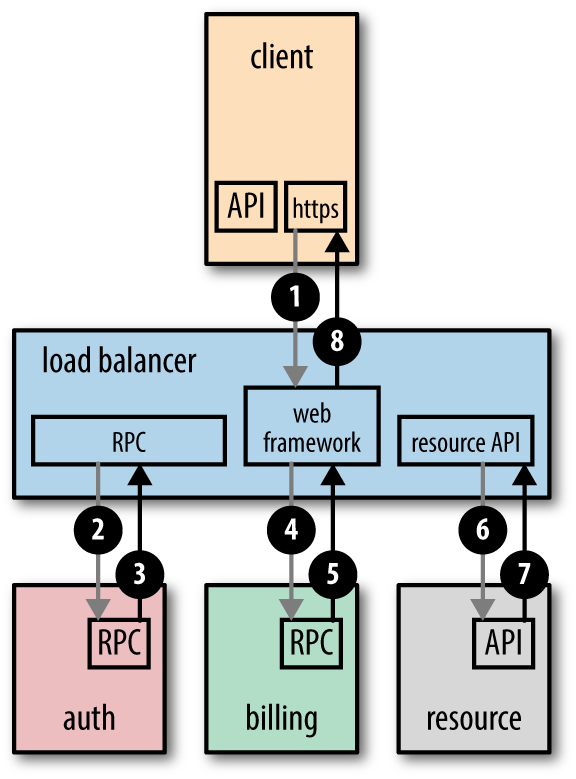
Figure 7-4. An example trace1
Distributed tracing is far-and-away the most challenging and time-consuming monitoring technique to implement properly, not to mention only being useful for a small segment of the industry. Distributed tracing is not for the faint of heart or the understaffed-and-overworked engineering team. If you’ve already got all the metrics and logs you want, but still find yourself struggling to understand inter-service performance and troubleshooting in a distributed architecture, then distributed tracing might be for you (and the same goes for those of you with significant serverless infrastructures). Otherwise, effectively instrumenting your apps with metrics and logs is going to result in much better (and quicker!) outcomes.2
Wrap-Up
To summarize what we’ve learned in this chapter on application monitoring:
-
Instrumenting your application with metrics and logs is one of the most impactful things you can do for increasing your ability to understand and troubleshoot the performance of your applications.
-
Tracking releases and correlating with performance in your apps and infrastructure.
-
The /health endpoint pattern is pretty neat, though really only useful for certain architectural designs.
-
Serverless and microservice monitoring really isn’t that different from any other application, unless you have a sizable deployment. Then distributed tracing is probably where you want to begin investing time and effort.
Application code runs on servers somewhere, of course, and the performance of those servers has huge impact on the performance of your application. Let’s go look at what it means to monitor your server infrastructure.
1 Based on an example trace found in the OpenTracing Framework documentation; Copyright OpenTracing Project.
2 That said, tracing tools are consistently improving in their implementation complexity. I suspect in a couple of years my warning will be moot.