
Chapter 38. How to Make Dual-Axis Slope Graphs
Slope graphs, or essentially line graphs between two points, are one of my favorite Tableau charts when my analysis requires a comparison between two data points. They work so well, in fact, that they are the one chart I will use to connect lines between discrete categorical variables. In almost every scenario, lines should only be used to connect points in time, but with slope graphs, I am OK drawing a line between “Thing 1” and “Thing 2,” as well as “Time 1” and “Time 2.” I like the following approach so much because you can easily view changes of individual dimension members (i.e., sub-categories) in context of each other, and the dual-axis mark provides extra real estate to share additional context in your analysis.
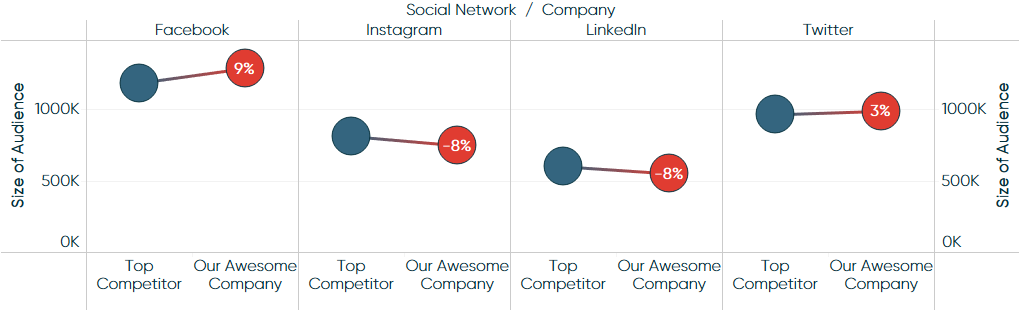
This chapter shares not only how to make slope graphs in Tableau, but how to enhance them by leveraging a second axis to provide additional context. By the end of the chapter, we will have re-created this dual-axis slope graph:
How to Make Slope Graphs in Tableau
First, let’s knock out the traditional slope graphs using this data:
-
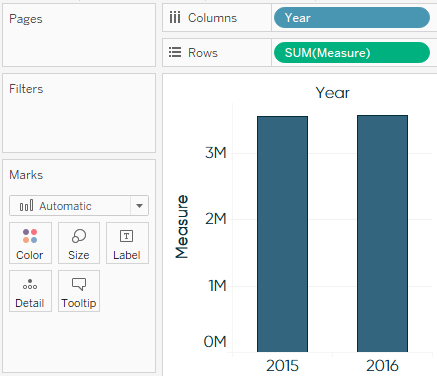
Create a bar chart.
Create a bar chart with your two-point time comparison on the Columns Shelf as a discrete dimension and your measure on the Rows Shelf:
-
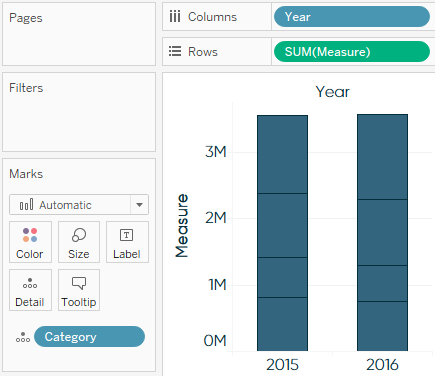
Add dimension to level of detail.
Add the dimension you are wanting to compare to the Detail Marks Card. This will eventually create one line per categorical variable:
-
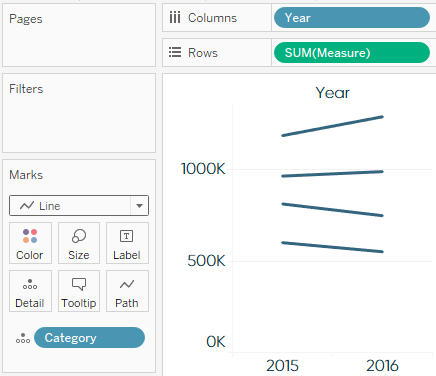
Change the mark type to Line.
Change the mark type from Automatic (currently set to Bar) to Line to create slope graphs:
-
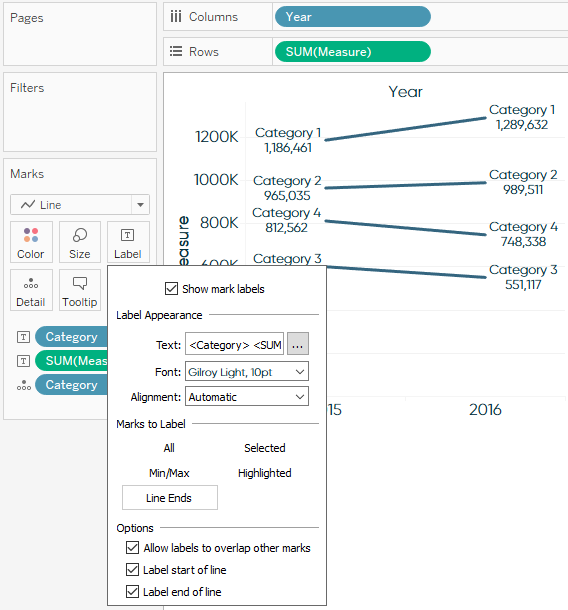
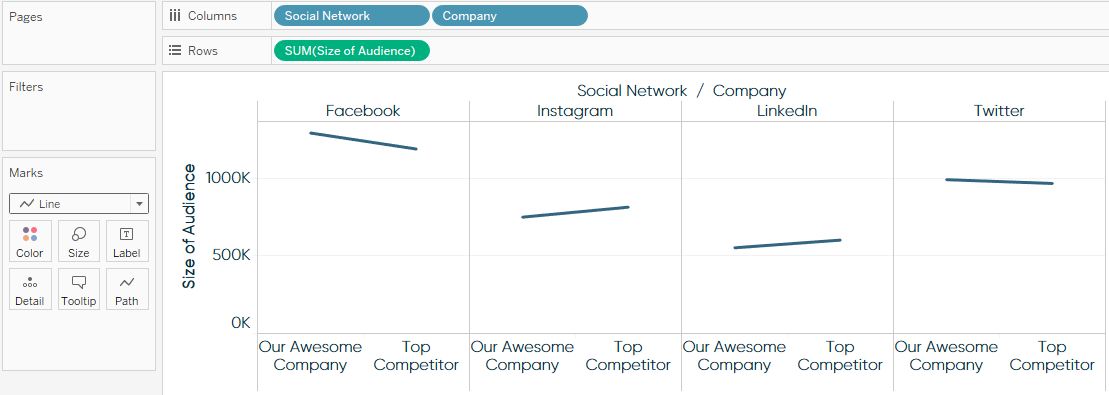
Format the lines.
To finalize the view, add labels and markers to the line ends. To update the labels, place the fields you want on the view to the Label Marks Card, and edit the Label Marks Card to show labels on the line ends. The markers are added by editing the Color Marks Card:
How to Make Dual-Axis Slope Graphs in Tableau
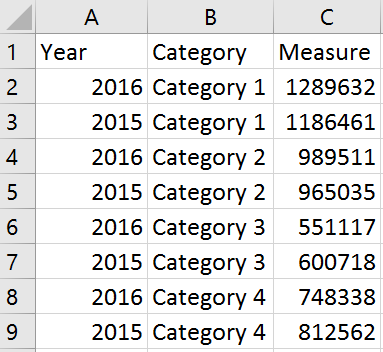
For the purposes of this exercise, the underlying data looks like this:
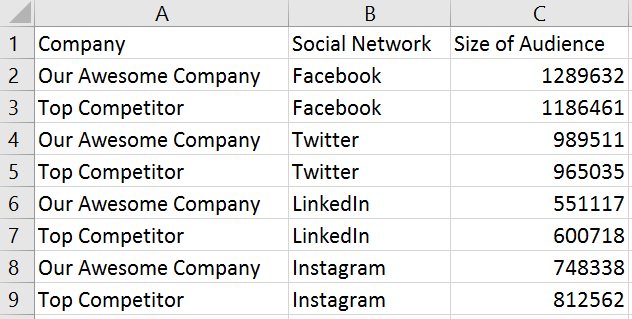
I’m using a Company A versus Company B scenario just to show a slightly different use case, but this same exact process is applicable if you are comparing two points in time.
Warning
Disclaimer before I let the genie out of the bottle: in the Thing 1 versus Thing 2 scenario I’m about to share, I only think this works well if you are comparing exactly two things. Once you get beyond two things, the visualization officially becomes a line graph, and should never be used to connect dimensions that are not elements of time. The best practice with more than two things is a simple bar chart.
-
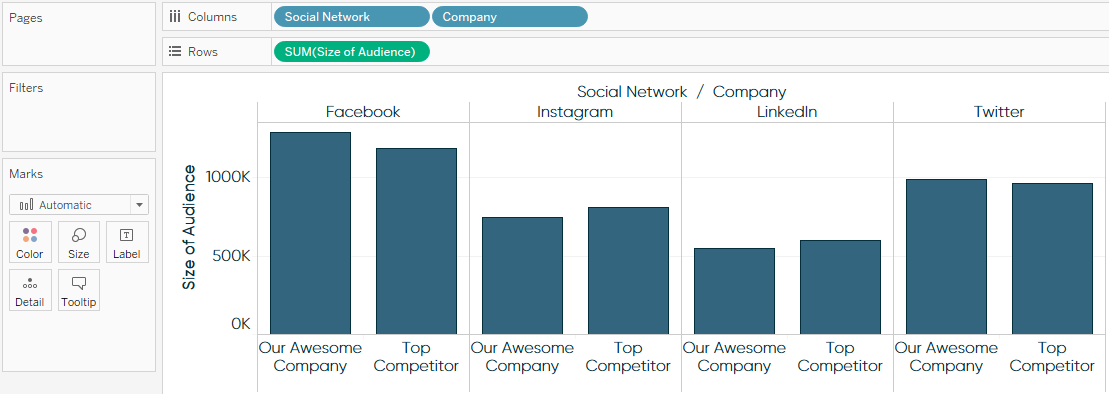
Create a bar chart.
As already mentioned, the first step to creating slope graphs is to get the columns set up with whatever dimensions we are comparing. Sometimes with traditional slope graphs, there can be overlapping points and labels if data points are too close together. In that case, and when comparing two things (versus times), I prefer to place the more granular dimension (in our case, social network) on the Columns Shelf first, followed by the dimension that includes “Thing 1” and “Thing 2” or “Time 1” and “Time 2.” The measure we are analyzing goes on the Rows Shelf, to end up with a bar chart view like this:
Again, this chart type is best practice when we are comparing two discrete categorical variables such as Company A versus Company B, so stop here if you are feeling any discomfort with looking at this in a different way.
-
Change mark type to Line.
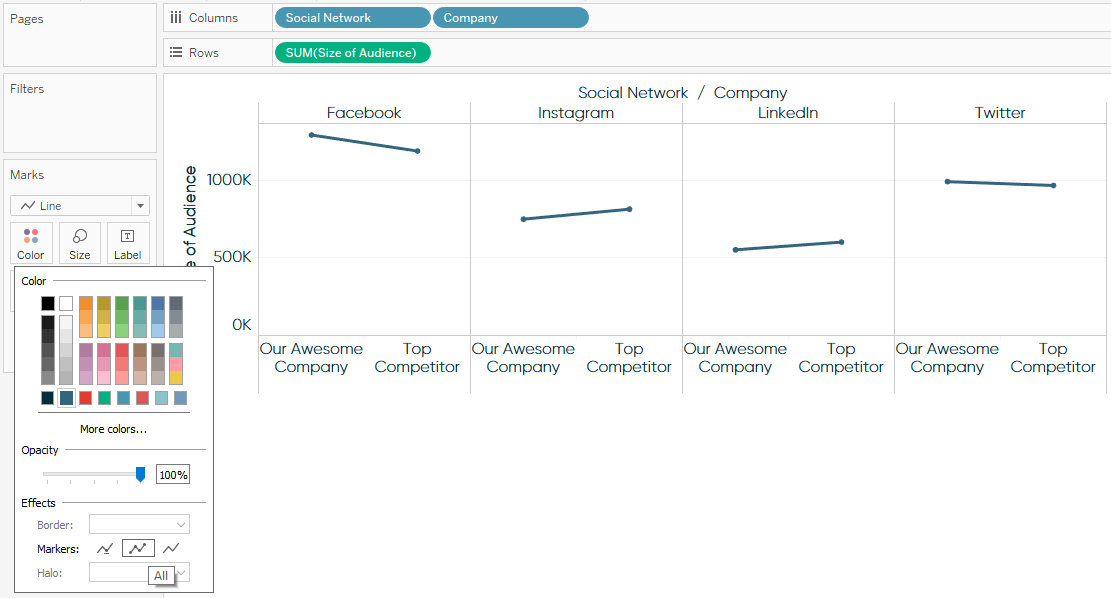
From here, a bar chart is converted into a slope graph by simply changing the mark type on the view from Bar to Line:
You can get a nice look from here by adding markers to the line ends:
At this point, you already have slope graphs in Tableau. This is an awesome chart type. If you want an incredibly awesome chart type, keep reading.
-
Create a dual-axis combo chart.
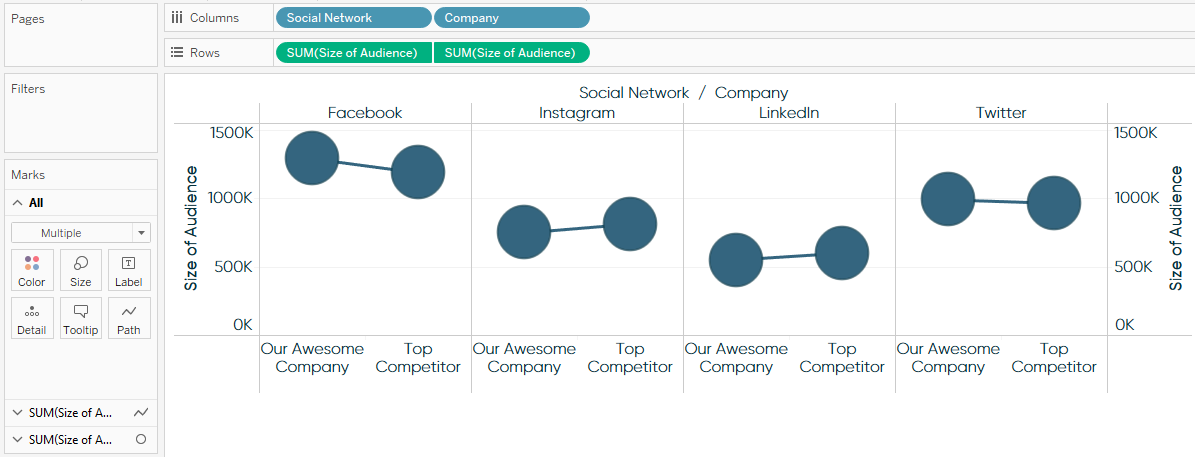
Create a dual-axis combo chart by dragging the measure you’re interested in (in our case, Size of Audience) to the opposite axis, and change the mark type on the second Marks Shelf for SUM(Size of Audience) to Circle. If you are not familiar with building dual-axis combo charts, be sure to check out Chapter 21.
For best results, also be sure to synchronize the second axis by right-clicking the right-axis and choosing Synchronize Axis. At this point, my chart looks like this:
-
Customize the second view.
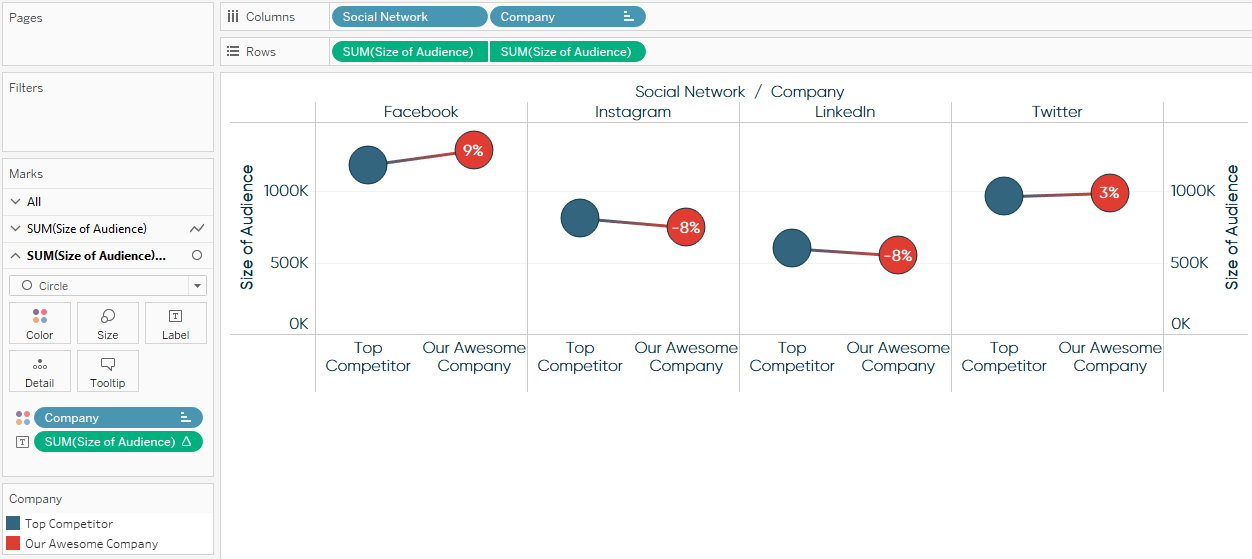
Now that we have two measures on the Rows Shelf, we have two Marks Shelves for those measures that we can edit independently of each other. This means we can keep the slope graph on one Marks Shelf, but change the size, colors, and context on the circles in the secondary Marks Shelf.
As just one example, I’ll use the circles to display the delta between ourselves and our main competitor. I will also color both the slope graphs and circles to make our brand clear on the view. Here are the steps:
-
Change the sort order so the top competitor is listed first and Our Awesome Company is listed second. This is more intuitive when you are comparing things across a table. The sort order can be changed by clicking the Company dimension on the Columns Shelf.
-
Add the Size of Audience measure to the Label Marks Card.
-
Add a quick table calculation to the Size of Audience measure for Percent Difference.
-
Edit the table calculation to compute the percent difference along Pane (Across). This will execute the table calculation for each social network column.
-
Add the Company dimension to the Color Marks Card of both the Slope Graph and the Circles (which is actually a dot plot) Marks Shelves.
After some basic formatting, I end up with this:
This is just one example, but you can use this approach with other mark types, to show different KPIs, and/or to color based on performance such as a stoplight index (discussed in Chapter 61). Slope graphs are an excellent choice for comparing two things—especially changes over two points in time—and they are made even stronger when additional context is added by leveraging a dual-axis in Tableau.