![]()
Customer Segmentation Models
In this chapter, you will learn how to build customer segmentation models in Microsoft Azure Machine Learning. Using a practical example, we present a step-by-step guide on using Microsoft Azure Machine Learning to easily build segmentation models using k-means clustering. After the models have been built, you will learn how to perform validation and deploy it in production.
Customer Segmentation Models in a Nutshell
In order for companies to compete effectively, and build products and services that sell, it is super important to figure out the target customer segments and the characteristics of each segment. Identifying customer segments is critical since it helps companies to better target their marketing campaigns to win the most profitable customers. Data analysts in companies are tasked with sifting through data from both internal and external data sources to identify the magical ingredients that will appeal to specific customer segments (which might not be known a priori).
Customer segmentation empowers companies with the ability to craft marketing strategies and execute marketing campaigns that target and appeal to specific customer segments. In addition, customer segmentation leads to greater customer satisfaction because different needs in different segmentations can be addressed appropriately.
![]() Note Learn more about market segmentation at http://en.wikipedia.org/wiki/Market_segmentation.
Note Learn more about market segmentation at http://en.wikipedia.org/wiki/Market_segmentation.
Companies must be able to master the deluge of information that is available (e.g. market research reports, concept/market testing, etc.). While this market research data provides a good balance of qualitative and quantitative information on the market, companies can compete even more effectively if they can tap the huge treasure trove of data that they already have (e.g. membership/loyalty program databases, billing data from online services/retail outlets, CRM systems, etc.). Somewhere in the treasure trove lies insights that companies can turn to their competitive advantage. These insights enable companies to be cognizant of potential customer segments and their characteristics.
For example, in the United States, many people are familiar with the use of the consumer credit score. The consumer credit score helps banks understand the risk profile of customers applying for loans (auto loans, mortgage loans, etc.). This in turn enables banks to tune their interest rates based on the risk segment to which an individual belongs.
Another example is the telecommunication industry. Many telecommunication providers strive to gain insights on how to sell effectively to their customers falling into the two broad groups, corporate business and consumers. In order to figure out effective marketing strategies for consumers, telecommunication providers are often interested in the profile of the person that uses the service. Folks with similar profiles are grouped together, and offered discounts or value-added services that appeal to that profile. A non-exhaustive list of features that a telecommunication provider considers include income group, call frequency of friends and family members, number of calls/short messages and when they happened, how they pay their monthly bill (online, self-service kiosks, physical stores), delays in payment, etc.
Amongst the different types of unsupervised machine learning techniques, k-means clustering is a common technique used to perform customer segmentation. In this chapter, you will learn how to use Microsoft Azure Machine Learning to perform k-means clustering on the Wikipedia SP 500 dataset (one of the sample datasets available in ML Studio).
The Wikipedia SP 500 dataset contains the following information: industry category, and text describing each of the 500 Standard & Poor’s (SP500) companies. You will build and deploy a k-means clustering model to perform segmentation of the companies. Due to the large number of features that are extracted from the text, you will execute an R script to perform principal component analysis to identify the top 10 features, which will be used for determining the clusters. After k-means clustering has been performed, companies that are similar to each other (based on features extracted from the companies’ descriptive text) will be assigned to the same segment.
![]() Note See Chapter 4 for an overview of the different statistical and machine learning algorithms. In the chapter, you will also learn about the categories of clustering algorithms, and how K-Means Clustering works.
Note See Chapter 4 for an overview of the different statistical and machine learning algorithms. In the chapter, you will also learn about the categories of clustering algorithms, and how K-Means Clustering works.
Building and Deploying Your First K-Means Clustering Model
To help you get started building your first k-means clustering model, you will use one of the sample experiments provided in the ML Studio. The experiment uses k-means clustering to perform segmentation of companies in the Standard & Poor’s (S&P) 500 list of companies.
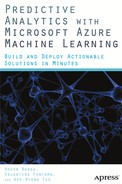
After the experiment is successfully executed, you can see that the companies (from different industry categories) have been assigned to different clusters (Figure 7-1). In this example, the k-means algorithm finds three segments labeled 0, 1, and 2 on the x-axis. In each of the square boxes, you will see the number of companies from each category that has been assigned to a cluster. In Cluster 2, you can see that there is 1 company from the Consumer Discretionary category.
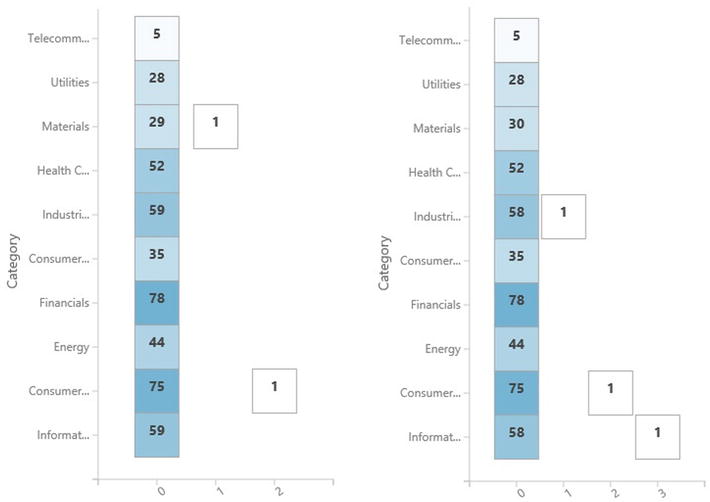
Figure 7-1. Segmentation of the companies
Let’s get started! For this exercise, let’s use the sample experiment called Sample Experiment - S & P 500 Company Clustering - Development (shown in Figure 7-2). From Figure 7-3 , you will see that the experiment consists of the following steps.
- Retrieve the data from the Wikipedia SP 500 dataset.
- Perform feature hashing of the data to vectorize the features.
- Execute an R script to identify the principal components of the features.
- Project the columns that will be used in the clustering model.
- Train the clustering model using two k-means clustering models. For each of the k-means clustering models, different numbers of clusters are specified.
- Convert the results to a CSV file.
In this section, you will learn how to perform segmentation of the companies.
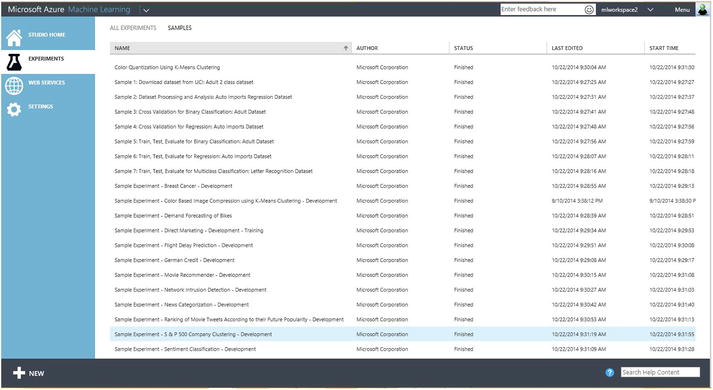
Figure 7-2. Experiment samples in ML Studio
Figure 7-3. Creating your first k-means clustering model in ML Studio
In machine learning, the input feature(s) can be free text. A common approach to representing free text is to use a bag of words. Each word is represented as a token. Every time the word appears in the text, a 1 is assigned to the token. And if the word does not appear, a 0 is assigned.
However, the bag of words model will not scale because the number of possible words is not known beforehand. Imagine representing a token for every word in the descriptive text of each S&P 500 company. The dimensionality of the inputs can be potentially large. Hence, a common approach is to use a hash function to transform all the tokens into numerical features, and restrict the range of possible hash values. To do this, feature hashing (also known as the “hashing trick”) is commonly used in machine learning communities to prepare the dataset before it is used as input for machine learning algorithms.
In this example, the Feature Hashing module is used to perform hashing on the descriptive text of the S&P 500 companies. Underneath the hood, the Feature Hashing module uses the Vowpal Wabbit library to perform 32-bit murmurhash hashing. For this exercise, the hashing bit size is set to 12, and N-grams. After the Feature Hashing module has executed, you will see that the descriptive text has been converted into a large number of columns, with column names prefixed with Text_HashingFeature_ (shown in Figure 7-4).
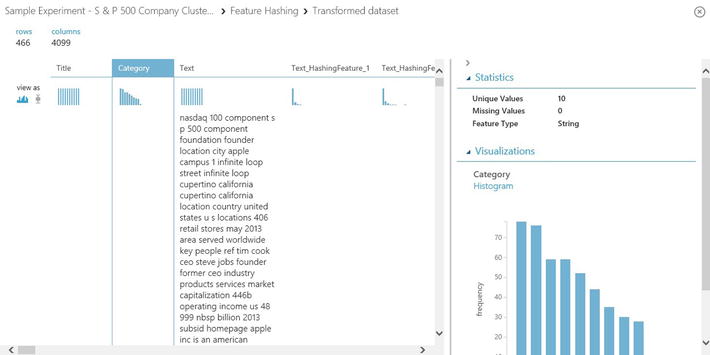
Figure 7-4. Feature hashing
![]() Note The Vowpal Wabbit library is an open source machine learning library. See https://github.com/JohnLangford/vowpal_wabbit/wiki/Tutorial for more information.
Note The Vowpal Wabbit library is an open source machine learning library. See https://github.com/JohnLangford/vowpal_wabbit/wiki/Tutorial for more information.
MurmurHash is a family of non-cryptographic hash functions that provide a good distribution, avalanche behavior, and collision resistance. See https://code.google.com/p/smhasher/ for more information on the MurmurHash family of hash functions.
Identifying the Right Features
When using a k-means cluster for customer segmentation, you will need to identify the features that will be used during the clustering process. After feature hashing has been performed, a large number of features will have been computed based on the descriptive text.
Principal Components Analysis (PCA) is a powerful statistical technique that can be used for identifying a smaller number of features (i.e. principal components) that captures the key essence of the original features.
In this sample experiment, you will learn how to perform principal component analysis using R. Specifically, you will be using the Execute R Script module to execute the following R script (which has been provided as part of the sample experiment).
# Map 1-based optional input ports to variables
dataset1 <- maml.mapInputPort(1) # class: data.frame

# Sample operation
titles_categories = dataset1[,1:2]
pca = prcomp(dataset1[,4:4099])
top_pca_scores = data.frame(pca$x[,1:10])
data.set = cbind(titles_categories,top_pca_scores)

# You'll see this output in the R Device port.
# It'll have your stdout, stderr and PNG graphics device(s).
plot(pca)

# Select data.frame to be sent to the output Dataset port
maml.mapOutputPort("data.set");
From the R script, you will notice that the R function prcomp is used. The input to prcomp includes column 4 to 4099 of dataset1. The computed results are stored in the variable pca. For this sample experiment, you obtain the top 10 principal components, and use these as inputs to the k-means clustering algorithm.
After you have run the experiment, you can click on the Execute R Script module, and choose to visualize the result dataset. Figure 7-5 shows the result dataset, and the top 10 principal components (PC) that are computed.
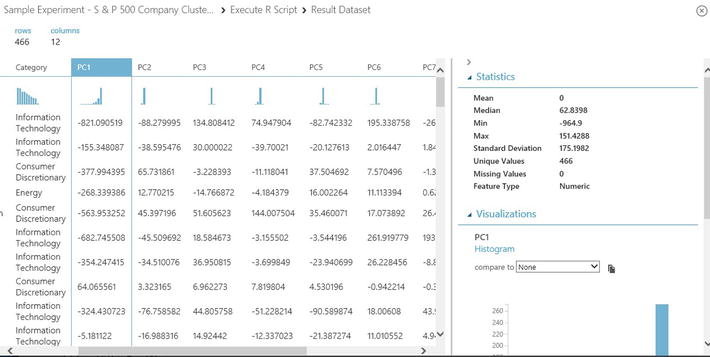
Figure 7-5. Visualization of the result dataset (top 10 principal components for the dataset)
![]() Note Refer to http://en.wikipedia.org/wiki/Principal_component_analysis to learn more about PCA.
Note Refer to http://en.wikipedia.org/wiki/Principal_component_analysis to learn more about PCA.
In R, there are several functions that can be used for performing PCA. These include pca(), prcomp(), and princomp(). prcomp() is commonly used because it is numerically more stable, and returns an R object with the following information: eigenvectors, square root of the eigenvalues, and scores.
See Chapter 3 for learning more on how you can use R with Azure Machine Learning.
Properties of K-Means Clustering
From Figure 7-3, you will see that k-means clustering is used twice in the experiment. The main difference between the two k-means clustering modules is the number of centroids (i.e. value of k). This is also the same as the number of segments or clusters you want from the k-means algorithm. For the left k-means clustering, the sample experiment has specified that the value of k to be 3 (i.e. the k-means clustering model will identify 3 clusters); whereas the right k-means clustering model specified the value of k to be 4.
You can see the number of centroids specified by clicking on each of the k-means clustering rectangles. Figure 7-6 shows the various properties of the K-Means clustering model, which include
- Number of centroids
- Metric: Metric is used to compute the distance between clusters
- Initialization: The method use to specify the seed the initial centroids
- Iterations: The number of iterations used
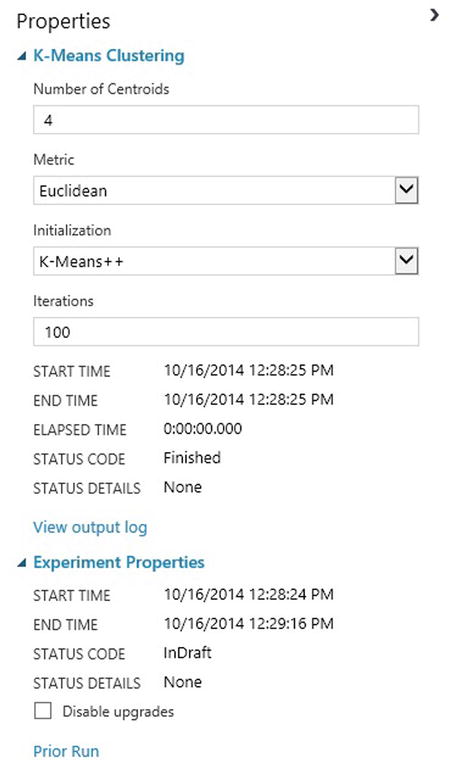
Figure 7-6. Properties of the k-means clustering model
When performing clustering, the user will need to specify the distance measure between any two points in the space. In ML Studio, this is defined by the Metric property. Two distance measures are supported: Euclidean (also known as L2 norm) and cosine distance. Depending on the characteristics of the input data and the use case, the user should select the relevant Metric property used by k-means clustering.
![]() Note When performing clustering, it is important to be able to measure the distance (or similarity) between points and vectors. The Euclidean and cosine distances are common distance measures that are used.
Note When performing clustering, it is important to be able to measure the distance (or similarity) between points and vectors. The Euclidean and cosine distances are common distance measures that are used.
Euclidean distance: Given two points, p1 and p2, the Euclidean distance between p1 and p2 is the length of the line segment that connects the two points. The Euclidean distance can also be used to measure the distance between two vectors.
Cosine distance: Given two vectors v1 and v2, the cosine distance is the cosine of the angle between v1 and v2.
The choice of the distance measure to use is often domain-specific.
Euclidean distance is sensitive to the scale/magnitude of the vectors that are compared. It is important to note that even though two vectors can be relatively similar, but if the scale of the features are significantly different, the Euclidean distance might show that the two vectors are different. In such cases, cosine distance is often used, since regardless of the scale, the cosine angle between the two vectors would have been small.
After selecting the metric for the distance measure, you will need to choose the centroid initialization algorithm. In Azure Machine Learning, this is defined by the Initialization property. Five centroid initialization algorithms are supported. Table 7-1 shows the different centroid initialization algorithms.
Table 7-1. K-means Cluster, Centroid Initialization Algorithms
|
Centroid Initialization Algorithm |
Description |
|---|---|
|
Default |
Picks first N points as initial centroids |
|
Random |
Picks initial centroids randomly |
|
K-Means++ |
K-means++ centroid initialization |
|
K-Means+ Fast |
K-means++ centroid initialization with P:=1 (where the farthest centroid is picked in each iteration of the algorithm) |
|
Evenly |
Picks N points evenly as initial centroids |
These properties have already been pre-configured for you in the sample experiments.
At this point, you are ready to run the experiment. Click Run on the bottom panel of ML Studio. Once the experiment has successfully executed, two sets of clusters have been produced. The Metadata Editor module is used to change the metadata associated with columns in the dataset to include the assigned cluster. In addition, the Convert to CSV module is used to convert the results to comma-separate values, which allows you to download the result set.
Congratulations! You have successfully run your first company segmentation experiment using the K-Means Clustering module in ML Studio.
Customer Segmentation of Wholesale Customers
From the earlier section, you learned the key modules used in the sample experiment (K-Means Clustering, Train Clustering Model) to perform customer segmentation.
In this section, you will learn step-by-step how to build the clustering model to perform customer segmentation for a wholesale customer dataset.
![]() Note The wholesale customers dataset is available on the UCI Machine Learning Repository. The dataset contains eight columns (referred to as attributes or features) and contains information on the customers of a wholesale distributor, operating in different regions.
Note The wholesale customers dataset is available on the UCI Machine Learning Repository. The dataset contains eight columns (referred to as attributes or features) and contains information on the customers of a wholesale distributor, operating in different regions.
The columns include annual spending on fresh milk, grocery, frozen, detergents, paper, and delicatessen products. In addition, it also includes information on the channel of the customer (hotel/café/restaurant) or retail.
Refer to http://archive.ics.uci.edu/ml/datasets/Wholesale+customers.
Loading the Data from the UCI Machine Learning Repository
Let’s get started by using a Reader module to retrieve the data from the UCI Machine Repository. To do this, drag and drop a Reader module (Data Input and Output) from the toolbox. Next, configure the Reader module to read from the Http source, and provide the URL for the dataset: http://archive.ics.uci.edu/ml/machine-learning-databases/00292/Wholesale%20customers%20data.csv
Figure 7-7. shows the Reader module and its configuration.

Figure 7-7. Using the Reader module to read data from a HTTP data source
Using K-Means Clustering for Wholesale Customer Segmentation
For this experiment, you will use all eight columns from the dataset as inputs for performing clustering. To do this, drag and drop the K-Means Clustering and Train Clustering Model, and connect the modules together based on what is shown in Figure 7-8.
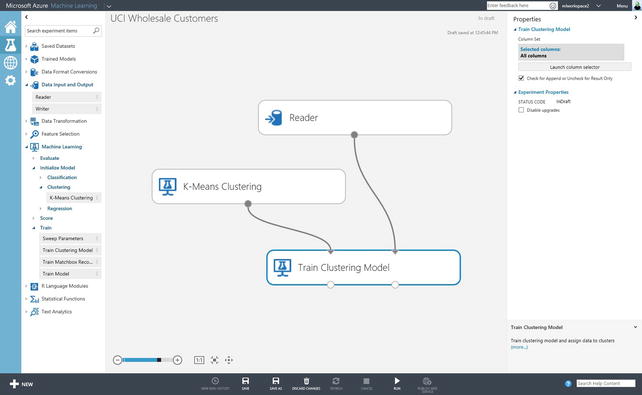
Figure 7-8. Using K-Means Clustering and the Train Clustering model
To configure each of the modules, click on the module, and specify the values using the Properties pane on the right side of the screen. For the K-Means Clustering module, configure it to identify four clusters (Number of Centroids = 4), and use the Euclidean distance measure. Use the default 100 number of iterations. For the Train Clustering Mode module, configure it to use all the features when performing clustering.
Finally, you will want to visualize the results after the experiment has run successfully. To do this, you will use the Metadata Editor module. Configure the Metadata Editor such that it uses all the features that are produced by the Train Clustering Model module. Figure 7-9. shows the final design of the clustering experiment.
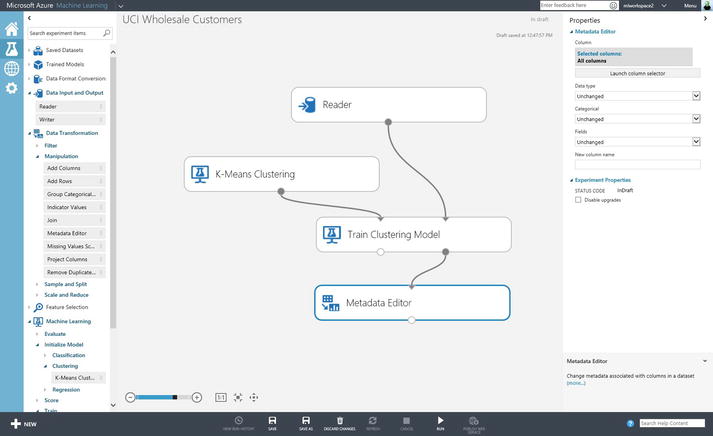
Figure 7-9. Completed experiment to perform wholesale customer segmentation
After the experiment has successfully run, you will be able to right-click the Results dataset output of the Metadata Editor module to see the cluster assignment (shown in Figure 7-10).
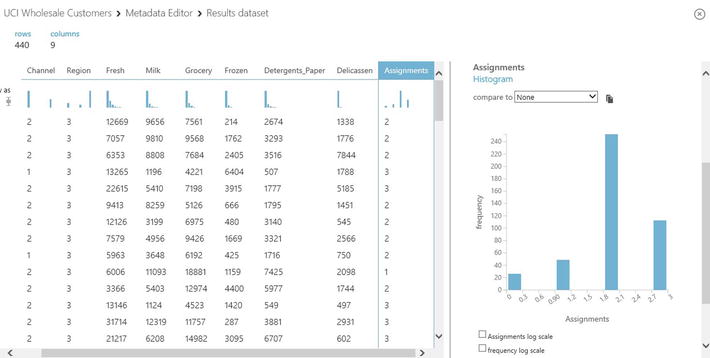
Figure 7-10. Histogram showing cluster assignments for wholesale customers
Cluster Assignment for New Data
What happens if you have new customers, and you want to assign them to one of the clusters that you identified? In this section, you will learn how to use the Assign to Cluster module.
In this example, you will first split the input dataset into two sets. The first set will be used for training the clustering model, and the second set will be used for cluster assignments. For practical use cases, the second dataset will be new data that you have newly acquired (e.g. new customers whom you want to assign to a cluster). To split the input dataset, you will use the Split module (in Data Transformation ![]() Sample and Split), and configure it such that it redirects 90% of the input data to its first output, and the remaining 10% to the second output. You will use the data from the first output of the Split module to train the clustering model.
Sample and Split), and configure it such that it redirects 90% of the input data to its first output, and the remaining 10% to the second output. You will use the data from the first output of the Split module to train the clustering model.
Figure 7-11 shows the modified clustering experiment design where you added the Assign to Cluster and Split modules. To configure the Assign to Cluster module, click the module, and click the Launch column selector to select all columns. Link the output of the Assign to Cluster module to the Metadata Editor module. When a new observations is made, it is assigned to the cluster whose centroid has the closest distance.
You are now ready to run the experiment to perform cluster assignment. After the experiment has run successfully, you can visualize the results by right-clicking the Results dataset of the Metadata Editor module, and choosing Visualize.
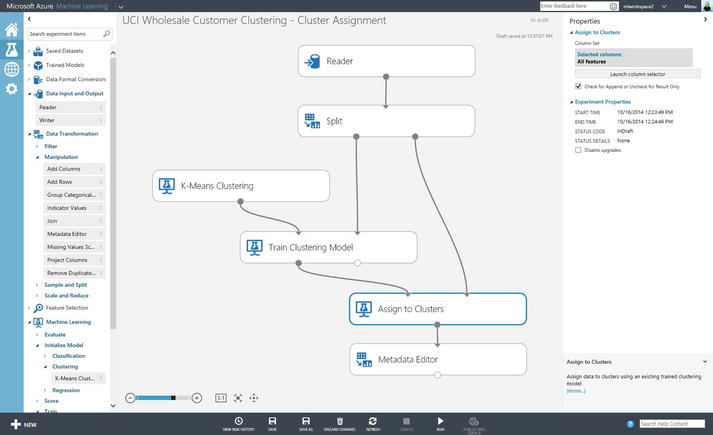
Figure 7-11. Experiment to perform cluster assignment using the trained clustering model
Congratulations! You have successfully built a k-means clustering model, and used the trained model for assigning new data to clusters.
Summary
In this chapter, you learned how to create a k-means clustering model using Azure Machine Learning. To jumpstart the learning, you used the sample experiment that is available in Azure Machine Learning, which performs segmentation of S&P 500 companies (based on each companies’ descriptive text). You learned about the key modules that are available in ML Studio for performing clustering: K-Means Clustering and the Train Clustering Model. You learned how to use feature hashing to vectorize the input (which consists of free text), and PCA to identify the principal components.
In addition, you learned the steps to perform k-means clustering on a wholesale customer dataset, and how to use the trained model to perform cluster assignments for new data.