
Chapter 13
Intrusion Detection Systems and Network Security
Lab Exercises
13.01 Installing Ubuntu and Snort
13.02 Snort Sniffer Mode
13.03 Snort Packet Logger Mode
13.04 Snort Network Intrusion Detection System Mode
Lab Analysis
Key Term Quiz
After stateless packet filter firewalls such as access control lists (ACLs) weed out undesirable traffic going into a network, there will still be malicious packets inside the network. Two issues are at work here. The first is that firewalls are just a single part of a more complex defense-in-depth architecture. Malicious packets can, and will, regularly evade firewalls. The second issue is that malicious traffic originating from inside the network is never checked by a network-based firewall, which sits on the perimeter of the network, because the malicious traffic is already inside the network!
![]() Cross-Reference
Cross-Reference
ACLs were covered in Chapter 10.
Think of the firewall as a TSA (Transportation Security Administration) agent inspecting your boarding pass and ID at the airport, as you go through security checks before you go to your gate. The TSA agent is checking what is really the equivalent of the source IP address (who you are and where you live), the destination IP address (to whom and where you’re flying to), the protocol (your airline), and the port (your flight number). The TSA agent is using a set of preconfigured rules (like a firewall) and might ask you questions about yourself, the flight, or the destination. An intrusion detection system (IDS) or intrusion prevention system (IPS) would be the security guard on the other side by the gates where travelers wait to board their planes.
A passenger who got past the initial screening might start causing problems by the gate, possibly getting loud and violent over the delay of a flight. They might even be entering areas restricted for airport employees. The TSA agent (the firewall) who looked at their boarding pass can’t help at this point. The problem exists beyond that location now. The security guard (the IDS or IPS) must now step in. IDSs and IPSs require more logic and learning, and they have to make decisions as to where certain lines were crossed and then take appropriate actions.
The TSA agent (the firewall) examining boarding passes is still a very necessary component. If everyone was just let through to the gates, the airport guards would be overwhelmed and wouldn’t be able to monitor all potential passengers. The firewall weeds out traffic that shouldn’t go in the network, but the IDS or IPS adds a new dimension for anything that made it past the first screening.
IDSs and IPSs help mitigate the two issues mentioned at the start of the chapter. An IDS is out of band and simply gets copies of network traffic. It can be a system getting copies of traffic to inspect through port mirroring, also known as SPAN (Switched Port Analyzer). This involves a switch that is configured to send copies of all traffic going in and out of the switch’s ports connected to end stations to the port where a machine running the IDS is located. This will allow the IDS to see all network traffic, including internal data flowing between company servers and clients, as well as Internet traffic.
Alternatively, the IDS can be connected to a network tap, a dedicated hardware device, usually placed between the network-based firewall and a switch. With this topology, all incoming and outgoing traffic can be seen by the IDS. SPAN ports can get overloaded, and packets could be dropped before reaching the IDS. Frames with errors will be lost, too. Using a network tap instead of a SPAN port guarantees that every packet will be seen, regardless of bandwidth, errors, or anything else.
An IPS is inline, so original traffic must pass through the IPS, and could potentially bring it down, causing a denial of service (DoS), as opposed to the out-of-band IDS. Furthermore, since the IDS is out of band, it doesn’t add latency. An IPS adds some latency since it is in line with the traffic that has to go through. However, an IPS can stop malicious traffic as soon as it sees it, whereas an IDS can’t.
Both an IDS and an IPS, though, could automatically notify other devices, such as a firewall, to block certain traffic earlier based on observed packets. IDSs and IPSs require more logic and learning than firewalls.
The obvious question is, if an IPS can do what an IDS can do, but better, why does an IDS still exist today? The answer is that an IDS is like a window into your network traffic. It sits, listens, and collects data that can be used for monitoring, analysis, and forensic investigations. You can think of an IDS as a visibility device, whereas an IPS is a control device. Packets collected by the IDS can be subsequently analyzed to gain insight into past or even possible future violations when lots of traffic and events are linked together.
Both IDSs and IPSs are vulnerable to false positives, which is when benign traffic is flagged as malicious, and false negatives, which is when malicious traffic is flagged as benign. IDSs and IPSs need to be constantly tuned to minimize both false positives, which will send out lots of incorrect alerts, and false negatives, which won’t send out alerts when something malicious is happening. Since IDSs are out of band, a false positive won’t stop legitimate traffic in its tracks, which is another reason why they’re used together with IPSs to form a great defense-in-depth setup.
An IDS can also be programmed to just alert an administrator, instead of telling a firewall to block certain traffic. This is preferred by administrators who want just the alert and the ability to take action on their own, instead of letting an IDS make a decision for them.
IDSs and IPSs, like firewalls, can be either host based or network based. In fact, thus far, we’ve actually been talking about network-based IDS (NIDS) and network-based IPSs (NIPS). A host-based IDS (HIDS) or a host-based IPS (HIPS) resides on a particular computer and monitors activity on just that host system. It benchmarks and monitors the access, creation, modification, and deletion of key system files as well as the Windows registry. Unlike a network-based IDS or IPS, a host-based one can deal with encrypted traffic that will have been decrypted on the host for processing. It can also detect attacks that may even elude a network-based IDS or IPS. As you can imagine, a host-based IDS or IPS does slow a system down. The difference between a HIDS and a HIPS is that a HIDS doesn’t stop network traffic in its tracks, whereas a HIPS does.
Just like a network-based IDS or IPS can catch malicious traffic that either evaded the network-based firewall or originated from within the network, a host-based IDS or a host-based IPS can catch malicious traffic that either evaded the host-based firewall or originated from the inside of the machine.
Signature-based IDSs and IPSs act just like anti-malware software, trying to detect attacks by looking for patterns (for example, with certain instructions on a host machine or certain usages of protocols). The obvious problem is that unknown patterns can’t be detected, and adversaries are constantly changing their code to avoid simple signature detection. Furthermore, the signature database needs to be updated constantly. Anomaly-based IDSs and IPSs compare and establish baselines to something that might be malicious. However, false positives and false negatives are big issues that need to be dealt with through monitoring and tweaking. The latest anomaly-based IDSs and IPSs can detect malicious insiders as well as machines or accounts that have been compromised from outsiders.
One of the most popular IDSs used today is Snort, which could be used as either a network-based IDS or a network-based IPS. Snort is supported on many hardware platforms and operating systems, including Windows, Linux, and MacOS. Even though Snort runs on a host machine, it is not considered a host-based IDS/IPS but rather a network-based IDS/IPS, since it’s still monitoring network-related traffic.
Snort’s website (www.snort.org/faq/what-is-snort) describes the software as “an open source network intrusion prevention system capable of performing real-time traffic analysis and packet logging on IP networks. It can perform protocol analysis, content searching/matching, and can be used to detect a variety of attacks and probes, such as buffer overflows, stealth port scans, CGI attacks, SMB probes, OS fingerprinting attempts, and much more.”
In fact, in 2009, Snort, upon entering InfoWorld’s Open Source Hall of Fame, was described as one of the greatest pieces of open-source software of all time.
![]() 30 MINUTES
30 MINUTES
Lab Exercise 13.01: Installing Ubuntu and Snort
Kali Linux is a great Linux distribution for pentesting and hacking (for good or bad), but it isn’t supposed to be used as a day to day operating system, especially one that runs an IDS. Ubuntu is a great Linux distribution that’s often used as the operating system that runs Snort, so let’s add Ubuntu to our infrastructure and then install Snort on it.
Learning Objectives
In this lab exercise, you’ll install Ubuntu and Snort. At the end of this lab exercise, you’ll be able to
• Use an Ubuntu VM for running Snort as an IDS/IPS
• Get started with Snort
Lab Materials and Setup
The materials you need for this lab are
• The Principles of Computer Security: CompTIA Security+ and Beyond textbook
• A web browser with an Internet connection
• VMware Workstation Player, which you installed in Chapter 1
Let’s Do This!
You’re going to install Ubuntu and Snort in this lab exercise. The process for installing Ubuntu is similar to how you installed Kali Linux in Chapter 1.
![]() 1v
1v
Step 1 Download an Ubuntu ISO and install the OS through VMware Workstation Player.
a. Go to https://ubuntu.com/.
b. Click the Download link in the menu at the top of the page.
c. Under Ubuntu Desktop, click the current version. At the time of publication, it is 20.04 LTS.
d. The download should start automatically, but if it doesn’t, click the Download Now hyperlink at the top.
e. Run VMware Workstation Player.
f. Click Create a New Virtual Machine.
g. With the Installer Disc Image File (ISO): radio button selected, browse to the Ubuntu ISO, which will be in your Downloads folder. Click Next.
h. Provide the easy install information, including full name, username, password, and password confirmation. Click Next.
i. In the textbox, change or keep the name of Ubuntu 64-bit and then click Next.
j. Keep the default maximum disk size but select the Store Virtual Disk As a Single File radio button instead of using the default selection. Click Next.
k. Click Customize Hardware….
l. On the left, select Network Adapter and select the radio button Bridged: Connected Directly To The Physical Network and the checkbox Replicate Physical Network Connection State.
m. Feel free to increase the VM’s RAM, if desired, by clicking Memory and increasing the allocated memory.
n. Click Close and then click Finish.
o. After some verification checks and the copying of files, the installation will start.
p. When the installation completes, click your username, provide your password, and press ENTER to log in.
q. Click Skip at the top right of the Online Accounts screen.
r. Click Next at the top right on the Livepatch screen.
s. Click the radio button next to No, Don’t Send System Info and then click Next at the top right of the screen.
t. Click Next at the top right of the Privacy screen.
u. Click Done in the top right of the Ready to Go screen.
v. If the Software Updater pops up, click the Install Now button. When prompted, provide your password. Then, when you see The Computer Needs to Restart to Finish Installing Updates, click Restart Now. After the VM reboots, log in once again.
![]() 2e
2e
Step 2 Download and install Wireshark and Snort.
a. Press CTRL-G or click in the VM to work in the VM. Press CTRL-ALT to return focus to the host machine.
b. In the Ubuntu VM, click the Show Applications button at the bottom of the Ubuntu Launcher Bar on the left of the screen. Click in the search bar, type Terminal, and click the Terminal icon. Alternatively, pressing CTRL-ALT-T will open up a terminal.
c. Execute the following two commands. The first downloads package information from every configured source. The second upgrades all installed packages to their latest versions.
sudo apt update
sudo apt upgrade
d. Unlike Kali Linux, Ubuntu does not come with Wireshark, the world-renowned packet sniffer. Execute the following to command to download and install it:
sudo apt install wireshark
Put in your password and press ENTER when prompted now and throughout this chapter.
Type Y and press ENTER when prompted to continue.
At the “Should Non-superusers Be Able to Capture Packets?” question, press the left arrow to select Yes and then press ENTER.
e. Enter the following command to download and install Snort:
sudo apt install snort
Type Y and press ENTER when prompted to continue.
At the Configuring Snort screen, press ENTER to select OK.
In the Interface(s) Which Snort Should Listen On: textbox, using BACKSPACE, change the eth0 entry to ens33, which is the interface name used by Ubuntu. Press ENTER to select OK.
If you see an Invalid Interface message, press ENTER to select OK. You’ll be brought back to the first screen again. Once again, press ENTER to select OK, and then press ENTER again to select OK with ens33 still in the textbox from before. You’ll get that Invalid Interface message again. Press ENTER to select OK. This time, the installation completes. This is a known bug for this version of Snort at the time of writing, and it may be resolved by the time you’re doing this lab exercise. Even with that pushback from the Snort installer, Snort has been successfully installed.
![]() 30 MINUTES
30 MINUTES
Lab Exercise 13.02: Snort Sniffer Mode
Just like Wireshark, Snort can sniff packets. The fields and values that Snort sniffs are displayed to the console in Sniffer mode.
Learning Objectives
In this lab exercise, you’ll use Snort as a packet sniffer. At the end of this lab exercise, you’ll be able to
• Sniff packets with Snort through the console
• Change the output that gets sent to the console in Sniffer mode
Lab Materials and Setup
The materials you need for this lab are
• The Principles of Computer Security: CompTIA Security+ and Beyond textbook
• A web browser with an Internet connection
• The Ubuntu VM and Snort, which you installed in Lab Exercise 13.01
• The Windows 10 VM you installed in Chapter 1 or the Windows 10 host machine
Let’s Do This!
In the Ubuntu VM, press CTRL-ALT-T to open up a new console. Press ENTER after every command.
![]() 1a–1c
1a–1c
Step 1 Examine the Snort help output and man page entry, as well as the version of Snort.
a. Look at the Snort help output:
snort -h | less
Advance line by line by pressing ENTER. Advance page by page with the spacebar. You can use the up and down arrows to move back and forth. Type q to quit.
b. Check out the man page entry for Snort:
man snort
c. See the version number of Snort:
snort -V
![]() 2a–2d
2a–2d
Step 2 Get your VM’s IP address and start using Snort, generating output of certain Layer 3 and (if applicable) Layer 4 header information.
![]() Note
Note
The layers referenced here are from the OSI (Open Systems Interconnection) model.
a. Find the Ubuntu VM’s IP address by entering the following command:
ip a
It’s listed after inet in the ens33 interface section.
b. Enter the following command:
sudo snort -v
The following is from the Snort man page:
-v Be verbose. Prints packets out to the console. There is one big problem with verbose mode: it’s slow. If you are doing IDS work with Snort, don’t use the ‘-v’ switch, you WILL drop packets
Snort runs and only displays information from the Layer 3 header, although not all fields and values are included. Snort will also display port numbers from Layer 4 headers when TCP or UDP is used.
Ignore the “WARNING: No preprocessors configured for policy 0.” message that’s repeatedly shown. We will fix that shortly. Any packet going in and out of the Ubuntu VM will be displayed in the console.
You can stop Snort with CTRL-C. It might take a few seconds for Snort to stop and for information such as the following to be displayed: how long Snort ran for, how many packets it processed, the number of packets per minute and packets per second, memory usage summary, packet I/O totals, and a breakdown by protocol.
c. Enter the following command:
sudo snort -v -i ens33
If you had multiple interfaces, the -i option would be the way to specify a certain interface that Snort should sniff on. Try it now, although with the current setup featuring one non-loopback interface, the same thing will happen with or without the -i option.
From the Windows 10 VM or host machine, ping the IP address of the Ubuntu VM. You should be able to see the pings in the output of Snort, as shown in Figure 13-1. Break out with CTRL-C.

FIGURE 13-1 Internet Control Message Protocol (ICMP) sniffed in Snort
d. Enter the following command:
sudo snort -v -i lo
To see the difference, open up a new terminal, ping the loopback address (127.0.0.1), and observe the output in the terminal in which Snort is sniffing.
You can break out with CTRL-C.
![]() 3a–3c
3a–3c
Step 3 Run Snort, generating upper layer data, in addition to Layer 3 and Layer 4 header information.
a. Enter the following command:
sudo snort -vd
The following is from the Snort man page:
-d Dump the application layer data when displaying packets in verbose or packet logging mode.
After running Snort with the -v and -d options together (-vd), stop Snort with CTRL-C.
Snort runs and shows the upper layer data, in addition to information from Layer 3 and Layer 4 (when TCP or UDP is used), as shown in Figure 13-2.
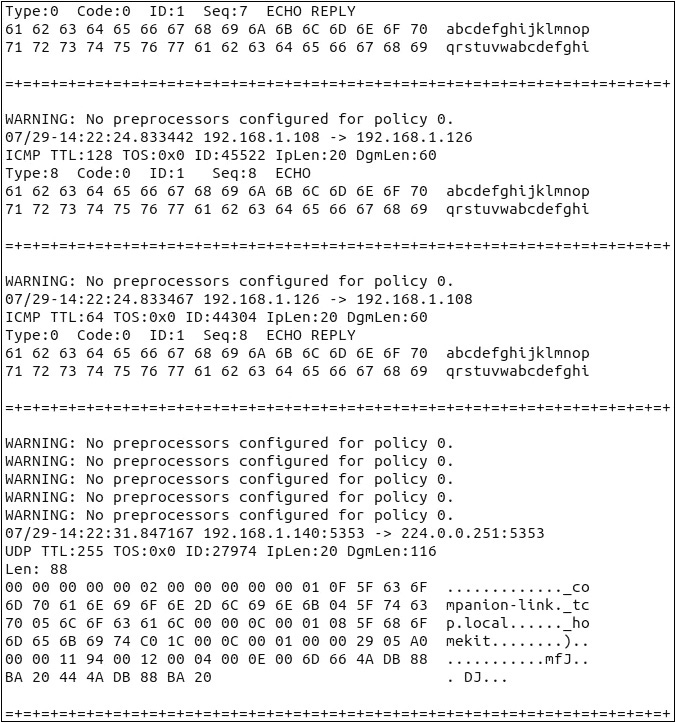
FIGURE 13-2 Snort showing Layer 7 data
b. Enter the following command:
sudo snort -ve
The following is from the Snort man page:
-e Display/log the link layer packet headers.
After running Snort with the -v and -e options together (-ve), stop Snort with CTRL-C.
Snort runs and shows information from Layer 2, in addition to information from Layer 3, as shown in Figure 13-3.

FIGURE 13-3 Snort showing Layer 2 information
c. Enter the following command:
sudo snort -vde
After running Snort with the -v, -d, and -e options together (-vde), stop Snort with CTRL-C.
Snort runs and shows header information from Layer 2, Layer 3, and upper layer data.
The switches could have been typed separately, and in a different order, for the same results, like this:
sudo snort -d -v -e
Furthermore, the -v option becomes redundant with either the -d or -e option. In other words, if you were to leave off the -v option, sudo snort -de would have done the same thing.
Figure 13-4 shows the output.

FIGURE 13-4 Snort showing header information from Layer 2, Layer 3, and upper layer data
![]() 30 MINUTES
30 MINUTES
Lab Exercise 13.03: Snort Packet Logger Mode
You can instruct Snort to record packets to a file by using the -l option and specifying a directory that the log should be sent to. Then the log file can be opened up in a packet sniffer, like Wireshark.
Learning Objectives
In this lab exercise, you’ll sniff with Snort, but instead of viewing the output in the console, you’ll log the packets to a file. At the end of this lab exercise, you’ll be able to
• Sniff with Snort, logging packets to a file
• Open the logs with Wireshark and see what Snort sniffed
Lab Materials and Setup
The materials you need for this lab are
• The Principles of Computer Security: CompTIA Security+ and Beyond textbook
• A web browser with an Internet connection
• The Ubuntu VM and Snort, which you installed in Lab Exercise 13.01
• The Windows 10 VM you installed in Chapter 1 or the Windows 10 host machine
Let’s Do This!
In the Ubuntu VM, press CTRL-ALT-T to open up a new terminal. Press ENTER after every command.
![]() 1a, 1b
1a, 1b
Step 1 Log packets that Snort sniffs to a file.
a. Enter the following command:
sudo snort -l .
![]() Note
Note
The dot at the end of the command represents the current directory.
The following is from the Snort man page:
-l log-dir
Set the output logging directory to log-dir. All plain text alerts and packet logs go into this directory. If this option is not specified, the default logging directory is set to /var/log/snort.
You don’t need -v, -d, or -e, contrary to documentation out there, including Snort’s own documentation.
b. Send a ping from the Windows 10 VM or host machine to the Ubuntu VM running Snort.
Stop Snort with CTRL-C.
![]() 2a, 2b
2a, 2b
Step 2 Examine the logged packets.
a. Enter the following command:
ls
See the name of the log file generated.
b. Enter the following command:
sudo wireshark snort.log.159604382
Wireshark and packet sniffing in general were introduced in Chapter 12 and will be explored further in this and future chapters. For now, simply open up the logged packets in Wireshark. In the display filter bar (where it says “Apply a display filter…”), type icmp and press ENTER to see just the pings from Step 1b.
![]() 60 MINUTES
60 MINUTES
Lab Exercise 13.04: Snort Network Intrusion Detection System Mode
In Network Intrusion Detection System (NIDS) mode, Snort monitors network traffic and analyzes the traffic against a user-defined ruleset that’s stored in a configuration file. Snort will then perform specific actions, based on what has been identified. In this mode, Snort logs and generates alerts for packets matching certain rules.
Snort consists of many components. First is a packet decoder, which determines the protocols used in the frame, like Ethernet at Layer 2, IP at Layer 3, and TCP or UDP at Layer 4. The decoder saves this information with the upper layer data, like DHCP, DNS, FTP, HTTP, SSH, TLS, and their sizes. The decoder also looks for errors, or anomalies, in the fields of these headers.
If Snort is running in inline IPS mode, rules configured in the snort.conf configuration file can even cause packets to be dropped if they’re malicious or malformed. For example, if the Ethernet Type field indicates an IPv4 packet is encapsulated inside of a frame, but the size of the IP header that was captured is less than the 20-byte minimum length for an IPv4 header, Snort will generate an alert and move the packet out of the decoding phase.
The second component consists of multiple preprocessors that arrange and modify packets before they are sent to the detection engine for analysis. Some preprocessors detect some basic anomalies by defragmenting packets that attackers have fragmented, for deception purposes. They can also perform HTTP URL decoding, if attackers used hexadecimal characters in the URL for deception purposes. Preprocessors are specialized. Some can detect and log port scanning activities, while others can detect anomalies in ARP frames to identify ARP spoofing. A preprocessor can arrange a string so that it is detectable by the IDS. A string of scripts ansomware, representing a directory, can be arranged many different ways; for example, all of the following directory references will get malware to the same scripts ansomware directory on a Windows system regardless of the number of . (current directory) instances or even the direction of the slashes:
scripts. ansomware
scripts.. ansomware
scripts/././ransomware
scripts..... ansomware
scripts./../../ransomware
![]() Note
Note
From a Windows command prompt or PowerShell (but not when typing after clicking the Start button or in the search box), even though Windows uses backslashes, either a forward slash or backslash will work as a valid directory reference, as shown in the above examples. For more background on slashes, read this interesting article, “Why Windows Uses Backslashes and Everything Else Uses Forward Slashes”:
www.howtogeek.com/181774/why-windows-uses-backslashes-and-everything-else-uses-forward-slashes/
As shown in the earlier examples, to try to fool an IDS or an IPS, an attacker can change the directory reference in an infinite amount of ways. However, the preprocessor won’t be fooled and will rearrange small variations made by the attacker to escape detection. Then the preprocessor will subsequently identify the traffic as malicious.
The third component, the detection engine, is in fact the heart and soul of Snort. It analyzes all packets for indications of intrusion using certain predefined rules. Rules can be applied to all protocols at all layers.
Unlike ACL behavior, if a packet doesn’t meet a predefined rule, it’s ignored. In the first version of Snort, like in the processing of ACLs, the first rule to match was used, which would log the packet and generate an alert. The packet wasn’t put up against other Snort rules. Snort version 2.0 changed that behavior. Now all rules are put up against the packet before generating an alert and log entry. If Snort is running as an IPS, the packet can be dropped as well. After all rules are checked, if there are multiple matches, the highest priority rule is used. There are some factors that could influence how the time-critical detection engine behaves, including the number of rules, the power of the machine on which Snort is running, the speed of the internal bus used in the Snort machine, and the load on the network.
The fourth component, the logging and alerting system, will hear from the detection engine about an intrusion and generate a log entry and alert.
The fifth component, output modules or plug-ins, controls the type of output produced by the logging and alerting system. Options include generating log reports, logging alert reports in a file, sending SNMP (Simple Network Management Protocol) traps, logging to a MySQL database, sending a message to a syslog server, generating Extensible Markup Language (XML) output, modifying configurations on routers and firewalls, and sending Server Message Block (SMB) messages.
Learning Objectives
In this lab exercise, you’ll use Snort in its most beneficial and effective way. At the end of this lab exercise, you’ll be able to
• Edit the Snort configuration file
• Create your own custom Snort configuration file
• Explore the various rules that come with Snort
• Configure your own custom Snort rules
• Implement Snort as an IDS
• Analyze the results
Lab Materials and Setup
The materials you need for this lab are
• The Principles of Computer Security: CompTIA Security+ and Beyond textbook
• A web browser with an Internet connection
• The Ubuntu VM and Snort you installed in Lab Exercise 13.01
• The Windows 10 VM you installed in Chapter 1 or the Windows 10 host machine
Let’s Do This!
In the Ubuntu VM, press CTRL-ALT-T to open up a new terminal. Press ENTER after every command.
![]() 1a–1k
1a–1k
Step 1 Use custom and default Snort configuration files.
a. Before we use Snort’s default configuration file and rules, let’s write a simple one, to get started:
sudo gedit /etc/snort/snort2.conf
Use the gedit text editor to create and edit the snort2.conf file, stored in /etc/snort, which is where the default snort.conf file is. For the variable HOME_NET (of type ipvar), use 192.168.1.0/24 if that is your network ID. Otherwise, modify it for your IP addressing scheme. The route command will show you your network ID. Add the following lines (using your network ID on line 3) to your configuration file:
preprocessor frag3_global: max_frags 65536
include classification.config
ipvar HOME_NET 192.168.1.0/24
var RULE_PATH /etc/snort/rules
include $RULE_PATH/local.rules
Click the red X at the top right of the screen and then click the Save button. This adds a minimal set of lines to the configuration file that Snort will use when started.
A default preprocessor is included to get rid of the message “WARNING: No preprocessors configured for policy 0.” You can read more about preprocessors, including this specific one, at http://manual-snort-org.s3-website-us-east-1.amazonaws.com/node17.html.
The file, classification.config, is included.
The following is from http://manual-snort-org.s3-website-us-east-1.amazonaws.com/node16.html:
The include keyword allows other snort config files to be included within the snort.conf indicated on the Snort command line. It works much like an #include from the C programming language, reading the contents of the named file and adding the contents in the place where the include statement appears in the file.
To see the classification.config file on your system, type
gedit /etc/snort/classification.config
and then press ENTER.
For the variable RULE_PATH (of type var), assign the value /etc/snort/rules. The include statement will expand that path (/etc/snort/rules) before /local.rules to produce an absolute reference for the rules file. Using a variable for the rule path allows you to use the variable for multiple references and also allows you to change just the RULE_PATH variable, if necessary, as opposed to each include statement.
Close gedit after looking through classification.config.
b. Enter the following command:
sudo gedit /etc/snort/rules/local.rules
The following is from the comments section in the file:
This file intentionally does not come with signatures. Put your local additions here.
Add the following rule on one single line. Do not press ENTER to break up the line. The text will wrap, if necessary, to the next line.
alert icmp any any -> $HOME_NET any (msg:”ICMP detected!”; sid: 1000052; rev:1; classtype:icmp-event;)
Snort rules have two parts: a rule header and rule options. The rule header, which appears before the open parenthesis, contains the rule action, protocol, source IP address, source port, direction, destination IP address, and destination port. The header answers the question “Who?” in relation to analyzed packets.
This rule starts with “alert,” which is the action to take if the criteria is met.
The following is from http://manual-snort-org.s3-website-us-east-1.amazonaws.com/node29.html:
1. alert Generate an alert using the selected alert method, and then log the packet.
2. log Log the packet.
3. pass Ignore the packet.
4. drop Block and log the packet.
5. reject Block the packet, log it, and then send a TCP reset if the protocol is TCP or an ICMP port unreachable message if the protocol is UDP.
6. sdrop Block the packet but do not log it.
As opposed to alert rules and log rules, pass rules will match benign traffic that doesn’t need to generate alerts or logs (for example, a vulnerability scanner on a network that should be ignored by Snort).
In the rule header from the previous page, icmp matches packets that have ICMP encapsulated inside.
The first any refers to any source IP address.
The second any refers to any source port.
What follows is the directional operator—in this case, indicating to match traffic from the source on the left of the arrow to the destination on the right of the arrow. There is also a bidirectional operator, <>, which instructs Snort to analyze traffic from each side (source and destination).
The third any refers to any destination IP address.
The fourth any refers to any destination port.
All of that is considered the Snort rule header.
If the rule header answers the question “Who?”, then the rule options answer the question “What?”
Table 13-1 shows general rule option keywords and their descriptions, as detailed at http://manual-snort-org.s3-website-us-east-1.amazonaws.com/node31.html.

TABLE 13-1 General Rule Option Keywords from the Snort Manual
Let’s take another look at our Snort rule:
alert icmp any any -> $HOME_NET any (msg:”ICMP detected!”; sid:1000052; rev:1; classtype:icmp-event;)
The rule options section starts with the message “ICMP detected!,” which is the message that will be displayed in the alert and logged.
The sid (Snort ID) uniquely identifies Snort rules. IDs less than 100 are reserved for future use. IDs from 100 to 999,999 are rules included with Snort. IDs greater than or equal to 1,000,000 are used for local rules.
The rev keyword identifies revisions of rules.
The classtype keyword categorizes a rule into a more general attack class, allowing the events Snort produces to be better organized.
The rule options section, which is found inside the parentheses, usually has parameters that determine if the rules should match. Although we don’t have any in this case, we’ll see a rule with such parameters later. If there are multiple parameters, the elements are generally evaluated in order, and every single one of them must be true for the rule to match and take action.
Multiple rule options are separated by a semicolon.
c. Now let’s start Snort in IDS mode and instruct it to display alerts to the console:
sudo snort -A console -A fast -c /etc/snort/snort2.conf -i ens33
Here, -c specifies the configuration file and -i specifies the interface.
The following is from the Snort man page:
-A alert-mode
Alert using the specified alert-mode. Valid alert modes include fast, full, none, and unsock. Fast writes alerts to the default “alert” file in a single-line, syslog style alert message. Full writes the alert to the “alert” file with the full decoded header as well as the alert message. None turns off alerting. Unsock is an experimental mode that sends the alert information out over a UNIX socket to another process that attaches to that socket.
-c config-file
Use the rules located in file config-file.
More on alert modes can be found here at http://manual-snort-org.s3-website-us-east-1.amazonaws.com/node6.html.
d. From the Windows 10 VM or host machine, ping the Ubuntu VM.
You’ll notice eight ICMP alerts (four Echo Requests and four Echo Replies), as shown in Figure 13-5.

FIGURE 13-5 Snort alerts generated
Press CTRL-C to break out. Notice all the information at the end of the output, including the following sections:
• Run time for packet processing
• Number of packets processed
• Memory usage summary
• Packet I/O Total
• Breakdown by protocol (includes rebuilt packets)
• Action stats
• Frag3 statistics
• Stream statistics
• SMTP Preprocessor Statistics
• Dcerpc2 Preprocessor Statistics
• SIP Preprocessor Statistics
e. Enter the following command to see the name of the log file:
sudo ls -l /var/log/snort
f. Open the log file in Wireshark:
sudo wireshark /var/log/snort/snort.log.[numbers seen here]
When you get to the end of the filename in the command after snort.log., press TAB, and the rest of the filename, consisting of numbers, will autocomplete.
g. Open the alert file:
sudo gedit /var/log/snort/alert
As shown in Figure 13-6, the file contains contents similar to what was outputted in the Terminal earlier in Figure 13-5.
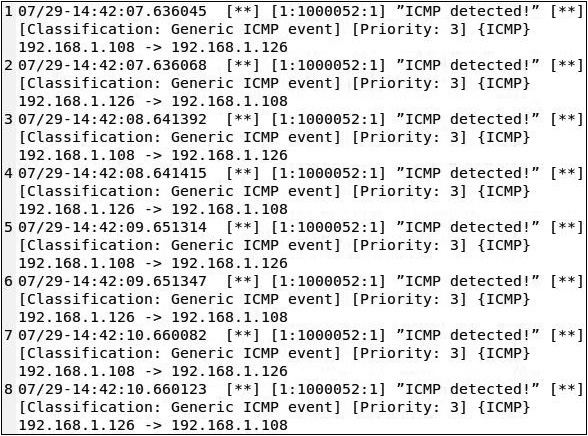
FIGURE 13-6 The alert file
h. Remove the alert file and restart Snort, changing the -A value from fast to full:
sudo rm /var/log/snort/alert
sudo snort -A console -A full -c /etc/snort/snort2.conf -i ens33
From the Windows 10 VM or host machine, ping the Ubuntu VM.
You’ll notice eight ICMP alerts (four Echo Requests and four Echo Replies). Press CTRL-C to break out. The fast option has been replaced by full.
i. Enter the following command:
sudo gedit /var/log/snort/alert
Notice the full IP headers (although, excluding some fields) for each alert in the alert file.
j. Remove the alert file and restart Snort, using both fast and full with two -A options:
sudo rm /var/log/snort/alert
sudo snort -A console -A fast -A full -c /etc/snort/snort2.conf -i ens33
From the Windows 10 VM or host machine, ping the Ubuntu VM.
You’ll notice eight ICMP alerts (four Echo Requests and four Echo Replies). Press CTRL-C to break out. Both the full and fast options are being used now.
k. Enter the following command:
sudo gedit /var/log/snort/alert
With both the fast and full options specified at the same time, you’ll now see output from both (one after the other) in each individual alert.
![]() 2a
2a
![]() 2c, 2d
2c, 2d
Step 2 Examine Snort’s default rules.
a. Now let’s see the rules that come with Snort:
ls -l /etc/snort/rules
Notice the different categories of rules, with each category in its own .rules file, as shown in Figure 13-7.
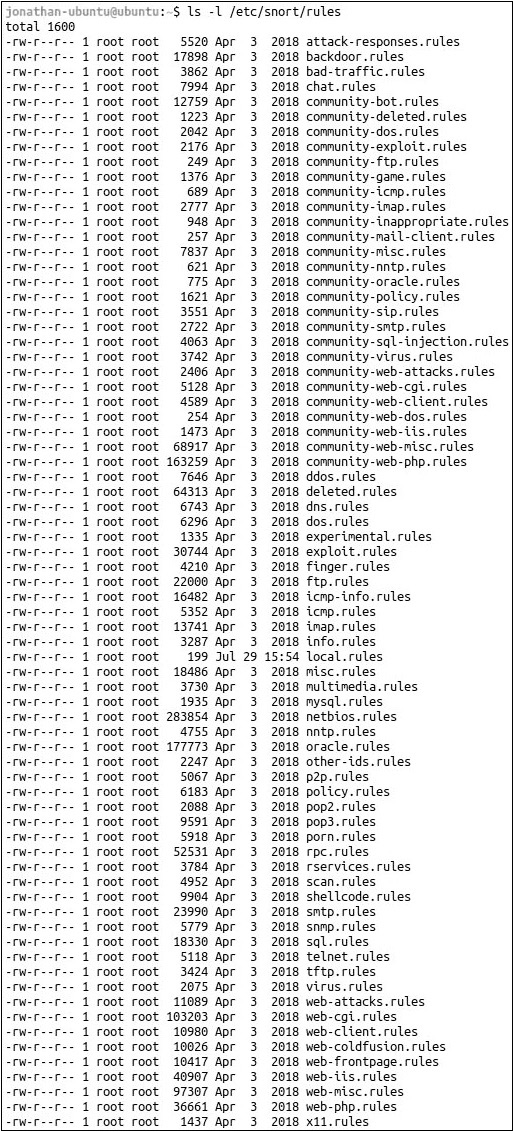
FIGURE 13-7 Snort rules
b. Go through all the rules with gedit or cat using the following syntax:
gedit /etc/snort/rules/icmp.rules
cat /etc/snort/rules/dns.rules
The first example uses gedit, and the second example uses cat. Just change the name of the file before the .rules extension. When we run Snort again, all of these rules will be in play.
c. Which five categories are the most interesting?
d. Which five individual rules are the most interesting?
![]() 3a–3e
3a–3e
Step 3 Start Snort with a custom configuration file.
a. Copy the default Snort configuration file, calling the new file snort3.conf:
sudo cp /etc/snort/snort.conf /etc/snort/snort3.conf
It’s always good to leave the original file as is and make changes off a copy, in case you want to revert back or just see what the defaults are.
b. Enter the following command:
sudo gedit /etc/snort/snort3.conf
To customize the default Snort configuration file, scroll down until you see the following line:
ipvar HOME_NET any
In the file I’m looking through, this is line 51, and it should be for you as well.
Change any to your network ID with the Classless Inter-Domain Routing (CIDR) notation for the subnet mask (for example, mine is 192.168.1.0/24).
Examine this entire file and then save and exit.
c. Now when you start Snort, you’ll notice a great amount of initial output:
sudo snort -A console -A full -c /etc/snort/snort3.conf -i ens33
From the Windows 10 VM or host machine, ping the Ubuntu VM.
You’ll notice more than eight ICMP alerts (four Echo Requests and four Echo Replies), as the icmp.rules file as well as the other files you looked at earlier are now in play. Press CTRL-C to break out. We’re using the full option again.
d. Enter the following command:
sudo gedit /var/log/snort/alert
Notice the additional alerts in the alert file now due to all .rules files being included.
e. Open the log file in Wireshark:
ls -l /var/log/snort
sudo wireshark /var/log/snort/snort.log.[numbers seen here]
When you get to the end of the filename in the command after snort.log., press TAB, and the rest of the filename, consisting of numbers, will autocomplete.
Lab Analysis
1. What are the three modes of Snort?
![]()
2. Which mode of Snort is the one most often used, and why?
![]()
3. What are some categories of rules that Snort can use?
![]()
Key Term Quiz
Use the terms from the list to complete the sentences that follow.
configuration
log
rules
1. You tell Snort specifically what to look for in the ____________ file.
2. When you launch Snort, you tell it to read from a ____________ file.
3. Through Wireshark, you can view and analyze the ____________ file.