
This chapter explains how to troubleshoot common JMeter issues while developing JMeter test scripts.
At the end of this chapter, you should have a good idea of troubleshooting various issues while developing JMeter scripts. It is a good idea to read this chapter unless you are an advanced user.
Ensure Permissions
For MacOS/Linux users, after installation, make sure that JMeter has the proper execute permissions. If you installed using an installer or expanded from a compressed tar (.tgz), then files will have the execute permission. However, if you have unzipped the binary distribution, the execute permission is not set.
On MacOSX/Linux, issue the following command.
cd <JMeter Installation Folder> cd bin chmod +x jmeterLog File
The most obvious and important place to look for errors is in the log file. By default, the name of the log file is jmeter.log and is created in the directory in which you start JMeter. If you don’t have write permissions on this directory, JMeter prints a FileNotFound error on the console. This issue occurs mostly with the MacOS and Linux systems. You will see the following error if that’s the case.
$ ls -ld .dr-x------@ 12 saimatam staff 408 Nov 18 22:32 .$ jmeterWriting log file to: /usr/local/apache-jmeter-3.0/ jmeter.log log_file=jmeter.log java.io.FileNotFoundException: jmeter.log (Permission denied) [log_file-> System.out] 2016/06/23 10:29:06INFO - jmeter.util.JMeterUtils: Setting Locale to en_US 2016/06/23 10:29:06INFO - jmeter.JMeter: Loading user properties from: /usr/local/apache-jmeter-3.0/bin/user.properties 2016/06/23 10:29:06INFO - jmeter.JMeter: Loading system properties from: /usr/local/apache-jmeter-3.0/bin/system.properties 2016/06/23 10:29:06INFO - jmeter.JMeter: Copyright (c) 1998-2016 The Apache Software Foundation 2016/06/23 10:29:06INFO - jmeter.JMeter: Version 3.0 r1743807
Sometimes, you’ll want to specify a different name or a different directory for the log file . This is useful when you want to specify a custom directory for managing logs.
You can specify a different log file name or path by:
Specify the -j option on the command line.
Specify the log_file property in the jmeter.properties file.
In the following example, you specify the log file as mylogfile.
$ jmeter -j mylogfile$ more mylogfile 2015/11/18 23:00:09 INFO - jmeter.util.JMeterUtils: Setting Locale to en_US......
Log Level
By default, the JMeter logging level is set to INFO. However, you can change this to one of the following values: FATAL_ERROR, ERROR, WARN, INFO, and DEBUG.
The log level is predefined in the jmeter.properties file. Alternately, use the L option on the command line to specify the log level at the root level, as shown here.
jmeter -LDEBUGUse the -L option on the command line to specify the log level at the package level, as shown here.
jmeter -Llog_level.jmeter.engine=DEBUGIn the jmeter.properties file, configure the log level by setting the properties. To specify the log level at the root level, use the following property:
File: jmeter.propertieslog_level.jmeter=INFO
The level of logging for a package or individual class can be set by using the following format. Make sure that org.apache has been removed from the package name. The class name is optional.
log_level.[package_name].[classname]=[PRIORITY_LEVEL]File: jmeter.propertiesjmeter -Llog_level.jmeter.engine=DEBUG
The package names for the log levels are as follows:
File: jmeter.properties
log_level.jmeter=INFOlog_level.jmeter.junit=DEBUGlog_level.jmeter.control=DEBUGlog_level.jmeter.testbeans=DEBUGlog_level.jmeter.engine=DEBUGlog_level.jmeter.threads=DEBUGlog_level.jmeter.gui=WARNlog_level.jmeter.testelement=DEBUGlog_level.jmeter.util=WARNlog_level.jmeter.protocol.http=DEBUGlog_level.jmeter.protocol.http.control=DEBUGlog_level.jmeter.protocol.ftp=WARNlog_level.jmeter.protocol.jdbc=DEBUGlog_level.jmeter.protocol.java=WARNlog_level.jmeter.testelements.property=DEBUG
Note that jorphan is a root-level package and uses the following to set its log level.
log_level.jorphan=INFOYou can specify a different log file for different categories using log_file.
[category]=[filename], where category is equivalent to the package/class name with org.apache omitted.
For example, to capture the logs from jmeter.engine into a file, you use the following property.
log_file.jmeter.engine=mylogs_engine.txtHTTP Protocol Logs
HTTPClient is an open source Java library used to start HTTP connections. This is the core of the HTTP Request Sampler. HTTPClient was developed under the Apache Software Foundation. Apache and Commons HTTPClient uses the same logging as JMeter. So if you enable debug logging on the HTTPClient, logs will be captured under the JMeter log file.
To debug specific issues, you may want to configure the HTTPClient to generate DEBUG logs.
log_level.jmeter.protocol.http=DEBUGlog_level.jmeter.protocol.http.control=DEBUG
You may also want to isolate these logs from the regular logs. To specify a separate file, you can use the following:
log_file.jmeter.protocol.http=mylogs_http.txtGUI Logs
When JMeter starts in GUI mode, you’ll find a Log Viewer panel at the bottom of the window. Initially, it may not be visible and can be enabled by a toggle. Click on the exclamation mark on a yellow triangle icon in the top-right corner of the toolbar.
Open LogViewerPanelTest.jmx.1
Run the test and observe the log viewer panel (see Figure 8-1).
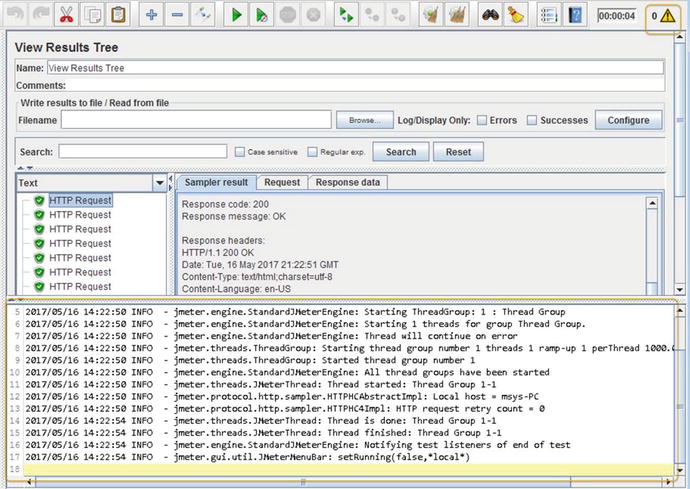
Figure 8-1. Log viewer panel
There is a jmeter.loggerpanel.display property in the jmeter.properties file. The default value is false. This determines if the Log Viewer Panel is initially displayed or hidden. Regardless of the value, you can click on the Toggle button in the Toolbar to enable/disable it.
We usually run JMeter in GUI mode during development and debugging of the test plan. GUI mode is not used when generating performance metrics for real use.
Clear GUI Logs
As you have seen in the previous section, after running the tests, you can see the logs by enabling the Log Viewer. If you have added listeners like Aggregate, View Results Tree, and other graphs, then after running the tests, these listeners will show the results. It would be good to clear these logs; navigate to Run ➤ Clear or Clear All to clear the logs.
Remote Host Exception
While using Linux VMs and starting remote hosts, you may get an error saying java.RMI.RemoteException: Cannot Start. <vm hostname> is loopback address. This is because under the jmeter.properties file, remote_hosts is set to 127.0.0.1.
...remote_hosts=127.0.0.1#remote_hosts=localhost:1099,localhost:2010...
And in the /etc/hosts file, the same 127.0.0.1 is set to localhost.
127.0.0.1 localhost127.0.1.1 jagdeep-vm01...
After removing the 127.0.0.1 localhost line from /etc/hosts, you will be able to start the remote jmeter-server.
There is another solution. Before starting jmeter-server, execute the following command.
$ export RMI_HOST_DEF=-Djava.rmi.server.hostname=<vm hostname>After doing either of these two things, we will be able to start the remote jmeter-sever properly.
This will not be a problem if you are using Windows, as the file C:WindowsSystem32Driversetchosts is commented.
Connect Exception
If one or more of the remote hosts are not reachable by the client, you will see the following message java.net.ConnectException: Operation timed out. Perhaps they have not yet booted up or they are shut down, in which case, when we trigger the test, it will fail.
For this example, we used FirstTestPlan.jmx.2
C:>jmeter -n -t FirstTestPlan.jmx -R 192.168.0.7:1234,192.168.0.8:1234Writing log file to: jmeter.logCreating summariser <summary>Created the tree successfully using FirstTestPlan.jmxConfiguring remote engine: 192.168.0.7:1234Connection refused to host: 192.168.0.7; nested exception is:java.net.ConnectException: Connection refused: connectFailed to configure 192.168.0.7:1234Configuring remote engine: 192.168.0.8:1234Connection refused to host: 192.168.0.8; nested exception is:java.net.ConnectException: Connection timed out: connectFailed to configure 192.168.0.8:1234Stopping remote enginesRemote engines have been stoppedError in NonGUIDriver java.lang.RuntimeException: Following remote engines could not be configured:[192.168.0.7:1234,192.168.0.8:1234]
In the first case, when remote hosts are still booting up, JMeter has a property to wait for some time and then trigger the test. You can set how many retries JMeter has to make and how much retry delay it has to wait before starting the test.
By default, client.tries is set to 1 and client.retries_delay is set to 5000 milliseconds. Uncomment these properties and rerun the test.
# When distributed test is starting, there may be several attempts to initialize# remote engines. By default, only single try is made. Increase following property# to make it retry for additional timesclient.tries=1# If there is initialization retries, following property sets delay between attemptsclient.retries_delay=5000
JMeter has a property to skip the remote hosts if they are not reachable and continue the test with the rest.
Update client.continue_on_fail to true under the jmeter.properties file.
# When all initialization tries was made, test will fail if some remote engines are failed# Set following property to true to ignore failed nodes and proceed with testclient.continue_on_fail=true
Run the test again. It will skip the unreachable host.
C:>jmeter -n -t FirstTestPlan.jmx -R 192.168.0.7,192.168.0.8Writing log file to: jmeter.logCreating summariser <summary>Created the tree successfully using FirstTestPlan.jmxConfiguring remote engine: 192.168.0.7Configuring remote engine: 192.168.0.8Connection refused to host: 192.168.0.8; nested exception is:java.net.ConnectException: Connection timed out: connectFailed to configure 192.168.0.8Following remote engines could not be configured:[192.168.0.8]Continuing without failed engines...Starting remote enginesStarting the test @ Mon May 15 17:04:14 PDT 2017 (1494893054551)Remote engines have been startedWaiting for possible Shutdown/StopTestNow/Heapdump message on port 4445summary = 2 in 00:00:01 = 2.2/s Avg: 376 Min: 279 Max: 474 Err: 0 (0.00%)Tidying up remote @ Mon May 15 17:04:16 PDT 2017 (1494893056800)... end of run
Solving Proxy Servers Problems
Sometimes, corporate networks have web proxy servers. Web traffic originating from inside the corporate network must go through the web proxy servers. One purpose is to conserve bandwidth by allowing only certain URLs or media types. The other important reason is security; unauthorized users or guests are prevented from connecting to the web by the username/password mechanism (see Figure 8-2).
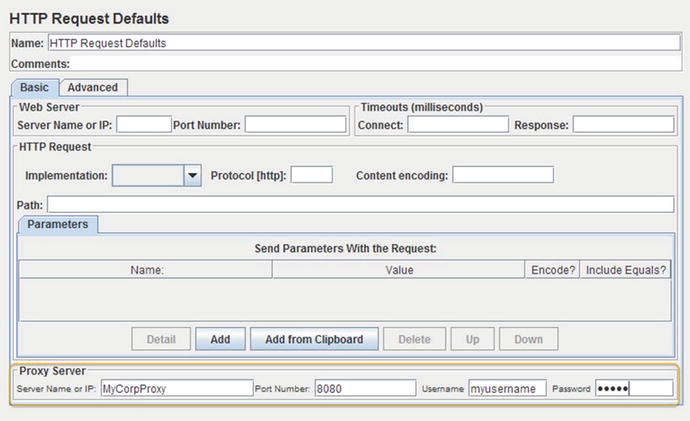
Figure 8-2. Proxy server configuration in HTTP request defaults
JMeter provides a simple way to specify proxy server details. This property is present in the HTTP Request Defaults component . If the JMeter test does not already have the HTTP Request Defaults component, add one under the Thread Group and apply it to the entire test plan.
Specify the Proxy Server details: Server Name or IP and Port Number.
Specify the username/password if the proxy server needs it. JMeter requests can now go through the proxy.
In Figure 8-2, the Proxy Server details are set as follows:
Server Name or IP is set to MyCorpProxy
Username is set to myusername
Password is set to mypass
If you’re using the command line and there is no username and password, leave them blank.
jmeter -H proxyserver -P 7000If you’re using the command line and the proxy server needs the username and password to authenticate, you use these additional parameters:
jmeter -H proxyserver -P 7000 -u username -a passwordIf you want to bypass the proxy and contact hosts directly, you can set the -N option as shown here:
jmeter -H proxyserver -P 7000 -u username -a password -N directHostYou can also use --proxyHost, --proxyPort, --username, and --password instead of -H, -P, -u, and –a.
HTTP Basic Authentication
As the title indicates, HTTP Basic Authentication is a very simple authentication mechanism used by the web server and the browser to secure access to URLs and resources. This does not need cookies, sessions, or login forms. The protocol is for the browser to send the username and password encoded in a variant of Base64 (RFC2045). This is not encrypted but merely encoded. It is straightforward to decode this. This is insecure, much like exchanging the username and password in plain text!
The protocol mechanism can be explained as follows:
The browser requests an URL or resource protected by the Basic Authentication mechanism.
The server responds with an HTTP status code of 401, which indicates an unauthorized request.
The server then responds with the WWW-Authenticate field in the header. For example:
WWW-Authenticate: Basic realm="abcd_m3VKxodZ2YM9:"The client displays a dialog to the user to collect the necessary username and password, as shown in Figure 8-3.

Figure 8-3. Authentication dialog displayed by the browser
The browser then encodes the string username:password using a variant of Base64-encoding (RFC2045) and sends it in an HTTP header field to the server .
The server authenticates and allows the request.
All the subsequent requests from the browser need to include the username:password encoding in the HTTP Request.
Using HTTP Header Manager
If the web application requires authentication, you can use the HTTP Header Manager to accomplish this.
Let’s illustrate this with an example on how you should configure the HTTP Header Manager to run JMeter test scripts successfully.
Follow these steps or download HeaderManagerTestPlan.jmx.3
Create a test plan and give it a meaningful name, such as Header Manager Test Plan .
Click on Test Plan and go to Edit ➤ Add ➤ Threads (Users). Add Thread Group.
Click on Thread Group and go to Edit ➤ Add ➤ Config Element. Add HTTP Header Manager.
Click on Thread Group and go to Edit ➤ Add ➤ Sampler. Add HTTP Request. Configure Server Name or IP as localhost, Port Number as 8080, and Path as /admin.
Click on HTTP Request and go to Edit ➤ Add ➤ Assertions. Add Response Assertion. Configure Response Field to Test as Response Code, Pattern Matching Rules as Equals, and Patterns To Test as 200.
Click on Thread Group and go to Edit ➤ Add ➤ Listener. Add View Results Tree.
Save the test plan.
Now you need to configure the name and value for the Headers Stored in Header Manager option.
In the CMD prompt, issue the following command to encode the user:password string into the Base64 format.
echo -n "admin:admin" | base64 YWRtaW46YWRtaW4=The string is admin:admin because the username and password are admin.
Add a header with the name of Authorization and a value of BASIC YWRtaW46YWRtaW4=, where YWRtaW46YWRtaW4= is the Base64-encoding obtained from the previous step (see Figure 8-4).

Figure 8-4. Header manager
Run the JMeter test . It should be able to authenticate successfully.
Using the HTTP Authorization Manager
If the web application requires authentication, you can also use the HTTP Authorization Manager to accomplish this.
Let’s illustrate this with an example of how you should configure the HTTP Authorization Manager to run JMeter test scripts successfully.
Follow these steps or download AuthorizationManagerTestPlan.jmx.4
Create a test plan and give it a meaningful name, such as Authorization Manager Test Plan.
Click on Test Plan and go to Edit ➤ Add ➤ Threads (Users). Add Thread Group.
Click on Thread Group and go to Edit ➤ Add ➤ Config Element and add HTTP Authorization Manager. Configure Username as admin and Password as admin. The Base URL may be configured based on the scope and the need. It is okay to omit the Domain and Realm. Leave the Mechanism as BAISC_DIGEST (see Figure 8-5).
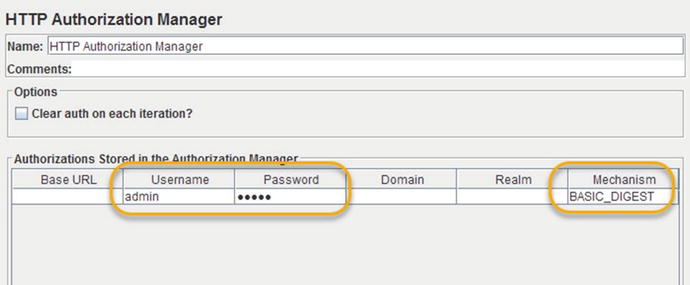
Figure 8-5. Authorization manager configuration
Click on Thread Group and go to Edit ➤ Add ➤ Sampler. Add HTTP Request. Configure Server Name or IP as localhost, Port Number as 8080, and Path as /admin.
Click on HTTP Request and go to Edit ➤ Add ➤ Assertions. Add Response Assertion. Configure Response Field to Test as Response Code, Pattern Matching Rules as Equals, and Patterns To Test as 200.
Click on Thread Group and go to Edit ➤ Add ➤ Listener. Add View Results Tree.
Save the test plan.
Run the JMeter test . It should be able to authenticate successfully.
Debug Test Faster
Prior to JMeter 3.0, we had to configure the thread group before you could run the test. With JMeter 3.0, you can run the test with a Validate menu option provided with the thread group.
The Validate menu option executes the specified thread group with a single thread and you can check the results quickly without having to configure thread group. This option is handy for debugging tests prior to the final run.
Let’s illustrate this with an example of how you can use thread group Validate option.
Follow these steps or download ThreadGroupValidateTestPlan.jmx.5
Create a test plan and give it a meaningful name, such as thread group Validate Test Plan.
Click on Test Plan and go to Edit ➤ Add ➤ Threads (Users). Add Thread Group. Configure Number of Threads (Users) to 10 and Ramp-Up Period (in seconds) to 10.
Click on Thread Group and go to Edit ➤ Add ➤ Sampler. Add HTTP Request. Configure Server Name or IP as localhost, Port Number as 8080, and Path as /dt.
Click on HTTP Request and go to Edit ➤ Add ➤ Assertions. Add Response Assertion. Configure Response Field to Test as Response Code, Pattern Matching Rules as Equals, and Patterns To Test as 200.
Click on Thread Group and go to Edit ➤ Add ➤ Listener. Add View Results Tree.
Save the test plan.
Right-click on Thread Group and click on Validate (see Figure 8-6).

Figure 8-6. Thread group validate
Click on View Results Tree. You will observe that the test has been executed with a single thread even though it was configured with 10 threads .
There are two more options introduced with JMeter 3.0; Start and Start No Pause. These two options provide a shortcut to execute threads individually. The only difference between these two menu options is that with the latter, Timer if Configured in the thread group are skipped and the thread will run without any manual pauses.
These two options are useful when the test has multiple thread groups and you are still refining it. You can use these options to verify individual thread groups selectively.
Out of Memory Error
When JMeter exhausts its memory, you will notice the java.lang.OutOfMemoryError error in the logs.
C:> jmeter -n -t DTPerformanceDashBoardTestPlan.jmx -l dt-pd.jtl -e -o C: mppdWriting log file to: jmeter.logCreating summariser <summary>Created the tree successfully using DTPerformanceDashBoardTestPlan.jmxStarting the test @ Tue July 12 22:25:42 IST 2016 (1468342542968)Waiting for possible Shutdown/StopTestNow/Heapdump message on port 4445summary + 192 in 00:00:17 = 11.4/s Avg: 11 Min: - Max: 187 Err: 0 (0.00%) Active: 46 Started: 46 Finished: 0summary + 763 in 00:00:30 = 25.5/s Avg: 14 Min: - Max: 622 Err: 0 (0.00%) Active: 136 Started: 136 Finished: 0summary = 956 in 00:00:47 = 20.4/s Avg: 13 Min: - Max: 622 Err: 0 (0.00%)summary + 1474 in 00:00:30 = 49.2/s Avg: 20 Min: - Max: 428 Err: 0 (0.00%) Active: 226 Started: 226 Finished: 0summary = 2430 in 00:00:17 = 31.6/s Avg: 17 Min: - Max: 622 Err: 0 (0.00%)summary + 2000 in 00:00:30 = 65.6/s Avg: 174 Min: - Max: 1536 Err: 1 (0.05%) Active: 300 Started: 300 Finished: 0summary = 4430 in 00:01:47 = 41.3/s Avg: 88 Min: - Max: 1536 Err: 0 (0.02%)java.lang.OutOfMemoryError: GC overhead limit exceededDumping heap to java_pid63753.hprof ...Heap dump file created [127430909 bytes in 3.941 secs]
You can monitor the memory and CPU usage of JMeter using JVisualVM. This tool is shipped with the JDK installation, by default.
The JVisualVM screen shown in Figure 8-7 shows excessive CPU and memory usage by JMeter.

Figure 8-7. JVisual VM screen
To increase the HEAP memory for JMeter, specify it using the JVM_ARGS environment variable before starting JMeter . Enter this command in CMD prompt:
set JVM_ARGS="-Xms1024m -Xmx1024m"C:> jmeter
Conclusion
In this chapter, you learned to troubleshoot various common errors while working with JMeter test scripts. In the next chapter, you will learn about JMeter plugins and learn how to use them in your test plan for monitoring and generating good looking reports.