
This chapter introduces JMeter plugins, which are developed as a part of Google Code (JP@GC). They are useful in analyzing performance test results and displaying beautiful graphs. We will illustrate the use of PerfMon and jp@gc, the PerfMon Metrics Collector, with the help of an example.
At the end of this chapter, you will understand JMeter plugins, including how to install them and use them in test plans. You will also able to develop and run test plans and export monitoring reports. Those who are already familiar with JMeter plugins can proceed to the next chapter.
Although JMeter generates very useful performance metrics, it does not have good visualizers and visually appealing graphs. JMeter Plugins at Google Code (JP@GC) closes this gap and offers several plugins that generate elegant graphs which help you visualize the performance test results. Additionally, JP@GC provides plugins that extend JMeter functionality with new config elements, timers, pre-processor, post-processor, assertions, listeners, and logic controllers.
For more details, look at JP@GC Standard Documentation.1
Each JP@GC plugin has a Help on This Plugin link, which navigates to the Wiki page.2 It also has an active community. You can also contact the people on the forum on the Mailing List.3
Each JP@GC plugin provides a rich set of options to customize the generation of pleasing graphs to meet a variety of needs.
PerfMon
During performance testing, it is important to know the health of the servers hosting the web application under test. To address this, the PerfMon package supports server/cluster monitoring. Using this, you can monitor CPU, memory, swap, disk I/O, and network performance on all platforms. See Figure 9-1.
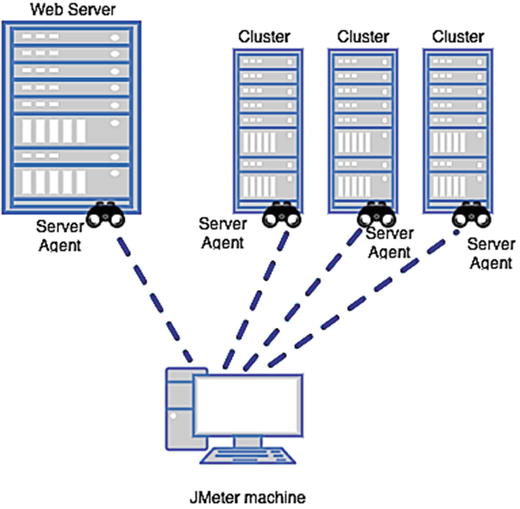
Figure 9-1. The server agent
To write this book, we used JMeter 3.0 and ServerAgent 2.2.1.
ServerAgent provides over 75 separate metrics, including CPU, memory metrics per-process, and custom metrics for measuring things such as file sizes, database row counts, Java heap sizes, and garbage collection time.
Download the Plugin
Download ServerAgent from the URL4 and set it up on the web application host.
Unzip ServerAgent-2.2.1.zip into a preferred folder. We downloaded it into the C:ServerAgent-2.2.1 folder.
C:ServerAgent-2.2.1>dirVolume in drive C has no label.Volume Serial Number is DA32-01EEDirectory of C:ServerAgent-2.2.105/15/2017 10:36 PM <DIR> .05/15/2017 10:36 PM <DIR> ..02/25/2013 04:48 PM 10,821 CMDRunner.jar05/15/2017 10:36 PM <DIR> lib02/25/2013 04:14 PM 85,433 LICENSE02/25/2013 04:47 PM 62,848 ServerAgent.jar02/25/2013 04:14 PM 63 startAgent.bat02/25/2013 04:14 PM 74 startAgent.sh5 File(s) 159,239 bytes3 Dir(s) 7,551,549,440 bytes freeC:ServerAgent-2.2.1>
Start the PerfMon Agent
To run the PerfMon agent, you will need JRE 1.4 or greater. PerfMon also gives you an option to run the agent in a specific JRE. Create a JRE folder under the root folder of the server agent and copy the JRE. Edit the startAgent.bat or startAgent.sh file and set the JRE path.
C:ServerAgent-2.2.1>type startAgent.bat@echo offjava -jar %0..CMDRunner.jar --tool PerfMonAgent %*
Start the agent using the following command.
C:ServerAgent-2.2.1>startAgent.batINFO 2017-05-15 22:40:13.101 [kg.apc.p] (): Binding UDP to 4444INFO 2017-05-15 22:40:14.099 [kg.apc.p] (): Binding TCP to 4444INFO 2017-05-15 22:40:14.101 [kg.apc.p] (): JP@GC Agent v2.2.0 started
By default, it opens UDP and TCP connections on port 4444, which are used to connect to JMeter to collect metrics. Console output indicates that the JP@GC server agent has been started successfully.
To start the server agent on a different port, specify the same on the command line.
The command-line options are --udp-port and --tcp-port.
C:ServerAgent-2.2.1>startAgent.bat --udp-port 1234 --tcp-port 1234INFO 2017-05-15 22:42:18.876 [kg.apc.p] (): Binding UDP to 1234INFO 2017-05-15 22:42:19.874 [kg.apc.p] (): Binding TCP to 1234INFO 2017-05-15 22:42:19.876 [kg.apc.p] (): JP@GC Agent v2.2.0 started
In the logs, you can see that UDP is bound to port 1234 and TCP is bound to 1235.
To stop the server agent, use this command:
C:ServerAgent-2.2.1>startAgent.bat --auto-shutdownUse the --sysinfo option to view available system objects.
C:ServerAgent-2.2.1>startAgent.bat --sysinfoINFO 2017-05-15 22:45:09.385 [kg.apc.p] (): *** Logging available processes ***INFO 2017-05-15 22:45:09.475 [kg.apc.p] (): Process: pid=2080 name=taskhost.exe args=taskhost.exeINFO 2017-05-15 22:45:09.477 [kg.apc.p] (): Process: pid=8980 name=dwm.exe args=C:Windowssystem32Dwm.exeINFO 2017-05-15 22:45:09.478 [kg.apc.p] (): Process: pid=7572 name=explorer.exe args=C:WindowsExplorer.EXEINFO 2017-05-15 22:45:09.479 [kg.apc.p] (): Process: pid=6280 name=igfxem.exe args=igfxEM.exeINFO 2017-05-15 22:45:09.480 [kg.apc.p] (): Process: pid=6804 name=igfxhk.exe args=igfxHK.exeINFO 2017-05-15 22:45:09.481 [kg.apc.p] (): Process: pid=8640 name=igfxtray.exe args=igfxTray.exe......INFO 2017-05-15 22:45:10.204 [kg.apc.p] (): Network interface: iface=eth35 addr=0.0.0.0 type=EthernetINFO 2017-05-15 22:45:10.207 [kg.apc.p] (): *** Done logging sysinfo ***INFO 2017-05-15 22:45:10.210 [kg.apc.p] (): Binding UDP to 4444INFO 2017-05-15 22:45:11.212 [kg.apc.p] (): Binding TCP to 4444INFO 2017-05-15 22:45:11.217 [kg.apc.p] (): JP@GC Agent v2.2.0 started
You can use --loglevel parameter to set the level of logging. The log levels available are INFO, ERROR, WARNING, and DEBUG.
C:ServerAgent-2.2.1>startAgent.bat --loglevel DEBUGDEBUG 2017-05-15 22:47:19.760 [kg.apc.p] (): Start accepting connectionsINFO 2017-05-15 22:47:19.823 [kg.apc.p] (): Binding UDP to 4444INFO 2017-05-15 22:47:20.824 [kg.apc.p] (): Binding TCP to 4444INFO 2017-05-15 22:47:20.825 [kg.apc.p] (): JP@GC Agent v2.2.0 startedConfigure PerfMon Metrics Collector
You can download JMeter standard plugins from the JMeter Plugins web page.5
Extract the plugin into the apache-jmeter-3.0 root folder and execute the command as given. You will find the latest extracted files , as shown here.
c:apache-jmeter-3.0libext>dir /O:-DVolume in drive C has no label.Volume Serial Number is DA32-01EEDirectory of c:apache-jmeter-3.0libext...05/14/2016 11:47 AM 106 readme.txt10/12/2015 10:07 AM <DIR> ..10/12/2015 10:07 AM <DIR> .10/12/2015 10:07 AM 10,782 CMDRunner.jar10/12/2015 10:07 AM 1,262,178 JMeterPlugins-Standard.jar06/17/2015 09:47 AM 95 JMeterPluginsCMD.sh06/17/2015 09:47 AM 68 TestPlanCheck.bat06/17/2015 09:47 AM 100 TestPlanCheck.sh06/17/2015 09:47 AM 63 JMeterPluginsCMD.bat22 File(s) 4,387,697 bytes2 Dir(s) 7,541,547,008 bytes freec:apache-jmeter-3.0libext>
You can configure this plugin by using the following example.
Follow these steps or download PerfMonPluginTestPlan.jmx:6
Create a test plan and give it a meaningful name, such as PerfMon Plugin Test.
Click on Test Plan and go to Edit ➤ Add ➤ Threads (Users). Add Thread Group. Configure Number of Threads (users) as 400 and Loop Count to 100.
Click on Thread Group and go to Edit ➤ Add ➤ Config Element. Add HTTP Cookie Manager.
Click on Thread Group and go to Edit ➤ Add ➤ Config Element. Add HTTP Request Defaults. Configure Server Name or IP as localhost and Port Number as 8080.
Click on Thread Group and go to Edit ➤ Add ➤ Sampler. Add HTTP Request. Configure Path as /user/signIn and Method as POST.
Click on HTTP Request and under Parameters, add Name/Value as email/[email protected]. Add another row and configure password/user1.
Click on Thread Group and go to Edit ➤ Add ➤ Sampler. Add HTTP Request. Configure Path as /user/signOut and Method as HEAD.
Click on Thread Group and go to Edit ➤ Add ➤ Listener. Add View Results Tree.
Click on Thread Group and go to Edit ➤ Add ➤ Listener. Add jp@gc - PerfMon Metrics Collector (see Figure 9-2).
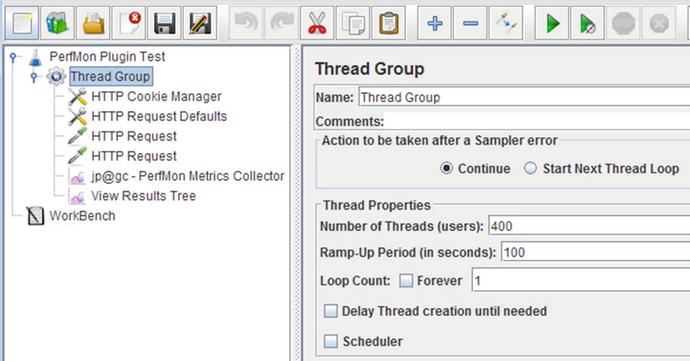
Figure 9-2. PerfMon plugin test
Click on jp@gc - PerfMon Metrics Collector. Configure Servers To Monitor by clicking the Add Row button. Configure HOST/ IP as localhost, Port as 4444, and Metric to Collect as CPU (change it to meet your requirements).
Click again on the Add Row button to set Metric to Collect for Memory.
Save the test plan.
Start the server agent if it was not started earlier.
Run the test.
The results will be similar to those shown in Figure 9-3.

Figure 9-3. PerfMon metrics collector listener
To save the results as a graph , right-click on the graph and choose a suitable option (see Figure 9-4).
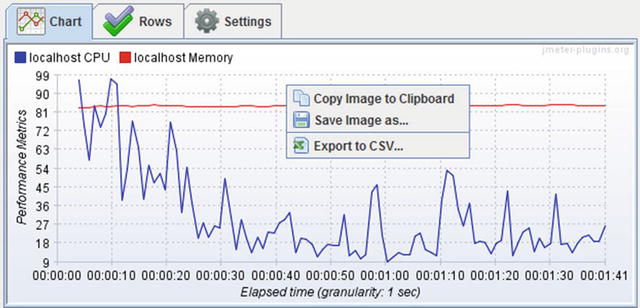
Figure 9-4. Save result graph
If you want to monitor different metrics on the same host/IP, click on Copy Row and change the Metric to Collect parameter. Available metrics are CPU, Memory, Swap, Disk I/O, Network I/O, TCP, JMX, EXEC, and TAIL. The Metric parameter can be used to set the CPU parameter per scope. Double-click on the cell, click on the three dots on the right side to open a new pop-up window. From that window, you can control the appearance of graphs. Mouse over to see the help text.
Figure 9-5 details the kind of metrics that can be collected for CPU.
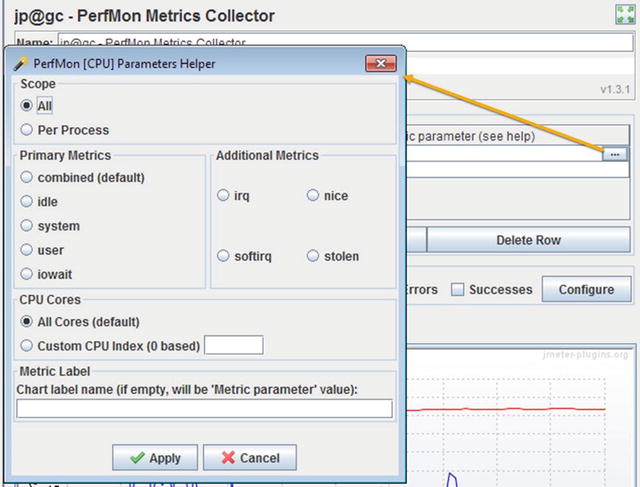
Figure 9-5. PerfMon CPU parameters helper
Non-GUI Mode
JMeter properties can also be used to configure the PerfMon plugin. To do this, add the following properties to the jmeter.properties file.
jmeterPlugin.perfmon.interval: Metrics collection interval in milliseconds.
jmeterPlugin.perfmon.useUDP: Set to true/false. Enabling this will make JMeter try a UDP connection if the TCP connection attempts fail.
jmeterPlugin.perfmon.label.useHostname: Set to true/false. Enables using “short” hostnames. The default pattern is ([w-]+)..*
jmeterPlugin.perfmon.label.useHostname.pattern: String (escaped), regular expression to extract hostname (first group is matched). ° For example, the default pattern would be: jmeterPlugin.perfmon.label.useHostname.pattern=([w-]+)..*
Pattern for EC2 us-east/west subdomain matching is as follows: jmeterPlugin.perfmon.label.useHostname.pattern=([w-]+.us-(east|west)-[0-9]).*
forcePerfmonFile: Set to true/false. Enabling it forces JMeter to write a JTL file with PerfMon metrics in the current directory.
Run JMeter in non-GUI mode. Configure the filename to save the monitoring results too. Later, you can load the saved file into the GUI and review the timeline.
Conclusion
In this chapter, you learned about JMeter Plugins at Google Code (JP@GC) and explored various options for the jp@gc - PerfMon Metrics Collector. In the next chapter, you will learn about the advanced concepts of JMeter, which we call the JMeter recipes. These will be useful while performance testing a database/FTP/REST API/mobile web application.