
C H A P T E R 3
Scalable Vector Graphics
In this chapter, we’ll explore what you can do with another graphics feature in HTML5: Scalable Vector Graphics. Scalable Vector Graphics, or SVG, is an expressive language for two dimensional graphics.
Overview of SVG
In this section we’ll look at the standard vector graphics support in HTML5 browsers, but first, let’s review a couple of graphics concepts: raster and vector graphics.
In raster graphics, an image is represented by a two dimensional grid of pixels. The HTML5 Canvas 2d API is an example of a raster graphics API. Drawing with the Canvas API updates the canvas’s pixels. PNG and JPEG are examples of raster image formats. The data in PNG and JPEG images also represents pixels.
Vector graphics are quite different. Vector graphics represent images with mathematical descriptions of geometry. A vector image contains all of the information needed to draw an image from high-level geometric objects such as lines and shapes. As you can tell by the name, SVG is an example of vector graphics. Like HTML, SVG is a file format that also has an API. SVG combined with the DOM APIs form a vector graphics API. It is possible to embed raster graphics such as PNG images inside of SVG, but SVG is primarily a vector format.
History
SVG has been around for a few years. SVG 1.0 was published as a W3C recommendation in 2001. SVG was originally available in browsers with the use of a plugin. Shortly afterward, browsers added native support for SVG images.
Inline SVG in HTML has a shorter history. A defining characteristic of SVG is that it is based on XML. HTML, of course, has a different syntax, and you cannot simply embed XML syntax inside of HTML documents. Instead, it has special rules for SVG. Prior to HTML5, it was possible to embed SVG as <img> elements inside an HTML page or link to self-contained .svg documents. HTML5 introduced inline SVG, in which SVG elements themselves can appear in HTML markup. Of course, in HTML, the syntax rules are more relaxed than in XML. You can have unquoted attributes, mixed capitalization, and so on. You will still need to use self-closing tags when appropriate. For example, you can embed a circle into your HTML document with just a little markup:
<svg height=100 width=100><circle cx=50 cy=50 r=50 /></svg>
Understanding SVG
Figure 3-1 shows an HTML5 document with the Happy Trails! image we drew with the canvas API in Chapter 2. If you read the title of this chapter, you can probably guess that this version was drawn with SVG. SVG lets you do many of the same drawing operations as the canvas API. Much of the time, the results can be visually identical. There are some important invisible differences, however. For one thing, the text is selectable. You don’t get that with canvas! When you draw text onto a canvas element, the characters are frozen as pixels. They become part of the image and cannot change unless you redraw a region of the canvas. Because of that, text drawn onto a canvas is invisible to search engines. SVG, on the other hand, is searchable. Google, for instance, indexes the text in SVG content on the web.
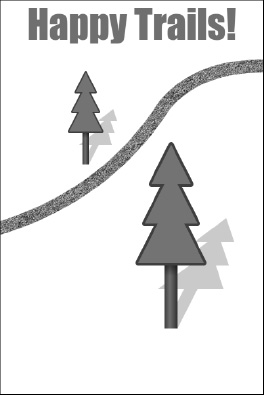
Figure 3-1. SVG version of Happy Trails!
SVG is closely related to HTML. If you choose, you can define the content of an SVG document with markup. HTML is a declarative language for structuring pages. SVG is a complimentary language for creating visual structures. You can interact with both SVG and HTML using DOM APIs. SVG documents are live trees of elements that you can script and style, just like HTML. You can attach event handlers to SVG elements. For example, you can use click event handlers to make SVG buttons or shaped clickable regions. That is essential for building interactive applications that use mouse input.
Additionally, you can view and edit the structure of the SVG in your browser’s development tool. As you can see in Figure 3-2, inline SVG embeds directly into the HTML DOM. It has a structure you can observe and change at runtime. You can dig into SVG and see its source, unlike an image that is just a grid of pixels.
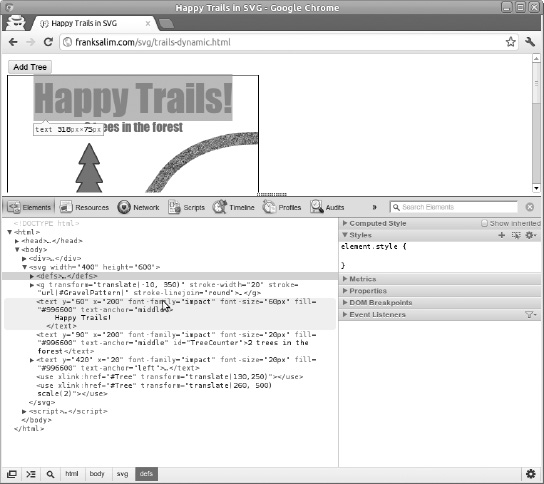
Figure 3-2. Looking at the SVG elements in ChromeWeb Inspector
In Figure 3-2, the highlighted text element contains the following code:
< text y="60" x="200" font-family="impact" font-size="60px"

  fill="#996600" text-anchor="middle">

    Happy Trails

</text>
In the development environment you can add, remove, and edit SVG elements. The changes take effect instantly in the active page. This is extremely convenient for debugging and experimenting.
RETAINED-MODE GRAPHICS
Scalable Graphics
When you magnify, rotate, or otherwise transform SVG content, all of the lines making up the image are crisply redrawn. SVG scales without losing quality. The vector information that makes up an SVG document is preserved when it is rendered. Contrast that with pixel graphics. If you magnify a pixel graphic like a canvas or an image, it becomes blurry. That is because the image is composed of pixels that can only be resampled at a higher resolution. The underlying information—the paths and shapes that went into making the image—is lost after drawing (see Figure 3-3).
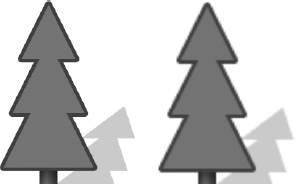
Figure 3-3. Closeups of SVG and canvas at 500% magnification
Creating 2D Graphics with SVG
Let’s look again at the Happy Trails! image from Figure 3-1. Every visible part of this SVG drawing has some corresponding markup. The complete SVG language is quite extensive, and all of its details and nuances will not fit in this chapter. However, to get a glimpse of the breadth of the SVG vocabulary, here are some of the features used to draw Happy Trails:
- Shapes
- Paths
- Transformations
- Patterns and Gradients
- Reusable Content
- Text
Let’s look at each of these in turn before we combine them into a complete scene. Before we can do that, though, we’ll need to see how to add SVG to a page.
Adding SVG to a Page
Adding inline SVG to an HTML page is as simple as adding any other element.
There are several ways to use SVG on the Web, including as <img> elements. We will use inline SVG in HTML, because it will integrate into the HTML document. That will let us later write an interactive application that seamlessly combines HTML, JavaScript, and SVG (see Listing 3-1).
Listing 3-1. SVG Containing a Red Rectangle
<!doctype html>

<svg width="200" height="200">

</svg>
That’s it! No XML namespace necessary. Now, between the start and end svg tags, we can add shapes and other visual objects. If you want to split the SVG content out into a separate .svg file, you will need to change it like so:
<svg width="400" height="600" xmlns="http://www.w3.org/2000/svg"

    xmlns:xlink="http://www.w3.org/1999/xlink">

</svg>
Now it is a valid XML document with the proper namespace attributes. You will be able to open that document with a wide variety of image viewers and editors. You can also refer to an SVG file from HTML as a static image with code such as <img src="example.svg">. One downside to that approach is that the SVG document is not integrated into the DOM the way inline SVG content is. You won’t be able to script interaction with the SVG elements.
Simple Shapes
The SVG language includes basic shape elements such as rectangles, circles, and ellipses. The size and position of shape elements are defined with attributes. For rectangles, these are width and height. For circles, there is an r attribute for radius. All of these use the CSS syntax for distances, so they can be pixels, points, ems, and so on. Listing 3-2 is a very short HTML document containing inline SVG. It is just a gray rectangle with a red outline that is 100 pixels by 80 pixels in size, and it is displayed in Figure 3-4.
Listing 3-2. SVG Containing a Red Rectangle
<!doctype html>

<svg width="200" height="200">

  <rect x="10" y="20" width="100" height="80" stroke="red" fill="#ccc" />

</svg>
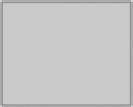
Figure 3-4. An SVG rectangle in an HTML document
SVG draws objects in the order they appear in the document. If we add a circle after the rectangle, it appears on top of the first shape. We will give that circle an 8 pixel wide blue stroke and no fill style (see Listing 3-3), so it stands out, as shown in Figure 3-5.
Listing 3-3. A Rectangle and a Circle
<!doctype html>

<svg width="200" height="200">

  <rect x="10" y="20" width="100" height="80" stroke="red" fill="#ccc" />

  <circle cx="120" cy="80" r="40" stroke="#00f" fill="none" stroke-width="8" />

</svg>
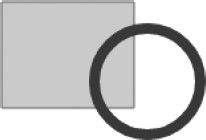
Figure 3-5. A rectangle and a circle
Note that the x and y attributes define the position of the top-left corner of the rectangle. The circle, on the other hand, has cx and cy attributes, which are the x and y values for the center of the circle. SVG uses the same coordinate system as the canvas API. The top-left corner of the svg element is position 0,0. See Chapter 2 for the details of the canvas coordinate system.
Transforming SVG Elements
There are organizational elements in SVG intended to combine multiple elements so that they can be transformed or linked to as units. The <g> element stands for “group.” Groups can be used to combine multiple related elements. As a group, they can be referred to by a common ID. A group can also be transformed as a unit. If you add a transform attribute to a group, all of that group’s contents are transformed. The transform attribute can include commands to rotate (see Listing 3-4 and Figure 3-6), translate, scale, and skew. You can also specify a transformation matrix, just as you can with the canvas API.
Listing 3-4. A Rectangle and a Circle Within a Rotated Group
<svg width="200" height="200">

    <g transform="translate(60,0) rotate(30) scale(0.75)" id="ShapeGroup">

      <rect x="10" y="20" width="100" height="80" stroke="red" fill="#ccc" />

      <circle cx="120" cy="80" r="40" stroke="#00f" fill="none" stroke-width="8" />

    </g>

</svg>
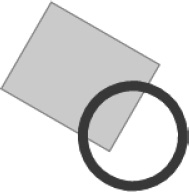
Figure 3-6. A rotated group
Reusing Content
SVG has a <defs> element for defining content for future use. It also has an element named <use> that you can link to your definitions. This lets you reuse the same content multiple times and eliminate redundancy. Figure 3-7 shows a group used three times at different transformed positions and scales. The group has the id ShapeGroup, and it contains a rectangle and a circle. The actual rectangle and circle shapes are just defined the one time inside of the <defs> element. The defined group is not, by itself, visible. Instead, there are three <use> elements linked to the shape group, so three rectangles and three circles appear rendered on the page (see Listing 3-5).
Listing 3-5. Using a Group Three Times
<svg width="200" height="200">

  <defs>

    <g id="ShapeGroup">

      <rect x="10" y="20" width="100" height="80" stroke="red" fill="#ccc" />

      <circle cx="120" cy="80" r="40" stroke="#00f" fill="none" stroke-width="8" />

    </g>

  </defs>


  <use xlink:href="#ShapeGroup" transform="translate(60,0) scale(0.5)"/>

  <use xlink:href="#ShapeGroup" transform="translate(120,80) scale(0.4)"/>

  <use xlink:href="#ShapeGroup" transform="translate(20,60) scale(0.25)"/>

</svg>
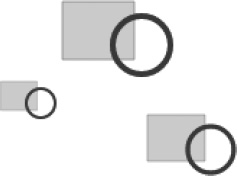
Figure 3-7. Three use elements referencing the same group
Patterns and Gradients
The circle and rectangle in Figure 3-7 have simple fill and stroke styles. Objects can be painted with more complex styles, including gradients and patterns (see Listing 3-6). Gradients can be linear or radial. Patterns can be made up of pixel graphics or even other SVG elements. Figure 3-8 shows a rectangle with a linear color gradient as well as a circle with a gravel texture. The texture comes from a JPEG image that is linked to from an SVG image element.
Listing 3-6. Texturing the Rectangle and Circle
<!doctype html>

<svg width="200" height="200">

  <defs>

    <pattern id="GravelPattern" patternUnits="userSpaceOnUse"

          x="0" y="0" width="100" height="67" viewBox="0 0 100 67">

      <image x="0" y="0" width="100" height="67" xlink:href="gravel.jpg"></image>

    </pattern>


    <linearGradient id="RedBlackGradient">

        <stop offset="0%" stop-color="#000"></stop>

        <stop offset="100%" stop-color="#f00"></stop>

    </linearGradient>

  </defs>


  <rect x="10" y="20" width="100" height="80"

      stroke="red"

      fill="url(#RedBlackGradient)" />

  <circle cx="120" cy="80" r="40" stroke="#00f"

      stroke-width="8"

      fill="url(#GravelPattern)" />

</svg>
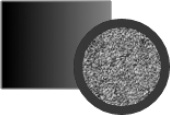
Figure 3-8. A rectangle with a gradient fill and a circle with a pattern fill
SVG Paths
SVG has freeform paths as well as simple shapes. Path elements have d attributes. The “d” stands for data. Inside the value of the d attribute, you can specify a series of path drawing commands. Each command might take coordinate arguments. Some of the commands are M for moveto, L for lineto, Q for quadratic curve, and Z for closing the path. If these remind you of the canvas drawing API, that is no coincidence. Listing 3-7 uses a path element to draw a closed tree canopy shape using a series of lineto commands.
Listing 3-7. SVG Path Defining a Tree Canopy
    <path d="M-25, -50

            L-10, -80

            L-20, -80

            L-5, -110

            L-15, -110

            L0, -140

            L15, -110

            L5, -110

            L20, -80

            L10, -80

            L25, -50

            Z" id="Canopy"></path>
You can fill a path by closing it with the Z command and giving it a fill attribute, just like the rectangle we drew earlier. Figure 3-9 shows how to draw a tree by combining a stroked closed path and a filled closed path.
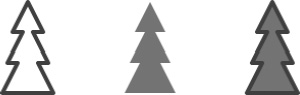
Figure 3-9. A stroked path, a filled path, and both paths
Similarly, we can create an open path with two quadratic curves to form a trail. We can even give it texture. Note the stroke-linejoin attribute in Listing 3-8. This makes a round connection between the two quadratic curves. Figure 3-10 shows a mountain trail drawn as an open path.
Listing 3-8. SVG Path Defining a Twisting Trail
  <g transform="translate(-10, 350)" stroke-width="20" stroke="url(#GravelPattern)" stroke-linejoin="round">

        <path d="M0,0 Q170,-50 260, -190 Q310, -250 410,-250" fill="none"></path>

  </g>
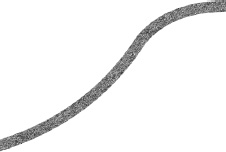
Figure 3-10. An open path containing two quadratic curves
Using SVG Text
SVG also supports text. Text in SVG is selectable within the browser (see Figure 3-11). Should they choose to, browsers and search engines could also allow users to search for text inside of SVG text elements. This has major usability and accessibility benefits.
SVG Text has attributes that are similar to CSS style rules for HTML. Listing 3-9 shows a text element that has font-weight and font-family attributes. As in CSS, font-family can be a single font-family name like “sans-serif” or a list of fallbacks like “Droid Sans, sans-serif” in the order you prefer.
Listing 3-9. SVG Text
<svg width="600" height="200">

  <text

    x="10" y="80"

    font-family="Droid Sans"

    stroke="#00f"

    fill="#0ff"

    font-size="40px"

    font-weight="bold">

    Select this text!

  </text>

</svg>
Figure 3-11. Selecting SVG text
Putting the Scene Together
We can combine all of the preceding elements to make an image of happy trails. The text is, naturally, a text element. The tree trunks are composed of two rectangles. The tree canopies are two paths. The trees cast shadows, which use the same geometry given a gray fill color and a transformation that skews them down and to the right. The winding path that cuts across the image is another path with an image pattern for texture. There is also a little bit of CSS to give the scene an outline.
Listing 3-10 provides the complete code for trails-static.html.
Listing 3-10. Complete Code for trails-static.html
<title>Happy Trails in SVG</title>


<style>

  svg {

        border: 1px solid black;

  }

</style>


<svg width="400" height="600">


  <defs>

        <pattern id="GravelPattern" patternUnits="userSpaceOnUse" x="0" y="0" width="100"

height="67" viewBox="0 0 100 67">

        <image x=0 y=0 width=100 height=67 xlink:href="gravel.jpg" />

        </pattern>

        <linearGradient id="TrunkGradient">

        <stop offset="0%" stop-color="#663300" />

        <stop offset="40%" stop-color="#996600" />

        <stop offset="100%" stop-color="#552200" />

        </linearGradient>


        <rect x="-5" y="-50" width=10 height=50 id="Trunk" />

        <path d="M-25, -50

                L-10, -80

                L-20, -80

                L-5, -110

                L-15, -110

                L0, -140

                L15, -110

                L5, -110

                L20, -80

                L10, -80

                L25, -50

                Z"

        id="Canopy"

        />

        <linearGradient id="CanopyShadow" x=0 y=0 x2=0 y2=100%>

        <stop offset="0%" stop-color="#000" stop-opacity=".5" />

        <stop offset="20%" stop-color="#000" stop-opacity="0" />

        </linearGradient>
        <g id="Tree">

        <use xlink:href="#Trunk" fill="url(#TrunkGradient)" />

        <use xlink:href="#Trunk" fill="url(#CanopyShadow)" />

        <use xlink:href="#Canopy" fill="none" stroke="#663300"

        stroke-linejoin="round" stroke-width="4px" />

        <use xlink:href="#Canopy" fill="#339900" stroke="none" />

        </g>


        <g id="TreeShadow">

        <use xlink:href="#Trunk" fill="#000" />

        <use xlink:href="#Canopy" fill="000" stroke="none" />

        </g>

  </defs>


  <g transform="translate(-10, 350)"

        stroke-width="20"

        stroke="url(#GravelPattern)"

        stroke-linejoin="round">

        <path d="M0,0 Q170,-50 260, -190 Q310, -250 410,-250"

        fill="none" />

  </g>


  <text y=60 x=200

        font-family="impact"

        font-size="60px"

        fill="#996600"

        text-anchor="middle" >

        Happy Trails!

  </text>


  <use xlink:href="#TreeShadow"

        transform="translate(130, 250) scale(1, .6) skewX(-18)"

        opacity="0.4" />

  <use xlink:href="#Tree" transform="translate(130,250)" />


  <use xlink:href="#TreeShadow"

        transform="translate(260, 500) scale(2, 1.2) skewX(-18)"

        opacity="0.4" />


  <use xlink:href="#Tree" transform="translate(260, 500) scale(2)" />

</svg>
Building an Interactive Application with SVG
In this section, we’ll expand on the static example. We will add HTML and JavaScript to make the document interactive. We will take advantage of the capabilities of SVG in an application that would require considerably more code to implement with the canvas API.
Adding Trees
We need just a single button element in this interactive application. The click handler for the button adds a new tree at a random location within the 600x400 pixel SVG region. The new tree is also randomly scaled by an amount between 50% and 150%. Each new tree is actually a <use> element referencing the “Tree” group containing multiple paths. The code uses the namespaced document.createElementNS() call to create a <use> element. It links it with the xlink:href attribute to the previously defined Tree group. It then appends the new element to the SVG element tree (see Listing 3-11).
Listing 3-11. Add Tree Function
  document.getElementById("AddTreeButton").onclick = function() {

    var x = Math.floor(Math.random() * 400);

    var y = Math.floor(Math.random() * 600);

    var scale = Math.random() + .5;

    var translate = "translate(" +x+ "," +y+ ") ";


    var tree = document.createElementNS("http://www.w3.org/2000/svg", "use");

    tree.setAttributeNS("http://www.w3.org/1999/xlink", "xlink:href", "#Tree");

    tree.setAttribute("transform", translate + "scale(" + scale + ")");

    document.querySelector("svg").appendChild(tree);

    updateTrees();

  }
Elements are rendered in the order they appear in the DOM. This function always adds trees as new child nodes at the end of the SVG element’s list of child nodes. That means that newer trees will appear on top of older trees.
This function ends with a call to updateTrees(), which we will see next.
Adding the updateTrees Function
The updateTrees function runs when the document initially loads as well as any time trees are added or removed. It is responsible for updating the text that displays the number of trees in the forest. It also attaches a click handler function to each tree (see Listing 3-12).
Listing 3-12 updateTrees Function
  function updateTrees() {

    var list = document.querySelectorAll("use");

    var treeCount = 0;

    for (var i=0; i<list.length; i++) {

      if(list[i].getAttribute("xlink:href")=="#Tree") {

        treeCount++;

        list[i].onclick = removeTree;

      }

    }

    var counter = document.getElementById("TreeCounter");

    counter.textContent = treeCount + " trees in the forest";

  }
An important thing to note about this code is that it keeps no state in JavaScript regarding the tree count. Every time an update occurs, this code selects and filters all of the trees from the live document to get the latest count.
Adding the removeTree Function
Now, let’s add the function that removes trees when they are clicked (see Listing 3-13).
Listing 3-13. removeTree Function
  function removeTree(e) {

    var elt = e.target;

    if (elt.correspondingUseElement) {

      elt = elt.correspondingUseElement;

    }

    elt.parentNode.removeChild(elt);

    updateTrees();

  }
The first thing we do here is check the target of the click event. Due to differences in DOM implementations, the event target could be either the tree group or a use element linked to that group. Either way, this function simply removes that element from the DOM and calls the updateTrees() function.
If you remove a tree that is on top of another tree, you don’t have to do anything to redraw the lower content. This is one of the benefits of developing against a retained-mode API. You simply manipulate the tree (no pun intended) of elements, and the browser takes care of drawing the necessary pixels. Similarly, when the text updates to display the latest tree count, it stays below the trees. If you want the text to appear above the trees, you will have to append the trees to the document before the text element.
Adding the CSS Styles
To make the interaction more discoverable, we will add some CSS that changes the appearance of the tree beneath the mouse cursor:
g[id=Tree]:hover  {

        opacity: 0.9;

        cursor: crosshair;

  }
Whenever you hover over an element with an id attribute equal to “Tree,” that element will become partially transparent, and the mouse cursor will change to a crosshair.
The one pixel black border around the entire SVG element is also defined in CSS.
  svg {

    border: 1px solid black;

  }
And that’s it! Now you have an interactive application using inline SVG in HTML5 (see Figure 3-12).
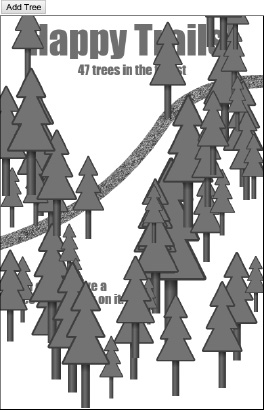
Figure 3-12. The final document with a few trees added
The Final Code
For completeness, Listing 3-14 provides the entire trails-dynamic.html file. It contains all of the SVG from the static version as well as the script that makes it interactive.
Listing 3-14. The Entire trails-dynamic.html Code
<!doctype html>

<title>Happy Trails in SVG</title>


<style>

  svg {

    border: 1px solid black;

  }

  g[id=Tree]:hover  {

    opacity: 0.9;

    cursor: crosshair;

  }

</style>


<div>

  <button id="AddTreeButton">Add Tree</button>
</div>


<svg width="400" height="600">


  <defs>

    <pattern id="GravelPattern" patternUnits="userSpaceOnUse" x="0" y="0" width="100" height="67" viewBox="0 0 100 67">

      <image x=0 y=0 width=100 height=67 xlink:href="gravel.jpg" />

    </pattern>

    <linearGradient id="TrunkGradient">

        <stop offset="0%" stop-color="#663300" />

        <stop offset="40%" stop-color="#996600" />

        <stop offset="100%" stop-color="#552200" />

    </linearGradient>


    <rect x="-5" y="-50" width=10 height=50 id="Trunk" />

    <path d="M-25, -50

            L-10, -80

            L-20, -80

            L-5, -110

            L-15, -110

            L0, -140

            L15, -110

            L5, -110

            L20, -80

            L10, -80

            L25, -50

            Z"

        id="Canopy"

      />

    <linearGradient id="CanopyShadow" x=0 y=0 x2=0 y2=100%>

        <stop offset="0%" stop-color="#000" stop-opacity=".5" />

        <stop offset="20%" stop-color="#000" stop-opacity="0" />

    </linearGradient>

    <g id="Tree">

      <use xlink:href="#Trunk" fill="url(#TrunkGradient)" />

      <use xlink:href="#Trunk" fill="url(#CanopyShadow)" />

      <use xlink:href="#Canopy" fill="none" stroke="#663300"

         stroke-linejoin="round" stroke-width="4px" />

      <use xlink:href="#Canopy" fill="#339900" stroke="none" />

    </g>

  </defs>


  <g transform="translate(-10, 350)"

      stroke-width="20"

      stroke="url(#GravelPattern)"

      stroke-linejoin="round">

        <path d="M0,0 Q170,-50 260, -190 Q310, -250 410,-250"

          fill="none" />

  </g>
  <text y=60 x=200

    font-family="impact"

    font-size="60px"

    fill="#996600"

    text-anchor="middle" >

    Happy Trails!

  </text>

  <text y=90 x=200

    font-family="impact"

    font-size="20px"

    fill="#996600"

    text-anchor="middle" id="TreeCounter">

  </text>


  <text y=420 x=20

    font-family="impact"

    font-size="20px"

    fill="#996600"

    text-anchor="left">

    <tspan>You can remove a</tspan>

    <tspan y=440 x=20>tree by clicking on it.</tspan>

  </text>


  <use xlink:href="#Tree" transform="translate(130,250)" />

  <use xlink:href="#Tree" transform="translate(260, 500) scale(2)" />

</svg>


<script>

  function removeTree(e) {

    var elt = e.target;

    if (elt.correspondingUseElement) {

      elt = elt.correspondingUseElement;

    }

    elt.parentNode.removeChild(elt);

    updateTrees();

  }


  document.getElementById("AddTreeButton").onclick = function() {

    var x = Math.floor(Math.random() * 400);

    var y = Math.floor(Math.random() * 600);

    var scale = Math.random() + .5;

    var translate = "translate(" +x+ "," +y+ ") ";


    var tree = document.createElementNS("http://www.w3.org/2000/svg", "use");

    tree.setAttributeNS("http://www.w3.org/1999/xlink", "xlink:href", "#Tree");

    tree.setAttribute("transform", translate + "scale(" + scale + ")");

    document.querySelector("svg").appendChild(tree);

    updateTrees();

  }


  function updateTrees() {

    var list = document.querySelectorAll("use");
    var treeCount = 0;

    for (var i=0; i<list.length; i++) {

      if(list[i].getAttribute("xlink:href")=="#Tree") {

        treeCount++;

        list[i].onclick = removeTree;

      }

    }

    var counter = document.getElementById("TreeCounter");

    counter.textContent = treeCount + " trees in the forest";

  }


  updateTrees();

</script>
SVG TOOLS
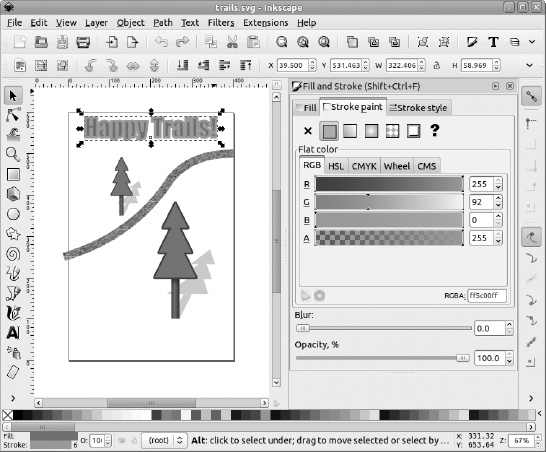
Figure 3-13. Modifying the stroke of a text element in Inkscape
Summary
In this chapter, you have seen how SVG in HTML5 provides a powerful way to create applications with interactive two dimensional graphics.
First we looked at a scene drawn using SVG embedded in an HTML5 document. We examined the elements and attributes that made up the drawing. We saw how you can define and reuse content definitions, group and transform elements, and draw with shapes, paths, and text.
Finally, we added JavaScript to an SVG document to make an interactive application. We used CSS, DOM manipulation, and events to take advantage of SVG’s nature as a live document.
Now that we’ve seen how SVG brings vector graphics to HTML5, we’ll turn our attention to audio-visual elements that bring more complex media to your application.