
C H A P T E R 2
Using the Canvas API
In this chapter, we’ll explore what you can do with the Canvas API—a cool API that enables you to dynamically generate and render graphics, charts, images, and animation. We’ll walk you through using the basics of the rendering API to create a drawing that can scale and adjust to the browser environment. We’ll show you how to create dynamic pictures based on user input in a heatmap display. Of course, we’ll also alert you to the pitfalls of using Canvas and share tricks to overcome them.
This chapter presumes only a minimal amount of graphics expertise, so don’t be afraid to jump in and try out one of the most powerful features of HTML5.
Overview of HTML5 Canvas
An entire book could be written about the use of the Canvas API (and it wouldn’t be a small book). Because we have only a chapter, we’re going to cover (what we think is) the most commonly used functionality in this very extensive API.
History
The canvas concept was originally introduced by Apple to be used in Mac OS X WebKit to create dashboard widgets. Before the arrival of canvas, you could only use drawing APIs in a browser through plug-ins such as Adobe plug-ins for Flash and Scalable Vector Graphics (SVG), Vector Markup Language (VML) only in Internet Explorer, or other clever JavaScript hacks.
Try, for example, to draw a simple diagonal line without a canvas element—it sounds easy, but it is a fairly complex task if you do not have a simple two-dimensional drawing API at your disposal. Canvas provides just that, and because it is an extremely useful thing to have in the browser, it was added to the HTML5 specification.
Early on, Apple hinted at possibly reserving the intellectual property rights in the WHATWG draft of the canvas specification, which caused concern at the time among some followers of web standardization. In the end, however, Apple disclosed the patents under the W3C's royalty-free patent licensing terms.
SVG versus Canvas
What Is a Canvas?
When you use a canvas element in your web page, it creates a rectangular area on the page. By default, this rectangular area is 300 pixels wide and 150 pixels high, but you can specify the exact size and set other attributes for your canvas element. Listing 2-1 shows the most basic canvas element that can be added to an HTML page.
Listing 2-1. A Basic Canvas Element
<canvas></canvas>
Once you have added a canvas element to your page, you can use JavaScript to manipulate it any way you want. You can add graphics, lines, and text to it; you can draw on it; and you can even add advanced animations to it.
The Canvas API supports the same two-dimensional drawing operations that most modern operating systems and frameworks support. If you have ever programmed two-dimensional graphics in recent years, you will probably feel right at home with the Canvas API because it is designed to be similar to existing systems. If you haven’t, you’re about to discover how much more powerful a rendering system can be than the previous images and CSS tricks developers have used for years to create web graphics.
To programmatically use a canvas, you have to first get its context. You can then perform actions on the context and finally apply those actions to the context. You can think of making canvas modifications as similar to database transactions: you start a transaction, perform certain actions, and then commit the transaction.
Canvas Coordinates
As shown in Figure 2-1, coordinates in a canvas start at x=0,y=0 in the upper-left corner—which we will refer to as the origin—and increase (in pixels) horizontally over the x-axis and vertically over the y-axis.
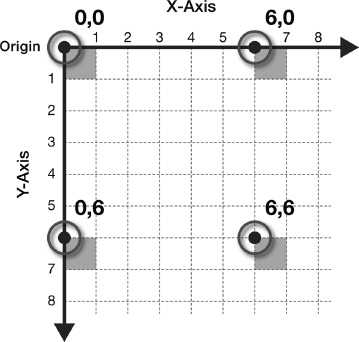
Figure 2-1. x and y coordinates on a canvas
When Not to Use Canvas
Although the canvas element is great and very useful, you should not use the canvas element when another element will suffice. For example, it would not be a good idea to dynamically draw all the different headings for an HTML document on a canvas instead of simply using heading styles (H1, H2, and so on) that are meant for that purpose.
Fallback Content
In case your web page is accessed by a browser that does not support the canvas element or a subset of the Canvas API features, it is a good idea to provide an alternate source. For example, you can provide an alternate image or just some text that explains what the user could be enjoying if they actually used a modern browser. Listing 2-2 shows how alternate text can be specified inside a canvas element. Browsers that do not support the canvas element will simply render this fallback content.
Listing 2-2. Use of Fallback Text Inside a Canvas Element
<canvas>

  Update your browser to enjoy canvas!

</canvas>
Instead of the previous text shown, you can also point to an image that can be displayed in case the browser does not support the canvas element.
What About Canvas Accessibility?
One of the current proposals from the HTML5 designers for handling alternate, accessible canvas content is to use this fallback content section. However, in order for this to be useful for screen readers and other accessibility tools, the fallback content needs to be keyboard navigable even when a canvas is supported and displayed. While some browsers are supporting this capability now, you should not rely on it to support users with special needs. Using a separate section of the page to display canvas alternatives is recommended for now. As an added bonus, many users might enjoy using alternative controls or displays as a better way to quickly understand and navigate the page or application.
Future iterations of the Canvas API might also include focusable sub-areas of the canvas display and controls to interact with them. If your image display requires significant interaction, however, consider using SVG as an alternative to the Canvas API. SVG also allows drawing, but it integrates with the browser DOM as well.
CSS and Canvas
As with most HTML elements, CSS can be applied to the canvas element itself to add borders, padding, margins, etc. Additionally, some CSS values are inherited by the contents of the canvas; fonts are a good example, as fonts drawn into a canvas default to the settings of the canvas element itself.
Furthermore, properties set on the context used in canvas operations follow the syntax you may already be familiar with from CSS. Colors and fonts, for example, use the same notation on the context that they use throughout any HTML or CSS document.
Browser Support for HTML5 Canvas
With the arrival of Internet Explorer 9, all browser vendors now provide support for HTML5 Canvas, and it is already in the hands of a majority of users. This is a major milestone in web development, allowing 2D drawing to thrive on the modern Web.
In spite of the dwindling market share of previous versions of Internet Explorer, it is still a good idea to first test whether HTML5 Canvas is supported before you use the APIs. The section “Checking for Browser Support” later in this chapter will show you how you can programmatically check for browser support.
Using the HTML5 Canvas APIs
In this section, we’ll explore the use of the Canvas APIs in more detail. For the sake of illustration—no pun intended—we will use the various Canvas APIs to build a logo-like display of a forest scene with trees and a beautiful trail-running path suitable for a long-distance race event. Although our example will not win any awards for graphical design, it should serve to illustrate the various capabilities of HTML5 Canvas in a reasonable order.
Checking for Browser Support
Before you use the canvas element, you will want to make sure there is support in the browser. This way, you can provide some alternate text in case there is no support in their antique browser. Listing 2-3 shows one way you can use to test for browser support.
Listing 2-3. Checking for Browser Support
try {

  document.createElement("canvas").getContext("2d");

  document.getElementById("support").innerHTML =

    "HTML5 Canvas is supported in your browser.";

} catch (e) {

  document.getElementById("support").innerHTML = "HTML5 Canvas is not supported

                                                  in your browser.";

}
In this example, you try to create a canvas object and access its context. If there is an error, you will catch it and know that Canvas is not supported. A previously defined support element on the page is updated with a suitable message to reflect whether there is browser support or not.
This test will indicate whether the canvas element itself is supported by the browser. It will not indicate which capabilities of the Canvas are supported. At the time of this writing, the API is stable and well-supported, so this should generally not be an issue to worry about.
Additionally, it is a good idea to supply fallback content to your canvas element, as shown in Listing 2-3.
Adding a Canvas to a Page
Adding a canvas element in an HTML page is pretty straight-forward. Listing 2-4 shows the canvas element that can be added to an HTML page.
Listing 2-4. The Canvas Element
<canvas height="200" width="200"></canvas>
The resulting canvas will show up as an “invisible” 200 × 200 pixel rectangle on your page. If you want to add a border around it, you could use the HTML code shown in Listing 2-5 to style the canvas with normal CSS borders.
Listing 2-5. Canvas Element with a Solid Border
<canvas id="diagonal" style="border: 1px solid;" width="200" height="200">

</canvas>
Note the addition of the ID diagonal to make it easy to locate this canvas element programmatically. An ID attribute is crucial to any canvas because all the useful operations on this element must be done through scripting. Without an ID, you will have difficulty locating the element to interoperate with it.
Figure 2-2 shows what the canvas in Listing 2-5 would look like in a browser.
Figure 2-2. A simple HTML5 canvas element on an HTML page
Not very exciting, but as any artist would tell you, it is full of potential. Now, let’s do something with this pristine canvas. As mentioned before, it is not easy to draw a diagonal line on a web page without HTML5 Canvas. Let’s see how easy it is now that we can use Canvas. Listing 2-6 shows how, with just a few lines of code, you can draw a diagonal line on the canvas we added to the page earlier.
Listing 2-6. Creating a Diagonal Line on a Canvas
<script>

  function drawDiagonal() {

    // Get the canvas element and its drawing context

    var canvas = document.getElementById('diagonal'),

    var context = canvas.getContext('2d'),


    // Create a path in absolute coordinates

    context.beginPath();

    context.moveTo(70, 140);

    context.lineTo(140, 70);


    // Stroke the line onto the canvas

    context.stroke();

  }


   window.addEventListener("load", drawDiagonal, true);

</script>
Let’s examine the JavaScript code used to create the diagonal line. It is a simple example, but it captures the essential flow of working with the Canvas API:
You first gain access to the canvas object by referencing a particular canvas’s ID value. In this example, the ID is diagonal. Next, you create a context variable and you call the canvas object’s getContext method, passing in the type of canvas you are looking for. You pass in the string “2d” to get a two-dimensional context—the only available context type at this time.
![]() Note Much work has already been completed on a three-dimensional version of the Canvas context. Version 1.0 of the WebGL specification, a joint effort from browser vendors and the Khronos Group, was released in early 2011. WebGL is based on the same concepts and designs as the popular OpenGL library, bringing a similar API to JavaScript and HTML5. To create a three-dimensional drawing context in a supporting browser, you simply use the string
Note Much work has already been completed on a three-dimensional version of the Canvas context. Version 1.0 of the WebGL specification, a joint effort from browser vendors and the Khronos Group, was released in early 2011. WebGL is based on the same concepts and designs as the popular OpenGL library, bringing a similar API to JavaScript and HTML5. To create a three-dimensional drawing context in a supporting browser, you simply use the string "webgl" as the argument to getContext. The resulting context has an entirely new set of drawing APIs: capabilities that are thorough and complex enough for their own book. Although some browsers are shipping implementations of WebGL today, not all vendors are on board. However, the potential of three-dimensional rendering on the Web is compelling enough that we expect rapid uptake of support in the next few years. For more information, consult the WebGL site at the Khronos Group (http://www.khronos.org/webgl). We will touch on WebGL in a little more detail in the final chapter of this book.
You then use the context to perform drawing operations. In this case, you can create the diagonal line by calling three methods—beginPath, moveTo, and lineTo—passing in the line’s start and end coordinates.
The drawing methods moveTo and lineTo do not actually create the line; you finalize a canvas operation and draw the line by calling the context.stroke(); method. Figure 2-3 shows the diagonal line created with the example code.
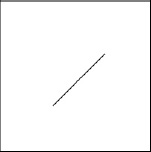
Figure 2-3. Diagonal line on a canvas
Triumph! Although this simple line may not appear to be the start of a revolution, keep in mind that drawing a diagonal line between two arbitrary points using classic HTML techniques was a very difficult maneuver involving stretched images, strange CSS and DOM objects, or other forms of black magic. Let us never speak of them again.
As you can see from this example’s code, all operations on the canvas are performed via the context object. This will hold true for the rest of your interaction with the canvas because all the important functions with visual output are accessible only from the context, not the canvas object itself. This flexibility allows the canvas to support different types of drawing models in the future, based on the type of context that is retrieved from the canvas. Although we will frequently refer in this chapter to actions we will take on the canvas, keep in mind that this actually means that we will be working with the context object that the canvas supplies.
As demonstrated in the previous example, many operations on the context do not immediately update the drawing surface. Functions such as beginPath, moveTo, and lineTo do not modify the canvas appearance immediately. The same is true of many functions that set the styling and preferences of the canvas. Only when a path is stroked or filled does it appear on the display. Otherwise, the canvas will only be immediately updated when images are displayed, text is shown, or rectangles are drawn, filled, or cleared.
Applying Transformations to Drawings
Now let’s look at another wayto draw on the canvas using transformation. In the following example, the result is identical to the previous example, but the code used to draw the diagonal line is different. For this simple example, you could argue that the use of transformation adds unnecessary complexity. However, you can think of using transformation as a best practice for more complex canvas operations. You’ll see that we’ll use it a lot throughout the remaining examples, and it is critical to understanding the Canvas API’s complex capabilities.
Perhaps the easiest way to think of the transformation system—at least, the easiest way that does not involve a great amount of mathematical formulae and hand-waving—is as a modification layer that sits between the commands you issue and the output on the canvas display. This modification layer is always present, even if you choose not to interact with it.
Modifications, or transformations in the parlance of drawing systems, can be applied sequentially, combined, and modified at will. Every drawing operation is passed through the modification layer to be modified before it appears on the canvas. Although this adds an extra layer of complexity, it also adds tremendous power to the drawing system. It grants access to the powerful modifications that modern image-editing tools support in real time, yet in an API that is only as complex as it absolutely needs to be.
Don’t be fooled into thinking that you are optimizing performance if you don’t use transformation calls in your code. The canvas implementation uses and applies transformations implicitly in its rendering engine, whether or not you call them directly. It is wiser to understand the system up front because it will be crucial to know if you step outside the most basic drawing operations.
A key recommendation for reusable code is that you usually want to draw at the origin (coordinate 0,0) and apply transformations—scale, translate, rotate, and so forth—to modify your drawing code into its final appearance, as shown in Figure 2-4.
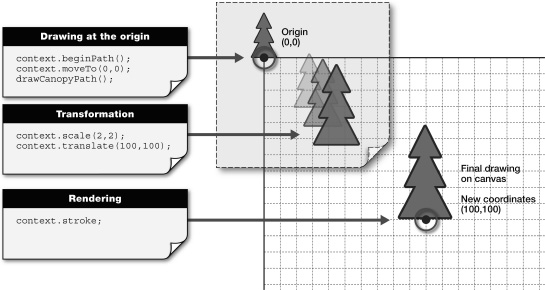
Figure 2-4. Overview of transformation and drawing at the origin
Listing 2-7 shows this best practice in action using the simplest transform: translate.
Listing 2-7. Using Translation to Create a Diagonal Line on a Canvas
<script>
  function drawDiagonal() {

    var canvas = document.getElementById('diagonal'),

    var context = canvas.getContext('2d'),


    // Save a copy of the current drawing state

    context.save();


    // Move the drawing context to the right, and down

    context.translate(70, 140);


    // Draw the same line as before, but using the origin as a start

    context.beginPath();

    context.moveTo(0, 0);

    context.lineTo(70, -70);

    context.stroke();


    // Restore the old drawing state

    context.restore();

  }


  window.addEventListener("load", drawDiagonal, true);

</script>
Let’s examine the JavaScript code used to create this second, translated diagonal line.
- First, you access the canvas object by referencing its ID value (in this case, diagonal).
- You then retrieve a context variable by calling the canvas object’s getContext function.
- Next, you want to save the still unmodified context so you can get back to its original state at the end of the drawing and transformation operation. If you do not save the state, the modifications you’re making during the operation (translate, scale, and so on) will continue to be applied to the context in future operations, and that might not be desirable. Saving the context state before transforming it will allow us to restore it later.
- The next step is to apply the translate method to the context. With this operation, the translation coordinates you supply will be added to the eventual drawing coordinates (the diagonal line) at the time any drawing is rendered, thus moving the line to its final location, but only after the drawing operation is complete.
- After the translation has been applied, you can perform the normal drawing operations to create the diagonal line. In this case, you can create the diagonal line by calling three methods—beginPath, moveTo, and lineTo—this time drawing at the origin (0,0) instead of coordinates 70,140.
- After the line has been sketched, you can render it to the canvas (for example, draw the line) by calling the context.stroke method.
- Finally, you restore the context to its clean original state, so that future canvas operations are performed without the translation that was applied in this operation. Figure 2-5 shows the diagonal line created with the example code.
Figure 2-5. Translated diagonal line on a canvas
Even though your new line looks remarkably like the old one, you created it using the power of transformations, something that will become more apparent as we progress through the rest of this chapter.
Working with Paths
Although we could offer many more exciting examples for drawing lines, we are ready now to progress to something a bit more complex: paths. Paths in the HTML5 Canvas API represent any shape you care to render. Our original line example was a path, as you might have gathered from the conspicuous beginPath call used to start it off. But paths can be as complicated as you desire, with multiple line and curve segments and even subpaths. If you are looking to draw almost any shape on a canvas, the path API will be your focus point.
When embarking on any routine to draw a shape or path, the first call you make is beginPath. This simple function takes no arguments, but it signals to the canvas that you wish to start a new shape description. This function is mostly useful to the canvas so that it can calculate the interior and exterior of the shape you are creating for later fills and strokes.
A path always tracks the concept of a current location, which defaults to the origin. The canvas internally tracks the current location, but you will modify it with your drawing routines.
Once the shape is begun, you can use a variety of functions on the context to plot the layout of your shape. You’ve already seen the simplest context pathing functions in action:
moveTo(x, y): moves the current location to a new destination of (x, y) without drawing.lineTo(x, y): moves the current location to a new destination of (x, y) drawing a straight line from the current position to the new one.
Essentially, the difference between these two calls is that the first is akin to lifting a drawing pen and moving to a new location, whereas the second tells the canvas to leave the pen on the paper and move it in a straight line to the new destination. However, it is worth pointing out again that no actual drawing occurs until you stroke or fill the path. At present, we are merely defining the positions in our path so that it can be drawn later.
The next special pathing function is a call to closePath. This command is very similar in behavior to the lineTo function, with the difference being that the destination is automatically assumed to be the origination of the path. However, the closePath also informs the canvas that the current shape has closed or formed a completely contained area. This will be useful for future fills and strokes.
At this point, you are free to continue with more segments in your path to create additional subpaths. Or you can beginPath at any time to start over and clear the path list entirely.
As with most complex systems, it is often better to see them in action. Let’s depart from our line examples and use the Canvas API to start to create a new scene that illustrates a forest with a trail-running path. This scene will serve as a logo of sorts for our race event. And as with any picture, we will start with a basic element, which in this case is the canopy of a simple pine tree. Listing 2-8 shows how to draw the pine tree’s canopy.
Listing 2-8. Function That Creates a Path for a Tree Canopy
function createCanopyPath(context) {

  // Draw the tree canopy

  context.beginPath();


  context.moveTo(-25, -50);

  context.lineTo(-10, -80);

  context.lineTo(-20, -80);

  context.lineTo(-5, -110);

  context.lineTo(-15, -110);


  // Top of the tree

  context.lineTo(0, -140);


  context.lineTo(15, -110);

  context.lineTo(5, -110);

  context.lineTo(20, -80);

  context.lineTo(10, -80);

  context.lineTo(25, -50);


  // Close the path back to its start point

  context.closePath();

}
As you can see from the code, we used the same move and line commands from before, but more of them. These lines form the branches of a simple tree shape, and we close the path back at the end. Our tree will leave a notable gap at the bottom, and we will use this in future sections to draw the trunk. Listing 2-9 shows how to use that canopy drawing function to actually render our simple tree shape onto a canvas.
Listing 2-9. Function That Draws a Tree on the Canvas
function drawTrails() {

  var canvas = document.getElementById('trails'),

  var context = canvas.getContext('2d'),


  context.save();

  context.translate(130, 250);


  // Create the shape for our canopy path

  createCanopyPath(context);
  // Stroke the current path

  context.stroke();

  context.restore();

}
All the calls in this routine should be familiar to you already. We fetch the canvas context, save it for future reference, translate our position to a new location, draw the canopy, stroke it onto the canvas, and then restore our state. Figure 2-6 shows the results of our handiwork, a simply line representation of a tree canopy. We’ll expand on this as we go forward, but it’s a good first step.
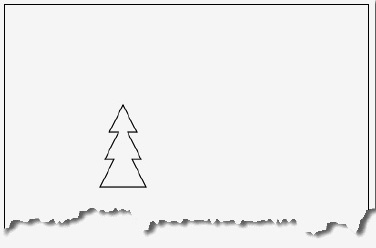
Figure 2-6. A simple path of a tree canopy
Working with Stroke Styles
The Canvas API wouldn’t be powerful or popular if developers were stuck using simple stick drawings and black lines. Let’s use the stroke styling capabilities to make our canopy a little more tree-like. Listing 2-10 shows some basic commands that can modify the properties of the context in order to make the stroked shape look more appealing.
Listing 2-10. Using a Stroke Style
// Increase the line width

context.lineWidth = 4;


// Round the corners at path joints

context.lineJoin = 'round';


// Change the color to brown

context.strokeStyle = '#663300';


// Finally, stroke the canopy

context.stroke();
By adding the above properties before stroking, we change the appearance of any future stroked shapes—at least until we restore the context back to a previous state.
First, we increase the width of the stroked lines to four pixels.
Next, we set the lineJoin property to round, which causes the joints of our shape’s segments to take on a more rounded corner shape. We could also set the lineJoin to bevel or miter (and the corresponding context.miterLimit value to tweak it) to choose other corner options.
Finally, we change the color of the stroke by using the strokeStyle property. In our example, we are setting the color to a CSS value, but as you will see in later sections, it is also possible to set the strokeStyle to be an image pattern or a gradient for fancier displays.
Although we are not using it here, we could also set the lineCap property to be either butt, square, or round to specify how lines should display at the endpoints. Alas, our example has no dangling line ends. Figure 2-7 shows our spruced-up tree canopy, nowstroked with a wider, smoother, brown line instead of the flat black line from before.
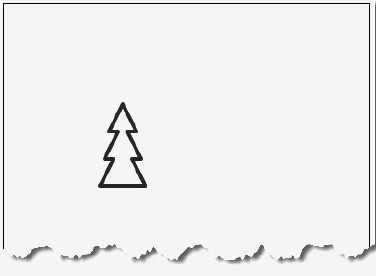
Figure 2-7. Stylish stroked tree canopy
Working with Fill Styles
As you might expect, stroking is not the only way to affect the appearance of canvas shapes. The next common way to modify a shape is to specify how its paths and subpaths are filled. Listing 2-11 shows how simple it is to fill our canopy with a pleasant, green color.
Listing 2-11. Using a Fill Style
// Set the fill color to green and fill the canopy

context.fillStyle = '#339900';

context.fill();
First, we set the fillStyle to the appropriate color. As we will see later, it is also possible to set the fill to be a gradient or an image pattern. Then, we simply call the context’s fill function to let the canvas fill all the pixels inside all the closed paths of our current shape, as shown in Figure 2-8.
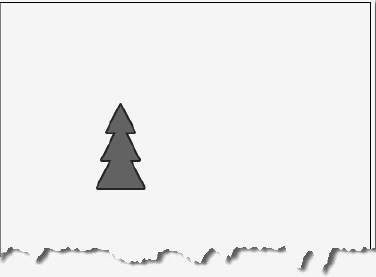
Figure 2-8. Filled tree canopy
Because we stroked our canopy before filling it, the fill covers part of the stroked path. This is due to the fact that the wide stroke—in our case, four pixels wide—is centered along the line of the path shape. The fill applies to all pixels on the interior of the shape, and as such it will cover half of the stroked line pixels. Should you prefer the full stroke to appear, you can simply fill before stroking the path.
Filling Rectangular Content
Every tree deserves a strong foundation. Thankfully, we left space for our tree trunk in the original shape path. Listing 2-12 shows how we can add the simplest rendering of a tree trunk by using the fillRect convenience function.
Listing 2-12. Using the fillRect Convenience Function
// Change fill color to brown

context.fillStyle = '#663300';


// Fill a rectangle for the tree trunk

context.fillRect(-5, -50, 10, 50);
Here, we once again set a brown fill style. But instead of explicitly drawing the corners of our trunk rectangle using the lineTo ability, we will draw the entire trunk in one step by using fillRect. The fillRect call takes the x and y location, as well as the width and height, and then immediately fills it with the current fill style.
Although we are not using them here, corresponding functions exist to strokeRect and clearRect. The former will draw the outline of the rectangle based on a given position and dimension, while the latter will remove any content from the rectangular area and reset it to its original, transparent color.
Figure 2-9 shows our simple, flatly filled tree trunk attached to our previous canopy path.
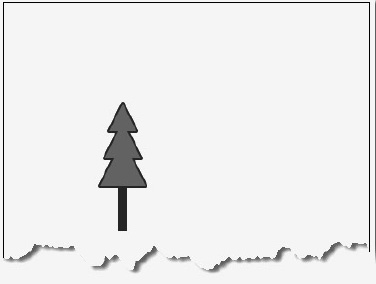
Figure 2-9. Tree with filled rectangular trunk
Drawing Curves
The world, particularly the natural world, is not filled with straight lines and rectangles. Fortunately, the canvas provides a variety of functions for creating curves in our paths. We will demonstrate the simplest option—a quadratic curve—to form a path through our virtual forest. Listing 2-13 demonstrates the addition of two quadratic curves.
Listing 2-13. Drawing a Curve
// Save the canvas state and draw the path

context.save();


context.translate(-10, 350);

context.beginPath();


// The first curve bends up and right
context.moveTo(0, 0);

context.quadraticCurveTo(170, -50, 260, -190);


// The second curve continues down and right

context.quadraticCurveTo(310, -250, 410,-250);


// Draw the path in a wide brown stroke

context.strokeStyle = '#663300';

context.lineWidth = 20;

context.stroke();


// Restore the previous canvas state

context.restore();
As before, one of the first things we will do is save our canvas context state, because we will be modifying the translation and stroke options here. For our forest path, we will start by moving back to the origin and drawing a first quadratic curve up and to the right.
As shown in Figure 2-10, the quadraticCurveTo function begins at the current drawing location and takes two x, y point locations as its parameters. The second one is the final stop in our curve. The first one represents a control point. The control point sits to the side of the curve (not on it) and acts almost as a gravitational pull for the points along the curve path. By adjusting the location of the control point, you can adjust the curvature of the path you are drawing. We draw a second quadratic curve up and to the right to complete our path; then stroke it just as we did for our tree canopy before (only wider).
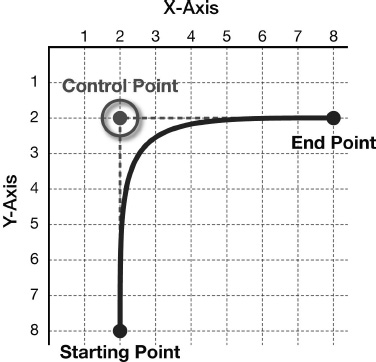
Figure 2-10. Quadratic curve start, end, and control points
Other options for curves in the HTML5 Canvas API include the bezierCurveTo, arcTo, and arc functions. These curves take additional control points, a radius, or angles to determine the characteristics of the curve. Figure 2-11 shows the two quadratic curves stroked on our canvas to create a path through the trees.
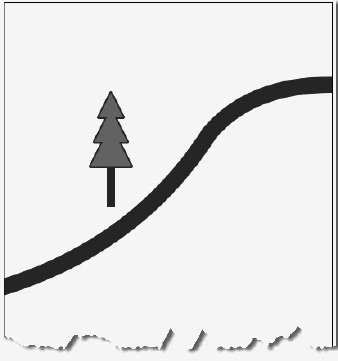
Figure 2-11. Quadratic curves for a path
Inserting Images into a Canvas
Images can be extremely handy to display inside a canvas. They can be stamped, stretched, modified with transformations, and often be the focus of the entire canvas. Thankfully, the Canvas API includes a few simple commands for adding image content to the canvas.
But images also add a complication to the canvas operations: you must wait for them to load. Browsers will usually be loading images asynchronously as your page script is rendering. However, if you attempt to render an image onto a canvas before it has completely loaded, the canvas will fail to render any image at all. As such, you should be careful to make sure the image is loaded completely before you attempt to render it.
To solve this problem in our simple forest trail example, we will load an image of a bark texture to use directly in the canvas. In order to make sure that the image has completed loading before we render, we will switch the loading code to only execute as a callback from image loading completion, as shown in Listing 2-14.
Listing 2-14. Loading the Image
// Load the bark image

var bark = new Image();

bark.src = "bark.jpg";


// Once the image is loaded, draw on the canvas
bark.onload = function () {

  drawTrails();

}
As you can see, we’ve added an onload handler to the bark.jpg image to call the main drawTrails function only when the image loading has completed. This guarantees that the image will be available to the next calls we add to the canvas rendering, as shown in Listing 2-15.
Listing 2-15. Drawing an Image on a Canvas
// Draw the bark pattern image where

//  the filled rectangle was before

context.drawImage(bark, -5, -50, 10, 50);
Here, we have replaced the previous call to fillRect with a simple routine to display our bark image as the new trunk for our tree. Although the image is a subtle replacement, it provides more texture to our display. Note that in this call, we are specifying an x, y, width, and height argument in addition to the image itself. This option will scale the image to fit into the 10 × 50 pixel space that we have allocated for our trunk. We could also have passed in source dimensions to have more control over the clipping area of the incoming image to be displayed.
As you can see in Figure 2-12, the change to the appearance of our trunk is only slightly different from the filled rectangle we used before.
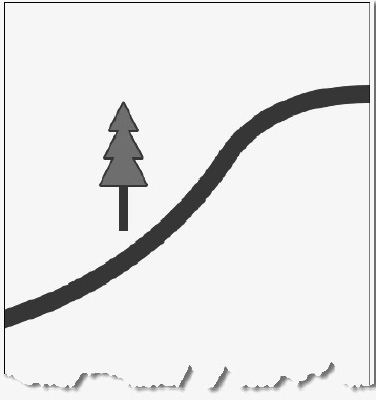
Figure 2-12. Tree with an image used for trunk
Using Gradients
Not satisfied with the tree trunk? Well, neither are we. Let’s take another approach to drawing our tree trunk that uses a little more finesse: gradients. Gradients allow you to apply a gradual algorithmic sampling of colors as either a stroke or fill style, just like the patterns were applied in the last section. Creating gradients requires a three-step process:
- Create the gradient object itself.
- Apply color stops to the gradient object, signaling changes in color along the transition.
- Set the gradient as either a fillStyle or a strokeStyle on the context.
It is perhaps easiest to think of gradients as a smooth change of color that moves along a line. For example, if you supply points A and B as the arguments to the creation of a gradient, the color will be transitioned for any stroke or fill that moves in the direction of point A to point B.
To determine what colors are displayed, simply use the addColorStop function on the gradient object itself. This function allows you to specify an offset and a color. The color argument is the color you want to be applied in the stroke or fill at the offset position. The offset position is a value between 0.0 and 1.0, representing how far along the gradient line the color should be reached.
If you create a gradient from point (0,0) to point (0,100) and specify a white color stop at offset 0.0 and a black offset at offset 1.0, then when the stroke or fill occurs, you will see the color gradually shift from white (the beginning color stop) to black (the end color stop) as the rendering moves from point (0,0) to point (0,100).
As with other color values, it is possible to supply an alpha (for example, transparency) value as part of the color and make that alpha value transition as well. To do so, you will need to use another textual representation of the color value, such as the CSS rgba function that includes an alpha component.
Let’s see this in more detail with a code sample that applies two gradients to a fillRect representing our final tree trunk, as shown in Listing 2-16.
Listing 2-16. Using a Gradient
// Create a 3 stop gradient horizontally across the trunk

var trunkGradient = context.createLinearGradient(-5, -50, 5, -50);


// The beginning of the trunk is medium brown

trunkGradient.addColorStop(0, '#663300'),


// The middle-left of the trunk is lighter in color

trunkGradient.addColorStop(0.4, '#996600'),


// The right edge of the trunk is darkest

trunkGradient.addColorStop(1, '#552200'),


// Apply the gradient as the fill style, and draw the trunk

context.fillStyle = trunkGradient;

context.fillRect(-5, -50, 10, 50);


// A second, vertical gradient creates a shadow from the

//  canopy on the trunk

var canopyShadow = context.createLinearGradient(0, -50, 0, 0);
// The beginning of the shadow gradient is black, but with

//  a 50% alpha value

canopyShadow.addColorStop(0, 'rgba(0, 0, 0, 0.5)'),


// Slightly further down, the gradient completely fades to

//  fully transparent. The rest of the trunk gets no shadow.

canopyShadow.addColorStop(0.2, 'rgba(0, 0, 0, 0.0)'),


// Draw the shadow gradient on top of the trunk gradient

context.fillStyle = canopyShadow;

context.fillRect(-5, -50, 10, 50);
Applying these two gradients creates a nice, smooth light source on our rendered tree as shown in Figure 2-13, making it appear curved and covered by a slight shadow from the canopy above. Let’s keep it.
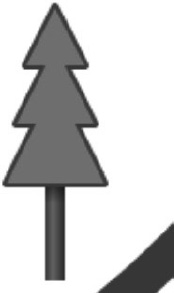
Figure 2-13. Tree with gradient trunk
Besides the linear gradient used in our example, the Canvas API also supports a radial gradient option that allows you to specify two circular representations in which the color stops are applied to the cone between the two circles. The radial gradient uses the same color stops as the linear gradient, but takes its arguments in the form shown in Listing 2-17.
Listing 2-17. Example of Applying a Radial Gradient
createRadialGradient(x0, y0, r0, x1, y1, r1)
In this example, the first three arguments represent a circle centered at (x0, y0) with radius r0, and the last three arguments represent a second circle centered at (x1, y1) with radius r1. The gradient is drawn across the area between the two circles.
Using Background Patterns
Direct rendering of images has many uses, but in some cases it is beneficial to use an image as a background tile, similar to the capability available in CSS. We’ve already seen how it is possible to set a stroke or fill style to be a solid color. The HTML5 Canvas API also includes an option to set an image as a repeatable pattern for either a path stroke or fill.
To make our forest trail appear a bit more rugged, we will demonstrate the capability by replacing the previous stroked trail curve with one that uses a background image fill. In doing so, we’ll swap out our now-unused bark image for a gravel image that we will put to use here. Listing 2-18 shows we replace the call to drawImage with a call to createPattern.
Listing 2-18. Using a Background Pattern
// Replace the bark image with

// a trail gravel image

var gravel = new Image();

gravel.src = "gravel.jpg";

gravel.onload = function () {

    drawTrails();

}


// Replace the solid stroke with a repeated

// background pattern

context.strokeStyle = context.createPattern(gravel, 'repeat'),

con text.lineWidth = 20;

context.stroke();
As you can see, we are still calling stroke() for our path. However, this time we have set a strokeStyle property on the context first, passing in the result of a call to context.createPattern. Oh, and once again the image needs to be previously loaded in order for the canvas to perform the operation. The second argument is a repetition pattern that can be one of the choices shown in Table 2-1.
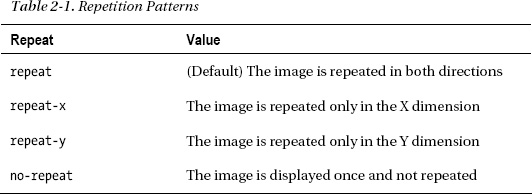
Figure 2-14 shows the result of the use of a background image rather than an explicitly drawn image to represent our trail.
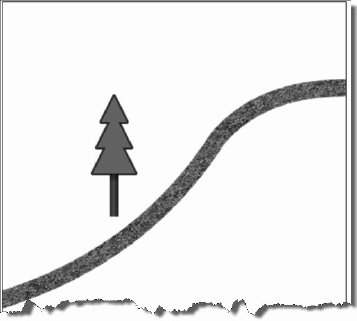
Figure 2-14. A trail with a repeating background pattern
Scaling Canvas Objects
What kind of forest has only one tree? Let’s fix that right away. To make this a little easier, we will adjust our code sample to isolate the tree drawing operations to a single routine, called drawTree, as shown in Listing 2-19.
Listing 2-19. Function to Draw the Tree Object
// Move tree drawing into its own function for reuse

function drawTree(context) {

  var trunkGradient = context.createLinearGradient(-5, -50, 5, -50);

  trunkGradient.addColorStop(0, '#663300'),

  trunkGradient.addColorStop(0.4, '#996600'),

  trunkGradient.addColorStop(1, '#552200'),

  context.fillStyle = trunkGradient;

  context.fillRect(-5, -50, 10, 50);


  var canopyShadow = context.createLinearGradient(0, -50, 0, 0);

  canopyShadow.addColorStop(0, 'rgba(0, 0, 0, 0.5)'),

  canopyShadow.addColorStop(0.2, 'rgba(0, 0, 0, 0.0)'),

  context.fillStyle = canopyShadow;

  context.fillRect(-5, -50, 10, 50);


  createCanopyPath(context);


  context.lineWidth = 4;

  context.lineJoin = 'round';

  context.strokeStyle = '#663300';
  context.stroke();


  context.fillStyle = '#339900';

  context.fill();

}
As you can see, the drawTree function contains all the code we previously created to draw the canopy, trunk, and trunk gradient. Now we will use one of the transformation routines—context.scale—to draw a second tree at a new location and with a larger size, as shown in Listing 2-20.
Listing 2-20. Drawing the Tree Objects
// Draw the first tree at X=130, Y=250

context.save();

context.translate(130, 250);

drawTree(context);

context.restore();


// Draw the second tree at X=260, Y=500

context.save();

context.translate(260, 500);


// Scale this tree twice normal in both dimensions

context.scale(2, 2);

drawTree(context);

context.restore();
The scale function takes two factors for the x and y dimensions as its arguments. Each factor tells the canvas implementation how much larger (or smaller) to make the size in that dimension; an X factor of 2 would make all subsequent draw routines twice as wide, while a Y factor of 0.5 would make all subsequent operations half as tall as before. Using these routines, we now have an easy way to create a second tree in our trails canvas, as shown in Figure 2-15.
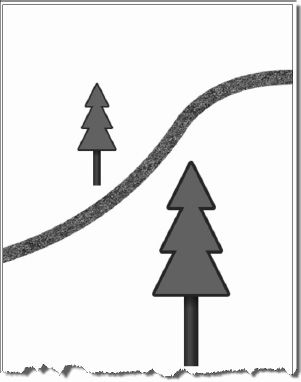
Figure 2-15. Tree with a larger scale
Always Perform Shape and Path Routines at the Origin
Using Canvas Transforms
Transform operations are not limited to scales and translates. It is also possible to rotate the drawing context using the context.rotate(angle) function or even to modify the underlying transform directly for more advanced operations such as shearing of the rendered paths. If you wanted to rotate the display of an image, you would merely need to call the series of operations shown in Listing 2-21.
context.save();


// rotation angle is specified in radians

context.rotate(1.57);

context.drawImage(myImage, 0, 0, 100, 100);


context.restore();
In Listing 2-22, however, we will show how you can apply an arbitrary transform to the path coordinates to radically alter the display of our existing tree path in order to create a shadow effect.
Listing 2-22. Using a Transform
// Create a 3 stop gradient horizontally across the trunk

// Save the current canvas state for later

context.save();


// Create a slanted tree as the shadow by applying

//  a shear transform, changing X values to increase

//  as Y values increase

// With this transform applied, all coordinates are

//  multiplied by the matrix.

context.transform(1, 0,-0.5, 1, 0, 0);


// Shrink the shadow down to 60% height in the Y dimension

context.scale(1, 0.6);


// Set the tree fill to be black, but at only 20% alpha

context.fillStyle = 'rgba(0, 0, 0, 0.2)';

context.fillRect(-5, -50, 10, 50);


// Redraw the tree with the shadow effects applied

createCanopyPath(context);

context.fill();


// Restore the canvas state

context.restore();
Modifying the context transform directly as we’ve done here is something you should attempt only if you are familiar with the matrix mathematics underpinning two-dimensional drawing systems. If you check the math behind this transform, you will see that we are shifting the X values of our drawing by a factor of the corresponding Y values in order to shear the gray tree being used as a shadow. Then, by applying a scale factor of 60%, the sheared tree is decreased in size.
Note that the sheared “shadow” tree is rendered first, so that the actual tree appears above it in Z-order (the order in which the canvas objects overlap). Also, the shadow tree is drawn using the CSS notation for RGBA, which allows us to set the alpha value to only 20% of normal. This creates the light, semitransparent look for the shadow tree. Once applied to our scaled trees, the output renders as shown in Figure 2-16.
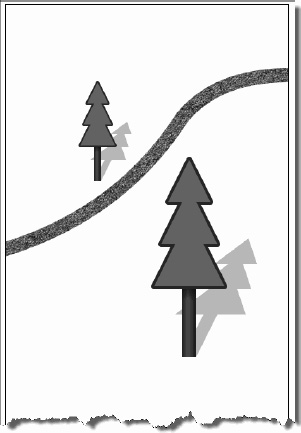
Figure 2-16. Trees with transformed shadows
Using Canvas Text
As we approach the end of our trail creation, let’s demonstrate the power of the Canvas API text functions by adding a fancy title to the top of our display. It is important to note that text rendering on a canvas is treated the same way as any other path object: text can be stroked or filled, and all rendering transformations and styles can apply to text just as they do to any other shape.
As you might expect, the text drawing routines consist of two functions on the context object:
fillText (text, x, y, maxwidth)strokeText (text, x, y, maxwidth)
Both functions take the text as well as the location at which it should be drawn. Optionally, a maxwidth argument can be provided to constrain the size of the text by automatically shrinking the font to fit the given size. In addition, a measureText function is available to return a metrics object containing the width of the given text should it be rendered using the current context settings.
As is the case with all browser text display, the actual appearance of the text is highly configurable using context properties that are similar to their CSS counterparts, as shown in Table 2-2.
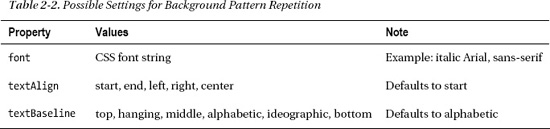
All these context properties can be set to alter the context or accessed to query the current values. In Listing 2-23, we will create a large text message with the font face Impact and fill it with the background pattern of our existing bark image. In order to center the text across the top of our canvas, we will declare a maximum width and a center alignment.
Listing 2-23. Using Canvas Text
// Draw title text on our canvas

context.save();


// The font will be 60 pixel, Impact face

context.font = "60px impact";


// Use a brown fill for our text

context.fillStyle = '#996600';

// Text can be aligned when displayed

context.textAlign = 'center';


// Draw the text in the middle of the canvas with a max

//  width set to center properly

context.fillText('Happy Trails!', 200, 60, 400);

context.restore();
As you can see from the result in Figure 2-17, the trail drawing just got a whole lot—you guessed it—happier.
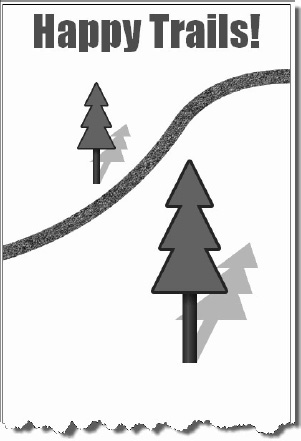
Figure 2-17. Background pattern-filled text
Applying Shadows
Finally, we will use the built-in canvas shadow API to add a blurred shadow effect to our new text display. Like many graphical effects, shadows are best applied in moderation, even though the Canvas API allows you to apply shadows to any operation we have already covered.
Once again, shadows are controlled by a few global context properties, as shown in Table 2-3.
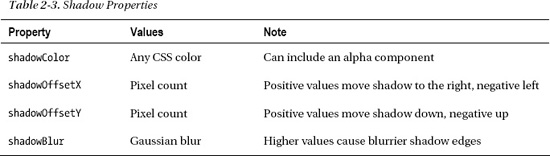
The shadow effect is triggered on any path, text, or image render if the shadowColor and at least one of the other properties is set to a nondefault value. Listing 2-24 shows how we can apply a shadow to our new trails title text.
Listing 2-24. Applying a Shadow
// Set some shadow on our text, black with 20% alpha

context.shadowColor = 'rgba(0, 0, 0, 0.2)';


// Move the shadow to the right 15 pixels, up 10

context.shadowOffsetX = 15;

context.shadowOffsetY = -10;


// Blur the shadow slightly

context.shadowBlur = 2;
With these simple additions, the canvas renderer will automatically apply shadows until the canvas state is restored or the shadow properties are reset. Figure 2-18 shows the newly applied shadows.
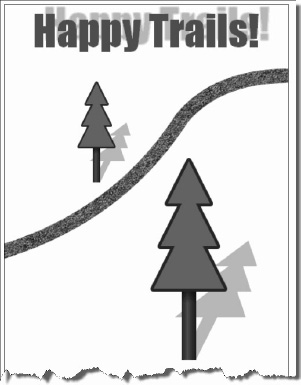
Figure 2-18. Title with shadowed text
As you can see, the shadow generated by CSS is positional only and not in sync with the transformational shadow we created for our tree. For the sake of consistency, you should probably only use one approach to drawing shadows in a given canvas scene.
Working with Pixel Data
One of the most useful—albeit nonobvious—aspects of the Canvas API is the ability for developers to easily get access to the underlying pixels in the canvas. This access works in both directions: it is trivial to get access to the pixel values as a numerical array, and it is equally easy to modify those values and apply them back to the canvas. In fact, it is entirely possible to manipulate the canvas entirely through the pixel value calls and forgo the rendering calls we’ve discussed in this chapter. This is made possible by the existence of three functions on the context API.
First up is context.getImageData(sx, sy, sw, sh). This function returns a representation of the current state of the canvas display as a collection of integers. Specifically, it returns an object containing three properties:
width: The number of pixels in each row of the pixel dataheight: The number of pixels in each column of the pixel datadata: A one-dimensional array containing the actual RGBA values for each pixel retrieved from the canvas. This array contains four values for each pixel—a red, green, blue, and alpha component—each with a value from 0 to 255. Therefore, each pixel retrieved from the canvas becomes four integer values in the data array. The data array is populated by pixels from left to right and top to bottom (for example, across the first row, then across the second row, and so on), as shown in Figure 2-19.
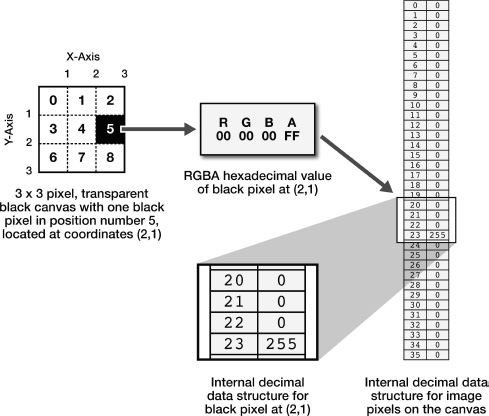
Figure 2-19. Pixel data and the internal data structure that represents it
The data returned by the call to getImageData is limited to the region defined by the four parameters. Only canvas pixels contained in the rectangular region surrounded by the source x, y, width, and height parameters will be retrieved. Therefore, to access all pixel values as data, you should pass in getImageData(0, 0, canvas.width, canvas.height).
Because there are four image data values representing each pixel, it can be a little tricky to calculate exactly which index represents the values for a given pixel. The formula is as follows.
For any pixel at coordinate (x,y) in a canvas with a given width and height, you can locate the component values:
- Red component: ((width * y) + x) * 4
- Green component: ((width * y) + x) * 4 + 1
- Blue component: ((width * y) + x) * 4 + 2
- Alpha component: ((width * y) + x) * 4 + 3
Once you have access to the object with image data, it is quite easy to modify the pixel values in the data array mathematically, because they are each simply integers from 0 to 255. Changing the red, green, blue, or alpha values for one or more pixels makes it easy to update the canvas display by using the second function: context.putImageData(imagedata, dx, dy).
putImageData allows you to pass in a set of image data in the same format as it was originally retrieved; that’s quite handy because you can modify the values the canvas originally gave you and put them back. Once this function is called, the canvas will immediately update to reflect the new values of the pixels you passed in as the image data. The dx and dy parameters allow you to specify an offset for where to start applying your data array into the existing canvas, should you choose to use one.
Finally, if you want to start from scratch with a set of blank canvas data, you can call context.createImageData(sw, sh) to create a new set of image data tied to the canvas object. This set of data can be programmatically changed as before, even though it does not represent the current state of the canvas when retrieved.
There is yet another way to get data out of a canvas: the canvas.toDataURL API. This function gives you a programmatic way to retrieve the current rendering data of a canvas in a text format, but in this case the format is a standard representation of the data that browsers can interpret as images.
A data URL is a string containing the data of an image—such as a PNG—that a browser can display just like a normal image file. The format of a data URL is best illustrated with an example:
data:image/png;base64, WCAYAAABkY9jZxn…
This example shows that the format is the string data: followed by a MIME type (such as image/png), followed by a flag indicating whether or not the data is encoded in base64 format, and then the text representing the data itself.
Don’t worry about the format, as you won’t be generating it yourself. The important point is that with a simple call, you can get the content of a canvas delivered to you in one of these special URLs. When you call canvas.toDataURL(type), you can pass in a type of image you would like the canvas data generated in, such as image/png (the default) or image/jpeg. The data URL returned to you can be used as the source of image elements in a page or CSS styles, as shown in Listing 2-25.
Listing 2-25. Creating an Image from a Canvas
var myCanvas = document.getElementById("myCanvas");


// draw operations into the canvas...
// get the canvas data as a data URL

var canvasData = myCanvas.toDataURL();


// set the data as the source of a new image

var img = new Image();

img.src = canvasData;
You don’t have to use a data URL right away. You could even store the URL in your browser’s local storage for later retrieval and manipulation. Browser storage will be covered later in this book.
Implementing Canvas Security
There is an important caveat to using pixel manipulation, as described in the previous section. Although most developers would use pixel manipulation for legitimate means, it is quite possible that the ability to fetch and update data from a canvas could be used for nefarious purposes. For this reason, the concept of an origin-clean canvas was specified, so that canvases that are tainted with images from origins other than the source of the containing page cannot have their data retrieved.
As shown in Figure 2-20, if a page served up from http://www.example.com contains a canvas element, it is entirely possible that the code in the page could try to render an image from http://www.remote.com inside the canvas. After all, it is perfectly acceptable to render images from remote sites inside any given web page.
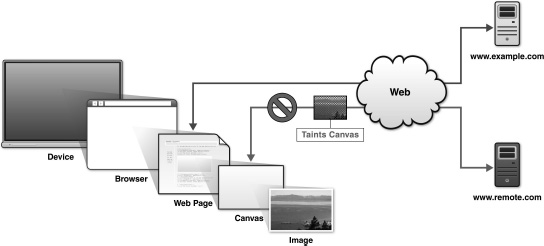
Figure 2-20. Local and remote image sources
However, before the arrival of the Canvas API, it was not possible to programmatically retrieve the pixel values of a downloaded image. Private images from other sites could be displayed in a page but not read or copied. Allowing scripts to read image data from other origins would effectively share users' photographs and other sensitive online image file with the entire web.
In order to prevent this, any canvas that contains images rendered from remote origins will throw a security exception if the getImageData or toDataURL functions are called. It is perfectly acceptable to render remote images into a canvas from another origin as long as you (or any other scriptwriter) do not attempt to fetch the data from that canvas after it has been tainted. Be aware of this limitation and practice safe rendering.
Building an Application with HTML5 Canvas
There are many different application possibilities for using the Canvas API: graphs, charts, image editing, and so on. However, one of the most intriguing uses for the canvas is to modify or overlay existing content. One popular type of overlay is known as a heatmap. Although the name implies a temperature measurement, the heat in this case can refer to any level of measurable activity. Areas on the map with high levels of activity are colored as hot (for example, red, yellow, or white). Areas with less activity show no color change at all, or minimal blacks and grays.
For example, a heatmap can be used to indicate traffic on a city map, or storm activity on a global map. And situations such as these are easy to implement in HTML5 by combining a canvas display with an underlying map source. Essentially, the canvas can be used to overlay the map and draw the heat levels based on the appropriate activity data.
Let’s build a simple heatmap using the capabilities we learned about in the Canvas API. In this case, our heat data source will be not external data, but the movement of our mouse across the map. Moving the mouse over a portion of the map will cause the heat to increase, and holding the mouse at a given position will rapidly increase the temperature to maximum levels. We can overlay such a heatmap display(shown in Figure 2-21) on a nondescript terrain map, just to provide a sample case.
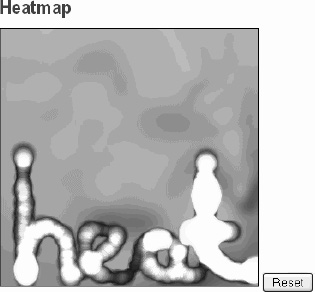
Figure 2-21. The heatmap application
Now that you’ve seen the end result of our heatmap application, let’s step through the code sample. As usual, the working examples are available online for your download and perusal.
Let’s start with the HTML elements declared in this example. For this display, the HTML consists of only a title, a canvas, and a button we can use to reset the heatmap. The background display for the canvas consists of a simple mapbg.jpg applied to the canvas via CSS as shown in Listing 2-26.
Listing 2-26. The Heatmap Canvas Element
<style type="text/css">

  #heatmap {

      background-image: url("mapbg.jpg");

  }
</style>


<h2>Heatmap </h2>

<canvas id="heatmap" class="clear" style="border: 1px solid ; " height="300"

 width="300"> </canvas>

<button id="resetButton">Reset</button>
We also declare some initial variables to be used later in the example.
  var points = {};

  var SCALE = 3;

  var x = -1;

  var y = -1;
Next, we will set the canvas to have a high transparency value for its global drawing operations, and set the composite mode to cause new draws to lighten the underlying pixels rather than replace them.
Then, as shown in Listing 2-27, we will set a handler to change the display—addToPoint—every time the mouse moves or one-tenth of a second passes.
Listing 2-27. The loadDemo Function
function loadDemo() {

  document.getElementById("resetButton").onclick = reset;


  canvas = document.getElementById("heatmap");

  context = canvas.getContext('2d'),

  context.globalAlpha = 0.2;

  context.globalCompositeOperation = "lighter"


function sample() {

  if (x != -1) {

    addToPoint(x,y)

  }

  setTimeout(sample, 100);

}


canvas.onmousemove = function(e) {

  x = e.clientX - e.target.offsetLeft;

  y = e.clientY - e.target.offsetTop;

  addToPoint(x,y)

}


  sample();

}
If the user clicks Reset, the entire canvas area is cleared and reset to its original state by using the canvas’ clearRect function, as shown in Listing 2-28.
Listing 2-28. The reset Function
function reset() {

  points = {};

  context.clearRect(0,0,300,300);
  x = -1;

  y = -1;

}
Next we create a lookup table of colors to use when drawing heat on the canvas. Listing 2-29 shows how the colors range in brightness from least to greatest, and they will be used to represent varying levels of heat on the display. The greater the value of the intensity, the brighter the returned color.
Listing 2-29. The getColor Function
function getColor(intensity) {

  var colors = ["#072933", "#2E4045", "#8C593B", "#B2814E", "#FAC268", "#FAD237"];

  return colors[Math.floor(intensity/2)];

}
Whenever the mouse moves or hovers over an area of the canvas, a point is drawn. The point grows in size (and brightness) the longer the mouse stays in the immediate area. As shown in Listing 2-30, we use the context.arc function to draw a circle of a given radius, and we draw a brighter, hotter color for larger radius values by passing the radius to our getColor function.
Listing 2-30. The drawPoint Function
function drawPoint(x, y, radius) {

  context.fillStyle = getColor(radius);

  radius = Math.sqrt(radius)*6;


  context.beginPath();

  context.arc(x, y, radius, 0, Math.PI*2, true)


  context.closePath();

  context.fill();

}
In the addToPoint function—which you will recall is accessed every time the mouse moves or hovers over a point—a heat value is increased and stored for that particular point on the canvas. Listing 2-31 shows that the maximum point value is 10. Once the current value of heat for a given pixel is found, the appropriate pixel is passed to drawPoint with its corresponding heat/radius value.
Listing 2-31. The addToPoint Function
function addToPoint(x, y) {

  x = Math.floor(x/SCALE);

  y = Math.floor(y/SCALE);


  if (!points[[x,y]]) {

    points[[x,y]] = 1;

  } else if (points[[x,y]]==10) {

    return

  } else {

    points[[x,y]]++;

  }

  drawPoint(x*SCALE,y*SCALE, points[[x,y]]);

}
Finally, the initial loadDemo function is registered to be called whenever the window completes loading.
window.addEventListener("load", loadDemo, true);
Together, these one hundred or so lines of code illustrate how much you can do with the Canvas API in a short amount of time, without using any plug-ins or external rendering technology. With an infinite number of data sources available it is easy to see how they can be visualized simply and effectively.
Practical Extra: Full Page Glass Pane
In the example application, you saw how you can apply a canvas on top of a graphic. You can also apply a canvas on top of the entire browser window or portions of the same—a technique commonly referred to as glass pane. Once you have positioned the glass pane canvas on top of a web page, you can do all kinds of cool and handy things with it.
For example, you can use a routine to retrieve the absolute position of all the DOM elements on a page and create a step-by-step help function that can guide users of a web application through the steps they must perform to start and use the application.
Or, you can use the glass pane canvas to scribble feedback on someone’s web page using the mouse events for drawing input. Some things to keep in mind if you try to use a canvas in this capacity:
- You will need to set the canvas positioning to
absoluteand give it a specific position, width, and height. Without an explicit width and height setting, the canvas will remain at a zero pixel size. - Don’t forget to set a high Z-index on the canvas so that it floats above all the visible content. A canvas rendered under all the existing content doesn’t get much chance to shine.
- Your glass pane canvas can block access to events in the content below, so be sparing in how you use it and remove it when it is unnecessary.
Practical Extra: Timing Your Canvas Animation
Earlier in the chapter, we mentioned that it is a common practice to animate elements on a canvas. This could be used for gaming, transitional effects, or simply to replace animated GIFs in an existing web page. But one area where JavaScript has been lacking is a reliable way to schedule your animation updates.
Today, most developers use the classic setTimeout or setInterval calls to schedule changes to a web page or application. Both of these calls allow you to schedule a callback after a certain number of milliseconds, which then allows you to make changes to the page during the callback. However, there are some significant problems with using that approach:
- As a developer, you need to guess at the appropriate number of milliseconds in the future to schedule the next update. With the modern Web running on a wider variety of devices than ever, it is tricky to know the suggested frame rate for a high-powered desktop device versus a mobile phone. And even if you guess how many frames to schedule per second, you may end up competing with other pages or machine load.
- It is more common than ever for users to browse with multiple windows or tabs, even on mobile devices. If you use
setTimeoutandsetIntervalto schedule your page updates, these will continue to happen even when the page is in the background. Running your scripts when they aren’t even visible is a great way to convince users that your web application is draining their phone battery!
As an alternative, many browsers now offer a requestAnimationFrame function on the window object. This function takes a callback as its argument, and the callback will be invoked whenever the browser deems it appropriate for the animation to be updated.
Let’s add another example (Listing 2-32) of our trail scene, this one with a crudely animated rain storm to signify the cancellation of our upcoming race. This code builds on the previous examples, and redundant code is not listed here.
Listing 2-32. Basic Animation Frame Request
// create an image for our rain texture

var rain = new Image();

rain.src = "rain.png";

rain.onload = function () {

  // Start off the animation with a single frame request

  // once the rain is loaded

  window.requestAnimFrame(loopAnimation, canvas);

}


// Previous code omitted…


// this function allows us to cover all browsers

// by aliasing the different browser-specific

// versions of the function to a single function

window.requestAnimFrame = (function(){

  return  window.requestAnimationFrame       ||

          window.webkitRequestAnimationFrame ||

          window.mozRequestAnimationFrame    ||

          window.oRequestAnimationFrame      ||

          window.msRequestAnimationFrame     ||

          // fall back to the old setTimeout technique if nothing

          // else is available

          function(/* function */ callback, /* DOMElement */ element){

            window.setTimeout(callback, 1000 / 60);

          };

})();


// This function is where we update the content of our canvas

function drawAFrame() {

  var context = canvas.getContext('2d'),


  // do some drawing on the canvas, using the elapsedTime

  // as a guide for changes.

  context.save();


  // draw the existing trails picture first

  drawTrails();
  // Darken the canvas for an eerie sky.

  // By only darkening most of the time, we create lightning flashes

  if (Math.random() > .01) {

    context.globalAlpha = 0.65;

    context.fillStyle = '#000000';

    context.fillRect(0, 0, 400, 600);

    context.globalAlpha = 1.0;

  }


  // then draw a rain image, adjusted by the current time

  var now = Date.now();

  context.fillStyle = context.createPattern(rain, 'repeat'),


  // We'll draw two translated rain images at different rates to

  // show thick rain and snow

  // Our rectangle will be bigger than the display size, and

  // repositioned based on the time

  context.save();

  context.translate(-256 + (0.1 * now) % 256, -256 + (0.5 * now) % 256);

  context.fillRect(0, 0, 400 + 256, 600 + 256);

  context.restore();


  // The second rectangle translates at a different rate for

  // thicker rain appearance

  context.save();

  context.translate(-256 + (0.08 * now) % 256, -256 + (0.2 * now) % 256);

  context.fillRect(0, 0, 400 + 256, 600 + 256);

  context.restore();


  // draw some explanatory text

  context.font = '32px san-serif';

  context.textAlign = 'center';

  context.fillStyle = '#990000';

  context.fillText('Event canceled due to weather!', 200, 550, 400);

  context.restore();

}


// This function will be called whenever the browser is ready

// for our application to render another frame.

function loopAnimation(currentTime) {

  // Draw a single frame of animation on our canvas

  drawAFrame();


  // After this frame is drawn, let the browser schedule

  // the next one

  window.requestAnimFrame(loopAnimation, canvas);

}
Once we update our drawing, we can see the animating rain on top of our trail (see Figure 2-22).
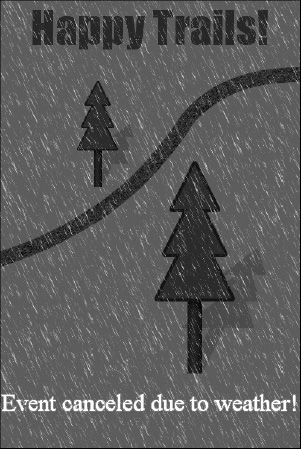
Figure 2-22. Still shot of canvas with rain animation
It is up to the browser to decide how often to call the animation frame callback. Pages in the background will be called less frequently, and the browser may clip the rendering to the element provided to the requestAnimationFrame call (“canvas” in our example) to optimize drawing resources. You aren’t guaranteed a frame rate, but you are spared the work of scheduling for different environments!
This technique is not limited to the Canvas API. You can use requestAnimationFrame to make changes anywhere on the page content or CSS. There are other ways to produce movement on a web page—CSS animations come to mind—but if you are working with script-based changes, the requestAnimationFrame function is the way to go.
Summary
As you can see, the Canvas API provides a very powerful way to modify the appearance of your web application without resorting to odd document hacks. Images, gradients, and complex paths can be combined to create nearly any type of display you may be looking to present. Keep in mind that you generally need to draw at the origin, load any images you want to display before attempting to draw them, and be mindful of tainting your canvas with foreign image sources. However, if you learn to harness the power of the canvas, you can create applications that were never possible in a web page before.