
“There are two possible outcomes: if the result confirms the hypothesis, then you've made a measurement. If the result is contrary to the hypothesis, then you've made a discovery.”—Enrico Fermi
In the information age we’re currently occupying, data is king. Machine learning-enabled startups and products are being touted as the silver bullet to combat tough problems, and companies are investing heavily in data analysts and scientists. The hype around learning from patterns in data is at an all-time high, and organizations want to cash in on the gold rush as soon as possible.
Putting aside the mania surrounding big data, the longstanding principle of “if you can’t measure it, you can’t improve it” still applies to every software product that is user-facing. User actions, behaviors, and patterns of thinking can be captured using a variety of techniques, and the data can tell us things about the product at scale that aren’t immediately obvious when testing with a limited user set.
In addition, the data we choose to collect and analyze gives us a set of targets to shoot for. A mobile application may track one-time downloads as the key metric, whereas an enterprise application could focus on subscription retention or churn as a guiding data point.
A product manager routinely needs to communicate progress and product success to an audience of stakeholders, and a combination of carefully selected metrics and data points can be the best way to describe the current state of affairs. Data analytics serves to provide insights, rank the user’s flow of attention, and help PMs make better business decisions.
Analytics vs. Metrics
Before we start talking about the types of metrics to collect and the analytical tools to use, we need to define the two terms to solidify our understanding of the distinction.
- A metric is a unit of measurement that tracks one point of data.
- Analytics are the output of the process of transforming raw data (metrics) into actionable and strategic business insights. In other words, using the metrics you’ve collected to answer previously unanswered questions.
Analytics and metrics work hand-in-hand: first we come up with the right metrics to track, then zoom out and examine the relationships between the collected data.
Selecting metrics for measurement
There is no “one magic metric” that every PM needs to flag for collection. Collect too little data, and you run the risk of missing patterns that lie below the tip of the iceberg. Collect too much data, and you could lose time parsing through all the information (especially if the repository is sizeable in nature). At a high level, we can hypothesize the general questions we want to answer through our metrics:
- Do users like the product?
- What causes users to stop using the product?
- How do users find out about the product?
- What features do users love? Hate?
- Are users able to navigate through our product with ease?
- What drives revenue in our product?
- What can be improved?
Once this is set, huddle with the team and management to think through the success criteria. Is it to maximize revenue? Grow the user base exponentially? Sunset (remove) features that aren’t well performing or frequently used? Brainstorming will align goals, and you can form the metrics around the main product objectives. Metrics that guide key decision making are called
key performance indicators (KPIs). Companies will tie KPIs to financial, business, and other success criteria, and setting a mix of realistic and stretch goals for the KPI goals keeps the team focused and efficient.
Note
Metrics can be deceptive. For example, imagine a small gaming startup preparing to launch a mobile app. A product manager may want to use “number of total downloads” as the target metric to maximize, but this can be misleading. A million users can download the app, but if you don’t measure a complementary metric like weekly or monthly active users, you can miss out on stories the data is trying to tell. If a million users download but only 1,000 are consistently using the app every month, that can signal a major issue.
Types of metrics
Metrics
indicate success or failure in whatever you’re measuring, but without categorizing them properly, you could end up mixing one type of metric with another, leading to messy final insights and scrambled reports. To cover all of the bases when choosing trackable metrics, answer the following questions in the six categories as you put together a data analytics strategy: financial, business, product, process, people, and user. Use the categories and questions to frame the thinking when making the conscious decision on what to track versus what to ignore.
Financial Metrics
- How much money are we currently making?
- What are the revenue goals for the next year? Next 5-10 years?
- What are the biggest financial risks for our company? Industry?
- What is our annual growth rate?
Business Metrics
- What is our projected market share?
- How will we handle competitors?
- What partnerships can we strike with industry players?
- What acquisitions can we make?
Product Metrics
- What problem are we solving?
- Do people care about the product?
- Do they naturally recommend the product to their friends and colleagues?
- What features are unused?
- Does the product perform well?
Process Metrics
- Are we effectively following a framework or process for development?
- What are the primary concerns around our current processes?
- Do we document enough?
- Are we using the right software tools?
People Metrics
- Are people happy in the organization?
- Do employees feel satisfied by the work they’re doing?
- What’s the best way to reward high-performers and vice versa?
- How do we incentivize the team?
User Metrics
- Who is our target demographic?
- What will cause users to stop using our product?
- What will users pay for the product?
- How closely do we examine direct user feedback?
Metrics that matter
In the search to find the perfect mix of metrics to harvest, there are a baseline set of data points that need to be mentioned. Every product will not find the following list of metrics relevant, but in general, they’ll come up over and over again in product discussions throughout a PM’s career, and knowing the meaning behind the name and/or acronym is handy.
- Conversion rate
- The number or percentage of users that complete a desirable action or goal (e.g., clicking on a banner ad or subscribing to a monthly service).
- Bounce rate
- The percentage of users who leave the website or app after the first page or opening interaction.
- Churn rate
- The percentage of users who leave or stop using a product or service within a specific timeframe. Also referred to as the attrition rate.
- Growth rate
- The percentage increase of a unit of measure (users, revenue, etc.) over a period of time.
- Customer lifetime value (CLV)
- The amount of revenue expected from a single user through the lifetime of their engagement with the product or service.
- Monthly recurring revenue (MRR)
- Measurable and predictable revenue per month calculated by multiplying number of users with amount paid per month.
- Daily / Monthly active users (DAUs / MAUs)
- Number of unique users who actively engage with the product or service on a daily or monthly basis.
- Average revenue per user (ARPU)
- Total revenue divided by the number of total users.
- Customer acquisition cost (CAC)
- The cost of acquiring a customer (marketing and promotions) divided by the number of customers acquired during a period of time.
- Customer satisfaction (CSAT)
- A percentage or numerical representation of the user’s level of happiness or satisfaction with customer service interactions.
A/B Testing
A/B testing
(also known as split testing
) is an effective method to measure performance of two websites by comparing one version (A) to another (B). Often used to measure conversion and engagement, A/B testing is extremely helpful in finding out which variation of a particular page resonates most with the end user. To set up an A/B test, use a tool (Optimizely, Google Analytics
) to inject a snippet of Javascript code, then create two distinct webpage versions, and run the different pages on live users. If you notice an uptick in one experiment versus another, you can swap out the old page with the new and continue tweaking the elements on the page to maximize conversion.
In Figure 8-1, the first Apple.com webpage (A) uses the “Say hello to the future” header.
Figure 8-1.
Apple Website (Version A)
In Figure 8-2, the second webpage (B) uses “the future is crystal clear” as the header. In this A/B test, Apple can surface both pages to a statistically representative sample of users, and record the header that results in more iPhone X sales.
Figure 8-2.
Apple Website (Version B)
Multivariate testing
For products and companies with an established user base, A/B testing may only scratch the surface since only two variants of the webpage can be tested at one time. With multivariate testing, we can test as many possible permutations of the website as we want, granted we have the user base to split the pages amongst.
In multivariate testing
, the original page is split into smaller components. In the page shown in Figure 8-3, we can mark the top navigation bar, the title / header, and hero image all as disparate components to use for our multivariate experiment. Now, let’s say we want to test the following areas by:

- Changing the product ordering in the navigation bar (2 variants)
- Changing the iPhone X title / header (3 variants)
- Changing the hero image (2 variants)
Figure 8-3.
Apple Website (Multivariate Test)
With the components identified, we can tell that there are 12 possible combinations possible (2 X 3 X 2 = 12). From this point on, we can use industry tools to push out 12 versions of the page to end users and track conversion and other related metrics.
Analytics: Through the lens
To me, analytics have always been an unlock of stories that otherwise would be untold. Often, analytics provide the sole answer for issues that drive reduced efficiencies, non-optimal processes, or fractional revenue and margin potential for organizations. In today’s landscape, where companies are rigged with antiquated technologies and solutions, I continue to see analytics unveiling significant opportunities, with projects, programs, and investments all rallying around the narrative that they identify.In a similar vein, yet independent in value, metrics and KPIs create the ability to quantify achievement and impact in unparalleled ways. In their truest form, the beauty is that they can’t be gamed. You either hit them or you don’t; you reap the rewards or incur the penalty. Other communicated factors for success are softer; manipulated and massaged messages telling the story that you’d like or the one others would hope you to believe. While these messages are cloudy and limit transparency, well defined metrics can become your single points of truth and KPIs can help to raise your accountability both internally and externally.To consistently deliver value and authentic results, designs of metrics should always be distilled down to data which materially impacts the process at hand while striving to avoid unnecessary information. Metrics benchmark your success, and infer what improvements can be made in future sprints. In my opinion however, KPIs are more pronounced, and at their best signify strategic objectives and goals leading to your overall success. Given the growth of both small and large technology integrators it has become imperative for me to ensure that KPIs (often contractually), orient teams to a single mission. Unfortunately, there have been times this wasn’t the case, and we have felt the pain of spin and discord. However, when designed correctly, and supported by tactical metrics, the results have helped ensure successful delivery of many of our initiatives. In looking forward, my hope for the generation of technologists on the horizon is that they leverage the power and influence of analytics, metrics, and KPIs and use them to quantify their value and impact to their organizations.Grant Small, Nike Supply Chain Technology Consultant
Drilling Deep with Google Analytics
Google Analytics
is a robust analytics engine developed to help websites maximize advertising return on investment (ROI) and track detailed behavioral metrics. The tool itself is easy to use; just set up an account, copy a few lines of Javascript code to inject into your own product, and the results will autopopulate in the dashboard once user interaction begins.
In Figure 8-4, the Google Analytics demo instance is up and running, giving us a peek into the main dashboard view. A grouping of high-level metrics is shown (Users, Revenue, Conversion rate, Sessions) along with sections to go deeper in the left-hand navigation pane.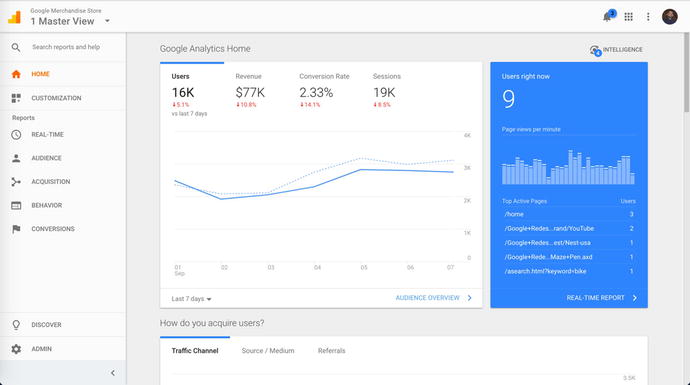
Figure 8-4.
The Google Analytics demo
Google Analytics splits the reports into four sections: Audience, Acquisition, Behavior, and Conversions. Since the tool collects so much information at once, the subsections are helpful when honing in on related slices of the analytical data set.
For a product manager, the behavior flow is a critical view to develop familiarity with (Figure 8-5). It tracks the number of users who touch the landing page, and shows a raw user count for each set of possible interactions that users could follow in the product. This report can identify areas with high rates of exit, and confirm if the product is intuitive enough to guide users from start to finish without hand-holding.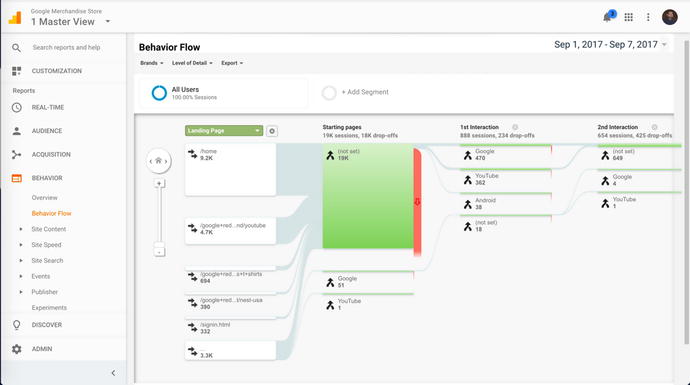
Figure 8-5.
The Behavior Flow view
Another helpful view to keep an eye on is the funnel visualization (Figure 8-6). The funnel begins with a top-level action or function (in this case, the shopping cart) and tracks a user’s journey through the flow to show how many end up past billing & shipping, payment, and finally to checkout. The funnel can expose bottlenecks in the system as users are closing in on the main goal, and elements that prevent them from a successful positive exit scenario.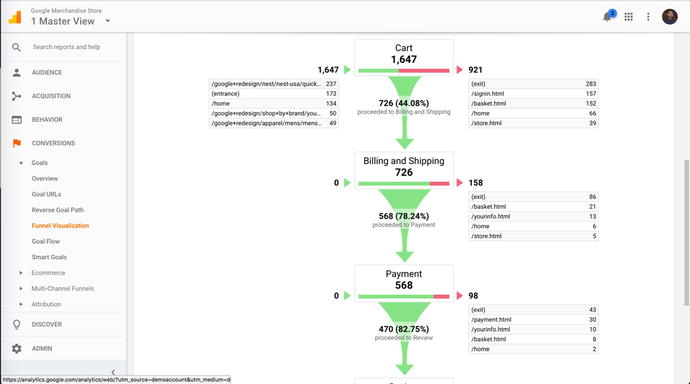
Figure 8-6.
The funnel visualization
Experiment with the Google Analytics dashboard and make a note of the sections of data that suit a particular product’s industry, type, technology stack, and use case. Then, create a set of reports that return only the set of numbers you need to make informed decisions. Everything else can be treated as random noise.
Google Analytics: Advantages
Here are the advantages of Google Analytics
:
- Powerful: loads of functions and reporting capabilities integrated into the platform.
- Easy setup: simply inserting a snippet of code gets the tool up and running.
- Free (for basic tier): no cost to low-traffic products and/or services.
- Cross-platform: records analytics on web, mobile, and other devices.
- Customizable: flexibility of the tool allows for the product manager to create product-specific reports and data captures.
- Documentation & training: the community for GA is vast, and tons of tutorials exist for learning the ins-and-outs of the platform.
- Common across the industry: almost all companies in advertising, ecommerce, and marketing use Google Analytics (or are aware of the tool). Knowing and understanding the platform is a transferrable skill no matter where your career takes you.
Google Analytics: Disadvantages
Here are the disadvantages:
- Information overload : the first few times you use the tool, you may be overwhelmed by all of the segmented reports. Focus first on only high-level metrics, then find ways to loop in other reports that were unapproachable at first.
- Steep learning curve: slicing and dicing the data to be relevant to your product can be a difficult task for first-timers.
- Tells you what, not who: the data will give you aggregate numbers and blind data, but it can’t tell you about the user specifically. Is the user who bought the product at 5:00 AM a night owl? Is the customer who purchased the ball gown also looking for a necklace from other websites? If your engineering team is sophisticated enough, building out your own tracking infrastructure can start to answer questions that Google Analytics can’t.
- Cost: stepping across the free tier to enterprise can increase the monthly bill by a significant amount ($4,000), so budget considerations will come into play.
Conclusion
Collect everything you can, then trim it down. The biggest mistake you can make is to assume you only need X amount of data points, then realize later down the road that X + Y is what you REALLY needed. Even if you have to find the needle in the haystack later on by storing so much data, it’s worth it compared to making up for lost time and starting the collection today as opposed to yesterday.
Collect, track, measure, and influence. You will be at a grave disadvantage if you don’t.