
Chapter 7. Performance Considerations with Android Profiling Tools
Proficient use of concurrency in Android leads to better performance in your application. This is why we make Kotlin concurrency in Android the primary focus of this book. However, if one is not careful, improper use of concurrency can lead to poor performance. Have no worry: this chapter looks at popular Android tooling used to most commonly check for potential bottlenecks in performance.
We finally make the transition between performance theory to something more tangible by accomplishing specific tasks. Does our application have any memory leaks at runtime? What parts of the application is most CPU intensive? Which Android actions drains the most battery?
Out in the wild, Android faces real-life challenges affecting performance and battery life. For example, not everyone has unlimited data in their mobile plans, or reliable connectivity. In a harsh reality where Android apps must compete with one-another for limited resources, performance should be a serious consideration for any Android application. Android development doesn’t stop at creating an application. Effective development also ensures a smooth and seamless user experience. Even if you have a deep understanding of Android development, you might encounter:
-
Decrease in performance.
-
Have slow startup/slow response to user interactions.
-
Drain battery use.
-
Consume resources wastefully and clog memory.
-
Create UI bugs that doesn’t force a crash or generate an exception but affects user experience.
This list of sudden, strange behaviors in an application is, by no means, exhaustive. Previous chapters presented you with the complexities of Android components interacting with multithreading. Even if you have a solid understanding of multithreading, it’s hard to say how an application will really work until we analyze performance with profiling tools. To answer these kinds of ambiguities, there are several useful tools viable for running profiling on various aspects of Android:

Figure 7-1. Android Studio Profiler
The following sections talks about the umbrella of profiling tools available in Android Studio’s Profiler as well as a popular open source memory-leak detection library called LeakCanary. We explore these tools by examining a real-life application. Remember the hiking application described in previous chapters? Surprise! It was inspired from TrekMe. TrekMe is an Android trail treking app, an open-source Android project to download interactive topographical hiking routes to use on the go. The following bulleted points are highlights about TrekMe:
-
It started as Java project but codebase is currently 80+% Kotlin.
-
Users can download topographics maps for offline use.
-
You get your live position even when there’s no network, while the app tries its best to save the device battery.
-
You can track hikes in great detail without draining device battery when you need it most.
-
TrekMe gives you your live position on a map and other useful information without needing an internet connection (save for creating the map).
Should you wish to explore the application yourself and even follow along with the chapter, it would be encouraged and recommended. You can retrieve the source code at https://github.com/peterLaurence/TrekMe. Once you have cloned the project, open it with Android Studio. Finally, run an instance of an emulator from the AVD Manager that you plan on running TrekMe on.
Performance considerations are powerful. A caveat, though: the more you find, the more you’ll want to dig. It’s not uncommon to discover performance lag in any application, but it must be approached with reason. It is up to the developer to decide the most relevant tooling for use, and which optimizations outweigh in benefits over the cost creating it. It helps to investigate performance in applications with a sense of objectivity. To give a real sense of the kinds of surprises one may encounter, let’s start looking at TrekMe with Android Profiler.
Android Profiler
Android Profiler analyzes an application’s session in order to give real-time feeds for CPU usage, Memory usage as well as Network and Energy profiling. Below Figure 7-2 shows Android Studio opened to the TrekMe source code, and a console of Android Profiler showing in the bottom half.

Figure 7-2. Android Profiler
As show in the highlighted red boxes, you can start the profiler two ways: with app instantiation or instantiate
later on in a running instance. If your application is not running, click the Profile app icon at the top shaped
like a dashboard. This action builds and compiles a new running instance of the application. Android Studio will
then open a new session giving you stream of your data in real time. If your application is already running, you
can also open Android Profiler by importing a previous run of your application via View > Tool Windows > Profile
in Android Studio. From there, you can load the runtime session with the + icon.
You can record and store data in each session. Data such as method traces and heap dumps can be saved as a separate entry to the current session. Method traces show a stacktrace of methods and functions which can be recorded in CPU profiling. A heap dumps refers to the data collected from garage collection that occurs on the Android device, allowing us to analyze what objects are taking up unnecessary space in memory:

Figure 7-3. Save heap dumps or different kinds of CPU traces
Sessions record one app process at a time. However, you can save multiple recordings and switch in between to compare the data. Android Profiler stores each recording session, where the green dot indicates an active session running and profiling. In this example, there are three recorded sessions. The last recorded session has a saved Heap Dump session, which refers to a log of objects covered more in detail later on in “Memory Profiler”. The first recorded session saved different kinds of CPU recordings to be discussed in “CPU Profiler”.
Note
Android Studio caches sessions only for the lifetime of the Android Studio instance. If Android Studio is restarted, the sessions recorded will not be saved.
Why is it important to record the data we capture in profiling? To answer that question, we’ll be exploring different questions about the TrekMe application to which profiling can help us answer. The following sections goes into detail on how Android Studio profiles a device’s resources in the virtual machine at runtime for your application: Networking Profiler, CPU Profiler, Energy Profiler, and Memory Profiler. All of these items records streams of data during an application’s runtime, which can be accessed in greater detail in its own special views. Networking and CPU profiling tends to be the most easily analyzed, but one would be remiss to not learn how to benefit from memory & energy analysis.
In TrekMe, we create a map via IGN Spain. IGN Spain, abbreviated for Instituto Geográfico Nacional, or National Geographic Institute, is a government agency whose responsibility is to update cartography, keep track of astronomy, and track seismic volcanic activity among other things. Of course, we’re only really interested in the DEX files intended to relay data for topographical geological mapping.

Figure 7-4. TrekMe is open-source and may be on Github.com
For the remainder of this chapter, we’re going to monitor the map creation feature of TrekMe. There’s a built-in map creation feature where you can select an area from an official map generator like the Instituto Geografico Nacional (IGN) or U.S. Geological Survey (USGS) or some other map provider.
Network Profiler
IO is necessary in any Android application requiring data to be fetched from the network. For network calls, after the radio in an Android device powers up, it stays powered up for a while after the last use. The radio then stays on for a short period of time to make sure there are no additional requests to listen for. On some phones, using the network every 2 minutes will keep it at full power forever. Too many network calls can be expensive for Android resources, so analyzing and optimizing network use in an application is important.
Network Profiler provides a network breakdown for connections using either HttpURLConnection or OkHttp libraries.
Android Studio is able to generate interactive visual data capturing multidimensional analytics recording a
session while interacting with the application.
On map rendering, it seems to take a pretty long time to load the visual topographical data by the square. But it’s hard to say for sure what could be causing long loading times between the network calls and the drawing. Is TrekMe possibly making unnecessary, repetitive calls that might be slowing down performance on map creation? In Android Profiler, you can click the “Network” tab to expand on a series of spikes representing the network activity while creating a map with IGN with the emulator.

Figure 7-5. Network Profiling
The highlighted portion of the network timeline represents the time it took to render the topographical tiles one-by-one. It appears that a network call is made for every tile that loads. Are the calls in TrekMe taking an unusually long time to transfer data? To begin answering this question, we look closer into Connection View and Thread View.
Center pane: Connection View and Thread View
Connection View shows data sent/received in the highlighted portion of the timeline. Perhaps what is most notable is the ability to sort resource files by size, status time, and more. In the Timeline section in Figure 7-6, you may have noticed the colorful blocks split into two colors: orange and blue. The orange portion represents the time it takes to complete an HTTP request while the blue portion represents the time of the response coming back.

Figure 7-6. Connection View
The total amount of time that passes for rendering amounts to roughly 23 seconds, and the majority of the time within the request/response leans heavily for response time. In terms of data format, loading JPEG files is perhaps the best choice for the purpose of this application. We wish to use a good quality image for the user to zoom in to the tiles while keeping consistent quality. Using a JPEG also takes up less memory than a PNG file would. So the file format makes sense, but it would be worth opening the Thread View to see how this work is offloaded by threading.
We now show Thread View like in Figure 7-7 for the same network request made in the previous image. While Connection View looks close to the timeline in Thread View, they’re not quite the same. Thread View shows network activity for every CPU thread involved in the highlighted network requests.

Figure 7-7. Thread View
Seeing how worker threads divides labor real-time can help to reveal areas for improvement. Given the amount of data a single map works with, well, the rendering you see in the image above is by the design. The pooled-threads are responsible for dividing the work to download all these images.
So far, with the information we’ve looked at, the network activity appears to be reasonable. However, we can get more tangible and definite information when selecting on any call detected in Network Profiler. From either Connection View or Thread View, you can select any item for more granular detail in a separate pane. In the next section, we’ll be able to look into the specifics of each call and where we can look in our code for these network calls being made.
Right pane: Overview | Response | Request | Callstack
In software engineering and as an Android developer, it is common to work with other platforms for feature parity and more. Suppose a network call starts returning the wrong kind of information for a network request. The API team is in need of specifics for the network request and response you’re getting client side. How can you send them over the necessary request parameters and content headers they need to investigate on their side?
Network profiler gives us the ability to inspect network responses and requests on the right-side panel in a connection or thread view:

Figure 7-8. Network Profiler allows you to inspect HTTP response and request information
The Overview tab details notable highlights captured in HTTP request and response:
-
Request: the path and potential query parameters.
-
Status: the HTTP status code returned within the resulting response.
-
Method: the type of method used in the HTTP rest.
-
Content Type: the media type of the resource.
-
Size: the size of the resource returned in the resulting response.
-
“Is the format of the data I’m transferring most appropriate to work with?”
Request or Response tabs shows a break down of headers, parameters, body data, etc. This app uses a basic HTTP API. Other types of API data formats return HTML, JSON, and other types of resources. When applicable, the Request and Response tabs offers body data as formatted or raw representation. In our case, the resource media returns JPEGs.

Figure 7-9. Network Profiler captures network calls to render map from USGS.
Finally, the Callback tab that shows the stack trace for the relevant calls made to execute a network connection:

The calls that are not faded out represent the calls within the callstack coming from your own code. You can right-click the calls indicated to be able to jump to the source code with ease.
Using the Network Profiler proves useful for more than just analytics. As you can see for yourself, you’re able to process a lot of information quickly. From catching repetitive calls to confirming API contracts between client and server, the Network Profiler is one well worth keeping in your toolbelt.
Could TrekMe’s networking calls be the reason for the slower map rendering time? The task of creating a brand new topographical map is heavy in itself, but the network calls seem relatively straightforward. It appears the duration of network calls take longer for response times. There could be several reasons for this: for example, the server connection might be weaker if one attempts to pull this data from many countries away. Perhaps there are inefficiencies with the query call in the backend. However, it would be remiss in our exploration to chalk up slow loading times to network call response time without actually checking how long methods are running for. The CPU Profiler is able to provide insight for this. In the next section, we continue to examine IGN Spain map rendering and its consumption in processing using the CPU Profiler.
CPU Profiler
While Network Profiling is able to give us network headers, arguments, cookies, and data sent and retrieved from network calls, it is not able to paint the full picture about where the time goes. We have the callstack, but we don’t know how long certain methods actually run for.
This is where CPU Profiling comes in. Android Studio’s CPU Profiling measures processing use by the time it takes to run processing instructions provided by your source code. CPU Profiler helps identify greedy consumption of resources by analyzing timelapse on function execution and on what thread it executes on. Why does this matter? When too much processing is consumed from an application, it can lead to slowing down an application, which may well impact user experience. More importantly, perhaps, is that every calculation made by the CPU is, exactly, electrons coming out of the battery. The more CPU that is used, the more battery drainage there is.
If the application is debuggable, the CPU profiler allows you to examine CPU recordings and live-stream data by examining the call stack by the thread. Because we seem to have a lot of time spent on background threads, it will make sense to look into those.

Figure 7-10. CPU Profiler
The Figure 7-10 above shows a screenshot of a recorded CPU method tracing instance. The top right corner shows the CPU timeline, where the highlighted range of time showcases what threads were running in that time period in the pane below that. Click on any thread within CPU Profiler exposes the actual times in the analysis panel. Because of these panels are interactive, we break down each of these components that make up the CPU Profiler in the upcoming subsections.
CPU timeline
The graph in Figure 7-11 shows spikes of CPU usage, where the number is percent of available CPU. If you have made a trace recording, you should be able to highlight the CPU timeline to see more information.

Figure 7-11. CPU Timeline
Android Studio allows you to drag-and-click over a recorded sample from the CPU timeline to show the Call Chart.
Clicking on Record brings you to a separate trace CPU recording screen (covered in greater
detail in Record Traces). To create more granular call charts we look into in the next section, it helps to
highlight smaller portions of the recorded CPU trace.
Thread activity timeline and call chart
The Thread activity timeline accompanies the CPU timeline showing every running thread in the application. Granted that a section had been trace recorded, you should be able to select a thread to view the call stack captured within the selected time range.
Within Figure 7-12 20 threads are created and used within the application. These threads have been created either by your code, the Android OS, or a 3rd party library.

Figure 7-12. Thread activity timeline
The green blocks represents a running or active thread. There’s not a lot of greenery to see for the Main thread, but remember, this image captures a CPU trace of the network request downloading the map images. In this case, we expect background threads do the necessary work to download the network data. It seems we have the main thread waiting on one of the DefaultDispatcher threads for half the time. Double-clicking on an individual thread expands the callstack.
Below the thread activity timeline is a color-coded graph known as a Call Chart, pictured in Figure 7-13. The Call Chart shows a segmented range of time for CPU usage. The top most boxes represent the encapsulating parent method while the methods underneath represent child methods called within the parent method. The parent method waits on children methods to finish executing, so this is a good place to examine if any methods in the application code could be executing for a long time.

Figure 7-13. The Call Chart shows a Top-Down representation of captured methods
Android OS methods are color-coded orange, methods you’ve written in your application are green, and 3rd party
library APIs are blue. Within this coroutine, the longest amount of execution time is with
TileStreamProviderHttp.getTileStream(...). This is expected, given that this call makes individual network
requests per tile.
As you’re starting to get the picture of what kind of information CPU Profiler tries to capture, we’ll turn to Method Tracing with the CPU Profiler and record a segment of TrekMe creating a new map.
Method tracing
CPU Profiler allows you to record a trace to analyze and render status, duration, and type, and more. Tracing relates to recording device activity over a short period of time. Method tracing doesn’t occur until the recording button is clicked twice: once to start recording, and another time to end the recording. Depending on the coding configuration pictured below in Figure 7-14, a Sample or Trace configuration may be to determine what the recording captures.

Figure 7-14. Configurations are available for Android Developers for samples and traces.
Sample Java Methods captures the application call stack, or a Call Chart (also seen in previous sections). The Call Chart renders under the Thread activity timeline, which shows which threads are active at a particular time. These traces store individual sessions to the right pane for comparison with others saved sessions.

Figure 7-15. Sample Java Methods
Figure 7-15 shows a screenshot hovering over on of the methods running in the main thread. By choosing
the Sample Java Methods configuration, you can examine TrekMe’s callstack by hovering the mouse pointer over
particular methods.
Warning
Don’t let your recording run too long. Once a recording reaches its size limit, the trace stops collecting data even if the current session continues to record.
Unlike Sample Java Methods, Trace Java Methods strings together a series of timestamps recorded for the start and end of a method call. Should you wish, you can monitor Sample C/C+ Functions to gain insight on how the app is interacting with the Android OS. Recording sample traces for native threads are available for Android API 26 and up.
Finally, there is Trace System Calls in the configurations shown in Figure 7-14. System Trace is a powerful CPU recording configuration made available for Android developers. It gives back graphical information on frame-rendering data.
A closer look for the previous image shows how the Android system’s draw function takes up a good portion of time in
the main thread. In Figure 7-16 below, we zoom in to show how performDraw() takes signficantly
longer than the network calls previously highlighted in Figure 7-15.

Figure 7-16. Main thread shows more time dedicated to perform draw.
A System Trace records analytics on CPU Cores to see how scheduling occurs across the board. System Tracing becomes more meaningful for detecting CPU bottlenecks across the CPU Cores. These kinds of bottlenecks can jump out in places where the RenderThread chokes, especially for red-colored frames. Unlike other configurations, System Trace shows thread states and the CPU cor it currently runs on, as shown in Figure 7-17:

Figure 7-17. System Trace
One of the key features we show here is having access to RenderThread. RenderThread can be a great indicator to
show where bottlenecks might be occurring when attempting to render application UI. In the case above, we can see
that much of the idle time indeed seems to be running on idle around the actual drawing of the tiles themselves.
By modern standards, the Android system tries to redraw the screen depending on the refresh rate on the screen (between 8ms and 16ms). Even so, the same is still true that work packets taking longer than expected can cause dropped frames. In a CPU core, a red slot indicates a dropped frame where some task does not return quickly enough before the screen redraws itself. In the case of this TrekMe system trace recording, it appears we do have some dropped threads indicated in the Frames section below:
TrekMe saves each frame into a JPEG file and load the image into a Bitmap for decoding. However, Figure 7-17
above, we see that in the RenderThread, the length of DrawFrame doesn’t quite match up with the draw rate
intervals. A bit further below that, some of that idle time is tied to various long-running decodeBitmap methods
in the pooled threads.
From here, there are some options that could potentially be considered for faster drawing i.e. caching network responses for images, or even prefetching. Prefetching is a nice-to-have in the case a device has access to at least a 3G networking and a larger rate of MB. The problem with that is that it may not be the best option to render those bitmaps before we know what must be rendered. Another option could potentially encoding the data into a more compressed format for an easier time decoding. Whatever the decision, it’s up to the developer to evaluate the trade-offs and the effort of implementing certain optimizations.
Note
The use of terminology “method” and “function” tends to be used in everyday conversation interchangeably when talking about method tracing analysis. At this point, you might be wondering why Java methods and C/C++ functions differentiate enough to matter in CPU Profiling.
In the CPU recording configurations, the Android Profiler uses “method” to refers to Java-based code while “function” references threads. The difference between the two is the order of method execution preserved via a callstack while threads are created and scheduled by the Android OS itself.
Recording a Sample Method Trace
Now you are more familiar with what the recording configurations offers, we now turn to Sample Method Trace on TrekMe. CPU recordings are separated from the CPU profiler timeline. To begin, click the “Record” button at the top of the screen to analyze CPU activity while interacting with TrekMe.
Ending the recording renders a tabbed right pane of execution times for sample or trace calls. You can also highlight multiple threads at once for analysis. The average Android developer may not use all these tabs all the timeline. Still, it’s good to be cognisant of what tools are at your disposal given the right problem.
In TrekMe, there’s a predefined set iterable of tiles to download. A number of coroutines concurrently read the iterable and perform a network request per tile. Each coroutine decodes a Bitmap right after the network request succeeded. These coroutines are dispatched on a dispatched similar to Dispatchers.IO, and the rendering happens on UI thread. The UI thread is never blocked waiting for whatever Bitmap decoding, or network request.

Figure 7-18. CPU Profiler separates the recorded trace
The shrunken CPU timeline in Figure 7-18, at first glance, appears to be nothing more than a reference to the previous screen view. However, you can interact with this data to drill down further by highlighting a chunk of time via the range selector where the data below corresponds.

Figure 7-19. The range selector helps to manage sections of highlighted ranges.
In the image below, we look at one of the longer-running methods, getTileStream. Below the timeline, the left panel allows you to organize threads and interactions via drag-and-drop functionality.
Being able to group threads together also means you can highlight groups of stack traces. You can expand a thread in recorded
trace by double-clicking the thread twice to show a dropdown visual of a callstack:

Figure 7-20. You can search for a specific method via the search function.
Selecting an item also opens an additional pane to the right. The right side is the Analysis Panel, which allows you to examine stack trace and execution time in more granular detail. We cover this more in the subsequent section.
Analysis Panel
Analysis Panel holds a layered tab view. At the top of the pane highlights the active set of thread(s) showing. Beneath the tabbed menu sits a search bar above the stack trace. You can use a search bar to filter trace data related to a particular call. Below is set of tabs intended to render visual data from method-tracing in three views: Top Down, Bottom Up, and Flame Chart.
Top Down renders a graphical representation where method traces from the top to the bottom of the chart. Any
callee methods made within a particular method renders as a child underneath the original method. In
Figure 7-21, the method getTileStream used in TrekMe waits for a series of calls for internet connection and
reading from a data stream.
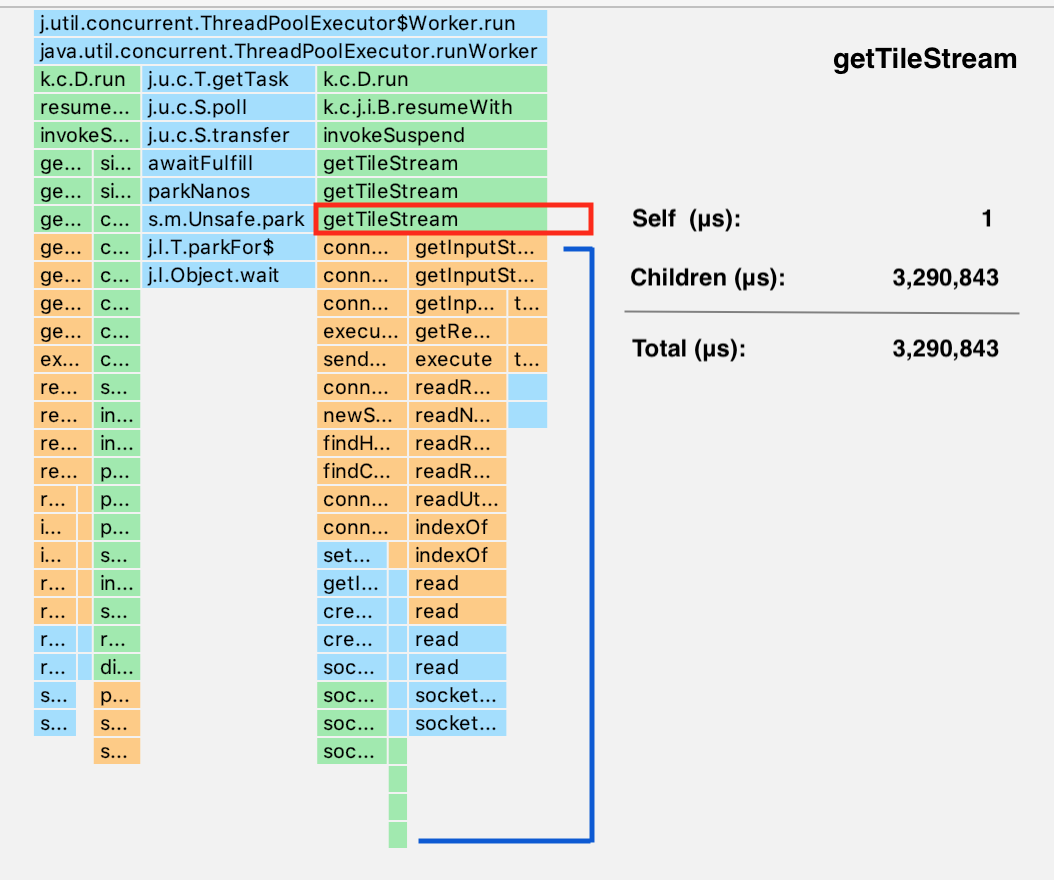
Figure 7-21. Top Down
The Top Down view shows how CPU time breaks down in three ways:
-
Self: the method execution time itself.
-
Children: the time it takes to execute callee methods.
-
Total: combined time of self and the children.
In the case of getTileStream, the majority of the time is spent on the network calls themselves: in particular, the
connection request and getInputStream to receive incoming data from the network. For the IGN Spain server, these times
can vary when accessed in another country and at different parts of the day. Being the client consuming server data,
TrekMe has no control for how the server performs.
Contrary to Top Down, Bottom Up shows an inverse representation of leaf elements of the call stack. In comparison, such a view renders a substantial number of methods, which can be useful to locate methods consuming the most CPU.

Figure 7-22. Bottom Up
The final tab provides a Flame Chart view. A Flame Chart provides an aggregated visual of operations from the bottom up. It provides an inverted call chart to better see which functions/methods are consuming more CPU time. The horizontal axis is relative time it takes to execute a function compared to others (as opposed to real time).
To summarize, CPU profiling can render three different kinds of views depending on the kind of deep dive you wish to pursue:
-
Top Down graphical representation shows each method call’s CPU time along with the time of its callees.
-
Bottom Up inverts the Top Down representation and is most useful to sort methods consuming the most or the least amount of time.
-
The Flame Chart inverts and aggregates the callstack horizontally with other callees of the same level to show which ones consumes the most CPU time first.
Tracking CPU usage is important, but perhaps you’d like to be able to analyze how an application interacts with Android hardware components. In the next section, we look into Android Studio’s Energy Profiler.
Excessive networking calls expensive can for an Android device in terms of processing and memory, but they are also power-hungry. The longer the device radio stays awake for network communication, the more CPU consumption and battery drainage there is. By this logic, it would be fair to assume that networking makes up the most of energy consumption. We can confirm this by using Energy Profiler.
Energy Profiler
The Energy Profiler is best used in determining heavy energy consumption. When an application makes a network request, the application turns on the mobile radio hardware component. CPU consumption accelerates as the mobile device communciates with the network, draining battery at a faster rate.
TrekMe pre-scales bitmaps to ensure consistent memory and energy usage when the user is zooming in and out. When the user is creating and downloading a map, the details of the map is, by default, downloaded with the highest resolution detail. The system event pane shows higher levels of consumption when downloading large chunks of data:

Figure 7-23. System event pane
A drag-and-click can also select a range of the timeline to show details for events for the Android OS system. In the image above, we can see a popup rendering of a breakdown of the energy graph. The first half of the legend popup contains the following categories - CPU, Network, and Location - which relays to each category provided in the stacked graph. It is a good sign to see that CPU and networking usage is light despite the heavy jobs making a network call to request large pieces of data to render a topographical map involves.
The second half of the popup legend describes the kinds of system events captured from the device. Energy Profiler works to capture certain kinds of system events and their energy consumption on a device:
-
Alarms and Jobs are systems event designed to wake up a device at a specified time. As best practice, Android now recommends using WorkManager or JobScheduler whenever possible, especially for background tasks.
-
Location requests uses Android GPS Sensor, which can consume a large amount of battery. As a good practice, it’s good to make sure accuracy and frequency gauged correctly for the use of the app.
Although we only see a location request, there are other types of system events which contain their own unique set of states. A request event may possess the states of Active as pictured above, Requested, or Request Removed. Likewise, if the Energy Profiler captures a Wake Lock type of system event, the timeline would be able to show state(s) for the duration of the wake lock event such as Acquired, Held, or Released and so on.
Selecting a particular system event opens a right pane in Energy Profiler to see more details. From here, you can jump directly
to the source code for that particular location request. GoogleLocationProvider seems to poll for user location
every second. This isn’t necessarily an issue - the intention of the polling is for the device is able to constantly update
your location. But it proves the power of this profiling tool: you can get precise information without looking at
the source code. The requests are made one at a time, making sure to remove an existing request in order
to make a new one when a new image block has been downloaded.
In comparison, we ought to expect relatively smaller energy-consumption when a user is zooming in on a rendered map. There
are no requests made for downloading large chunks of data. However, we expect some energy consumption for keeping
track of the user’s location, which also uses the GoogleLocationProvider:

Figure 7-24. TrekMe opens and zooms in an existing map.
In Figure 7-24 above, we can see the excessive and rapid touch events indicated by the pink dots above the stacked overlay graph. Because TrekMe has downloaded all the information it needed, no network calls are made at this time. However, we do notice how CPU usage spikes back up to high levels. To avoid overwhelming the system, it is good practice to implement the ability to limit touch events trying to spurn off a lot of zoom-drawing functions.
So far, we’ve covered evaluating performance by looking at the processing power. But examining battery/CPU usage does not always diagnose performance problems. In the next section, we examine the complimentary counterpart to performance considerations, Memory Profile by turning our attention to a different part of the application.
Memory Profiler
In TrekMe, you can navigate to GPX Record in the pullout drawer. GPX stands for GPS Exchange Format, and is a set of data used with XML schema for GPS formatting in software applications. Hikers can click the play icon under “Control”. The app then tracks and records the movements of the hikers and their device, which can be saved as a GPX file to be rendered as a line drawing later on to indicate the path traveled.

Figure 7-25. TrekMe’s Gpx Recording feature requires a GpxRecordingService to track the GPS coordinates of a user on a hike.
We know that using location in the system can be heavy for CPU processing. But sometimes, slowdowns can be attributed to memory problems. CPU processing uses RAM as its capacity for workspace, so when RAM fills up, the Android system must execute a heap dump. When memory usage is severely restricted, the ability to execute many tasks at once becomes limited. The more time it takes to execute less application operations, the slower Android gets. Remember, memory is shared for all application use, so if too many applications is taking too much memory, it can slow down the overall performance of device. The real fun in Memory Profiler lies in heap dumps. A heap dump is a snapshot of the objects existing in the Java heap during the time of recording.

Figure 7-26. The Memory Profiler timeline shows how memory is allocated
Per the usual, you will walk through a basic breakdown of the features you see before you before wielding Memory Profiler’s more powerful features.
-
Trigger garbage collection
-
Capturing a Java heap dump
-
Configurations for
SampledorFullmemory allocation tracking -
A timeline of the fragments and activities available in the Android application
-
User input events
-
Memory count to divide memory into categories
In Allocation tracking, a Full configuration captures all object allocations in memory while a Sampled configuration
records objects a regular intervals.
Even if you’re not using C++ in your app, you will see some native memory used here because the Android framework uses native memory to handle various tasks on your behalf, such as when handling image assets and other graphics—even though the code you’ve written is in Java or Kotlin. It is also important to realize that garbage collection can affect performance: for example, executing a ton of GC can slow the application down, depending on how frequent and how large generational object allocation GC works with.
Note
Like recording samples and traces in CPU Profiling, capturing a Java Heap Dumps saves the results within the session panel in Android Profiler for comparison for the life of your Android Studio instance.
At a minimum, Android Developers should try to run memory profiling any application to ensure that there are no memory leaks. Detecting memory-leaks can be somewhat life-saving, especially for the Android users depending on longer battery life. What you are about to see is a variation of a common mistake often made while working with Android services: leaving a service accidentally running.
TrekMe uses a foreground service to gain stats of the user’s hike, which is a natural choice for tracking the user’s location.
Services, like other Android components, run in the UI thread of the application. However, the functionality of a service provides comes with some cost as services tends to drain battery and system resources. Thus, it is important to limit the use of foreground services so as not to impair overall device performance and to kill them off as soon as possible when you must use them.
We can run a couple GPX recordings against the Memory Profiler to see what’s going on the device memory as shown in Figure 7-27:

Figure 7-27. You can use the CTRL + F function to search for “GpxRecordingService” to narrow results.
A heap dump shows you a list of classes, which can be organized by allocations in the heap, native size, shallow size, or retained size. Shallow size is a reference to the total Java memory used while Native size is a reference to the total memory used in native memory. Retained size is made of both shallow size and retained size (in bytes).
Within a recorded heap dump, you can organize your allocation record by app heap, image heap, or zygote heap.
To understand how processes tries to share RAM, it helps to reexamine what happens when an application starts from the perspective of Android memory. The Android system is Linux-based, where every application is a container representing a “user” in the system. When a user launches the TrekMe application, Android creates its own process container by forking an existing process called Zygote, and then run the image (defined by the code in our application) and runs that new process.
The zygote heap refers to the memory that is allocated for a Zygote process, which might include common framework code and resources. The image heap is also useless for our case, as these allocations come from the OS itself and contains references to classes used in an image containing our application for a system boot. We’re more concerned with the app heap, which is the primary heap the app allocates memory to.
A recorded heap dump is where the true power of the Memory Profiler lies. Recorded heap dumps can give you:
-
Every object instance of a selected object displayed in the Instance View pane with the option to “Jump to Source” in the code
-
Being able to examine instance data by right-clicking an object in References and selecting Go to Instance
Memory leaks can be a bit sneaky, as they can come in the form of an explicit or implicit reference to an Android Activity
or Context. They can also occur when caching ends up holding references to objects that are not needed. LocationService
appears to have separate allocations and happens to be the 4th largest object in the app heap.

Figure 7-28. A suspicious amount of LocationService appears to be help in memory.
Let’s just run a couple more recordings in TrekMe to confirm the behavior we suspect. We can right-click one by these instance to “Jump to source” to see. In RecordingViewModel.kt, we see the following code:
funstartRecording(){valintent=Intent(app,LocationServices::class.java)app.startService(intent)}
It appears that every time we press record, a new LocationService is instantiated. Is this necessarily wrong?
Perhaps not. It is possible to start-and-stop a service, and even if the service is dead, it is
possible for the instance to be held in the heap until GC occurs.
We want to check if these services are indeed stopping before starting a new one. A started service will
stay alive as long as possible, until a stopService call is made outside the service or stopSelf is called
within the service. This makes the use of persistent services expensive, as Android considers running services always
in use, meaning that the memory a service uses up in RAM will be never be made available.
When a GPX recording stops, LocationService propagates a series of events to save recorded to a data. When a GPX
file has just been written, the service stops to send a status. Because LocationService extends the Android Service,
we can call Service::stopSelf to stop the service.
@Subscribe(threadMode=ThreadMode.MAIN)funonGpxFileWriteEvent(event:GpxFileWriteEvent){mStarted=falsesendStatus()stopSelf()}
We’ve confirmed we do not leave any services leaking, which is great news. Actually, since the purpose of a
LocationService is to accomplish the long-running task of GPX recording, it seems fair to stop it once the user stops
the record - otherwise we would have an Android service occupying memory for nothing.
Unfortunately, in this case, the Activities/Fragments Leaks check may not be able to pick up the services causing the memory leaks, since these services are independent of any Activities or Fragments. However, there are other solutions out there, like LeakCanary, an open source library well-known for detecting memory leaks, which we cover in the next section.
Detecting Memory Leaks with LeakCanary
Hunting for memory leaks is… a manual process. Luckily, we have LeakCanary as shown in Figure 7-29, a popular memory leak detection library open-sourced by Square. It works automatically to detect leaks at runtime for you, which can be a perk over using the Android Studio memory profiler, which requires a more hands-on approach. When crash analytics is unable to detect crashes coming from an Out of Memory (OOM) exception, LeakCanary serves a viable alternative to keep an eye on issues detected at runtime.

Figure 7-29. LeakCanary logo
Some of the most common causes of memory leaks usually come from bugs related to the lifecycle of objects. LeakCanary is able to detect various mistakes such as:
-
Creating a new
Fragmentinstance without destroying the existing version first. -
Injecting an Android
ActivityorContextreference implicitly or explicitly into a non-Android component. -
Registering a listener, broadcast receiver, or RxJava subscription and not remembering to dispose of the listener/subscriber at the end of the parent lifecycle.
For this example, we have installed LeakCanary in TrekMe. LeakCanary is used organically in development until a dump heap with potential leaks has been retained. You can install LeakCanary by adding the following dependency to Gradle:
debugImplementation'com.squareup.leakcanary:leakcanary-android:2.*'
Once installed in your application, Leak Canary automatically detects leaks when an Activity or Fragment has been
destroyed, clearing the ViewModel, and more. It does this by detecting retained objects passed through some
ObjectWatcher. Figure 7-30 then dumps the heap, analyze the heap, and categorize those leaks for easy consumption.
After installing LeakCanary, you can use the application like normal. Should LeakCanary
detect retained instances in an heap dump that occurs, it sends a notification to the system tray.
You can use the application as your would normally in development, and LeakCanary can automatically generate reports
for leaks. In the case of TrekMe, it appears Figure 7-30 has detected a memory leak within a RecyclerView instance within
MapImportFragment:

Figure 7-30. LeakCanary
The error message is telling us that a RecyclerView instance is “leaking”. LeakCanary indicates that this view instance
holds a reference on a Context instance which wraps the activity. Something prevents the RecyclerView instance from
being garbage collected ; most probably, and implicit or explicit reference to the RecyclerView instance was passed to
a component that outlived the activity.
We’re not sure what we’re dealing with quite yet, so we start with looking at the MapImportFragment.kt class holding
the RecyclerView mentioned in the image above. Tracing back to the UI element recyclerViewMapImport referenced from
the layout file, we bring your attention to something curious:
classMapImportFragment:Fragment(){privatevalviewModel:MapImportViewModelbyviewModels()/* removed for brevity */overridefunonViewCreated(view:View,savedInstanceState:Bundle?){/* removed for brevity */recyclerViewMapImport.addOnItemTouchListener(RecyclerItemClickListener(this.context,recyclerViewMapImport,object:RecyclerItemClickListener.onItemClickListener{overridefunonItemClick(view:View,position:Int){binding.fab.activate()single.fab(position)}}))}/* removed for brevity */privatefunFloatingActionButton.activate(){/* removed for brevity */fab.setOnClickListener{itemSelected?.let{item->valinputStream=context.contentResolver.openInputStream(item.url)inputStream?.let{viewModel.unarchiveAsync(it,item)}}}}}
In the MapImportFragment, it appears that we attach a custom click listener to every ViewHolder. When a user clicks on
a particular item in the RecyclerView, the Kotlin extension function FloatingActionButton::activate is called. Remember,
a common cause for a memory leak can happen when we accidentally inject an Activity or a Context into a non-Android
UI component.
If you look closely at the FloatingActionButton::activate implementation, you can see that we create an implicit
reference to the enclosing class, which is the MapImportFragment instance.
How? We add click listener to a button. From inside this listener, we use the Context (returned by the getContext()
method of the fragment). To be able to access the Context from inside the listener, the Kotlin compiler creates an
implicit reference to the enclosing class.
The Context is used to get a ContentResolver and create an InputStream to feed as an argument for
MapImportViewModel::unarchiveAsync.
Following the code to the MapImportViewModel method, we see the InputStream passed down to be able to call another
private method in the ViewModel.
classMapImportViewModel@ViewModelInjectconstructor(privatevalsettings:Settings):ViewModel(){/* removed for brevity */fununarchiveAsync(inputStream:InputStream,item:ItemData){viewModelScope.launch{valrootFolder=settings.getAppDir()?:return@launchvaloutputFolder=File(rootFolder,"imported")/* removed for brevity */}}}
A ViewModel object has a lifecycle of its own and is intended to outlive the lifecycle of the view it is tied to until
the Fragment is detached. Rather than using an InputStream as an argument, it is better to use an Application context,
which is available throughout the life of the application which can be injected via constructor parameter injection in
MapImportViewModel. 1
We can then create the InputStream right in MapImportViewModel::unarchiveAsync:
classMapImportViewModel@ViewModelIjectconstructor(privatevalsettings:Settings,privatevalapp:Application):ViewModel(){/* removed for brevity */fununarchiveAsync(item:ItemData){viewModelScope.launch{valinputStream=app.contentResolve.openInputStream(item.uri)?:return@launchvalrootFolder=settings.getAppDir()?:return@launchvaloutputFolder=File(rootFolder,"imported")/* removed for brevity */}}}
Of course, turning on LeakCanary can be disrupting for development if an existing application has so many memory leaks. The temptation might be to turn off LeakCanary, where there is serious memory leaks to prevent disruption to current work. Should you choose to put LeakCanary on your application, it is best to do it only when you and your team have the capacity to “face the music”!
Summary
There is no doubt that Android benchmarking and profiling tools are powerful. To ensure that your application is getting the most out of analytics, it’s best to choose one or two tools as appropriate. It can be easy to get lost in the world of optimizations, but it’s important to remember that the largest wins comes from making optimizations with the least effort and the largest impact. Likewise, it’s important to take current priorities and team workload into consideration - for example, installing LeakCanary on an application with lots of memory leaks a team is not ready to face may lead to developers simply disabling LeakCanary setup, defeating the purpose of “facing the music”.
Discoveries of mistakes made in the architectural foundation of an application can be the kind of information bringing potential difficulty and conflict. What is important is to take everything in moderation, and to approach Android optimizations the way nutritionists and financial advisors encourage incremental, habitual changes over “crash dieting”. It’s better to pay a debt in steady chunks than it is to pay off so much that it’s difficult to cover bills with actual cash. Android profiling is intended to show you what’s really happening under the hood, but it’s important to remember that the average Android developer must prioritize which issues must be addressed in a world where their time and manpower may be limited.
The hope is that you feel more equipped to handle any potential bugs that may come your way, and that this chapter gives confidence to start exploring some of these tools on your own applications to see how things are working under the hood.
-
Android Profiler is an extensive and feature-full way to analyze application performance from networking to cpu to memory to energy analytics. Android Studio caches recorded sessions along with heap dumps and method traces for the lifespan of Android Studio so that you can compare with other saved sessions.
-
The Network Profiler can help solve Android problems specific to API debugging. It can provide information useful to both the client device and the server where the data comes from.
-
CPU Profiler can give insight to where most of the time is spend executing methods, and is particularly useful for finding bottlenecks in performance. You can record different kinds of CPU traces to be able to drill down into specific threads and callstacks. Analysis Panel and System Trace made available in CPU Profiling are features worth taking advantage of.
-
Energy Profiler looks at whether CPU processes, networking calls, or GPS location in an application could be draining device battery.
-
The Memory Profiler looks at how much memory is allocated in the heap. This can help give insight to areas of code that could use improvements in memory i.e. choosing to lazy evaluate values, avoiding memory leaks, and more.
-
LeakCanary is a popular open-source library created by Square. It can be helpful to attach leakcanary to debugging to detect more implicit memory leaks.
-
It is up to the developer to decide the most relevant tooling for use, and which optimizations outweigh in benefits over the cost creating it. Remember, the developer and the team must be ready to address performance optimizations, but it must be done in a way so that the benefits far outweigh the cost of optimization.
1 The @ViewModelInject annotation is special to Hilt, which is a dependency injection framework. However, constructor parameter injection can also be achieved with manual DI or with DI frameworks like Dagger and Koin.