
Classical Project Cost Control Techniques
Overview
There are many techniques that have been developed for project cost control. This chapter presents the most common and relevant of these techniques. Cost control can be defined as the judicious utilization and safeguarding of the cost of carrying out various activities of a project or a contract by management. The focus of cost control is to make sure that all the activities of a project are completed within their budget estimate. Cost control involves the implementation of regular and up-to-date monitoring system (using various techniques). This, according to Lester (2017), enables the identification of the expenditure with specific operations or stages, determining whether the expenditure was cost effective, analyze trends, and then take immediate action if the trend is unacceptable. For most projects, the monitoring and control of costs is essential from the point of view of the key stakeholders such as the project owner, designers, contractor, subcontractors, and so on. In essence, apart from ensuring that projects are completed on time, managers are next concerned about cost because, save for exceptional cases, there is little consolation in finishing on time but at an escalated cost.
Project cost control begins with a preparation of the original cost estimate and the subsequent cost budget. Keeping the delivery of the project within the cost budget and knowing when and where job costs are deviating are two factors that constitute the key to successful delivery of a project from a financial perspective. Furthermore, cost control involves applying cost accounting methods to determine the actual costs of production by comparing the expended costs with the budget. In addition to monitoring the current project spend, periodic reports are prepared to forecast cost at completion and an estimate to complete (final project cost), which is then compared with the baseline budget to ascertain whether there will be a cost overrun.
Purpose of Project Cost Control
The ultimate objective of cost control in management is the execution of an operation in the most cost-efficient way possible. In a project environment, the objective of project cost control is to forecast the project cost at completion during the delivery of the project and identify any negative trends and deviations from the baseline budget to facilitate corrective measures to be taken. Therefore, cost control provides information to the project team about inefficient areas of the project including the data that can be used to compute any variance from the planned cost performance standards. Cost control according to the APM (2015) is also necessary to keep a record of monetary expenditure for purposes such as minimizing cost where possible; revealing areas of cost overspend; and using cost information for the lessons learned process to provide a database of actual costs against activities and work packages that can be used to inform future projects.
Profit and Loss System
The approach of using the profit and loss on a project or contract has been used as a form of cost control mechanism. There are two ways this approach is implemented in practice; these are described in the next two sections.
Overall Profit or Loss
The overall profit and loss of a project, although not a proactive cost control mechanism for current projects, can be used as a feedback cost control for future projects in an organization. The measure is used in project delivery contracting organizations, consulting companies, and similar organizations. In this system, management waits until the project is complete and then compares cost incurred in delivering the project for a client with the revenue received from the client for that project to ascertain the profit or loss made in executing the project. The analysis of areas where profit or loss were made should be carried out for lessons learned. This calculation of profit or loss only serves to prevent errors from happening in future projects as the information produced cannot be used for the current project. This form of cost control should be adopted at the end of every project. However, it should not be relied on as the only cost control mechanism for ongoing projects due to its retrospective nature.
Profit or Loss on Each Contract or Work Package at Valuation Dates
This system is slightly more proactive than the overall profit and loss approach. Here the total costs to date of packages of a contract or project are compared with valuations at a specific date, usually at the end of the month. Other costs incurred in relation to each work package or subcontract but not yet invoiced, such as cost of materials delivered but not yet invoiced by the supplier, are normally included. The money due to be paid for each work package at that specific date is then compared to the cost incurred for that work package to ascertain if each of the package is in loss or profit compared to the budget. This can help identify areas of the project that are currently experiencing overspends and need attention and require their cost to be controlled. The downside to this system is that there is no breakdown of the profit figure between types of work making up the section or contract of a project. Therefore, as noted by Harris et al. (2013), it only shows which subcontract or work package requires attention and does not show it to the level of activities making up the work package.
Unit and Standard Costing
Unit Costing
A unit cost is the total expenditure involved in creating one unit of a product or service. In this system of cost control, costs of various types of work in the project are recorded separately. At the outset during cost estimation, the project is divided into various components. The cost of each of the project’s components is then calculated, and these costs are summed up to arrive at the overall project cost. As the project progresses, the costs both cumulatively and on a periodic basis are divided by the quantity of work of each type of work that has been done. This provides the actual unit costs that can be compared with those in the initial estimate for the project at the outset to indicate where the unit costs during execution of the project are higher, lower, or as estimated. Any necessary action can then be taken to control costs higher than estimates or budgets. It is usually best to record and compare project-level costs only, net of profit and overheads. The advantages of unit costing include the fact that it is simple and quick to implement. However, because it divides the cost extended on a quantity of work by the quantity of work for each type of work without context, it has the drawback of being unreliable and producing large deviations from the actual cost incurred.
Standard Costing
Standard costing involves the creation of estimated costs (the standard costs) for some or all activities within a company and by so doing its projects. The core reason for using standard costs is that it may be challenging to collect actual costs for all the activities in a company, so standard costs are used as a close approximation to actual costs. To control costs during implementation of a project, variances are calculated by comparing the value of the output with the cost of producing it. A variance is the amount by which the achieved profit differs from the budgeted profit, and this is analyzed into subvariances such as material price, material usage, labor rate, labor efficiency, fixed and variable overhead expenditure, volume of production, sales, and so on. This system provides comprehensive cost control for the company from boardroom down to workforce. However, a key limitation of this method is its lack of suitability for cost-plus contracts where actual costs are required, as per the terms of the contract. It is also not suitable in a fast-paced environment because the assumption that comes with standard costing is that costs do not change much in the near term and are usually not updated frequently. Therefore, standard costs are susceptible to being out-of-date in a fast-paced environment.
Program evaluation review technique (PERT)/Cost was developed in 1962 when the U.S. Air Force came up with an extension of PERT by adding resource estimates to the logic networks. Fleming and Koppelman (1998) noted that PERT/Cost relates to the value of physical work performed against the cost actuals to determine the utility and benefits from the funds spent. It is a PERT-based system (see Chapter 7 for a discussion of the PERT technique), which combines cost with scheduling. In the system, cost classifications are based upon project work breakdowns so that costs can be identified with the activities on the PERT network. The breakdowns serve as vehicles for both estimating and accumulating costs, thus PERT/Cost can be utilized to control the cost of projects. PERT/Cost employs the same principle used to produce the three-point probabilistic estimate for time in PERT as described in Chapter 7 to estimate ranges for cost instead of duration. In the PERT/Cost technique, the most likely cost estimate, the most optimistic cost estimate, and the most pessimistic cost estimate are used to calculate a mean cost for each of the activities of a project. The mean cost of all the activities added together will produce the mean total project cost.
Advantages and Limitations of PERT/Cost
PERT/Cost is a major improvement over traditional cost accounting techniques because it blends costs with work schedules. PERT/Cost was the original network-based project cost accounting system (PCAS). Most PCASs integrate work packages, cost accounts, and project schedules into a unified project control package. They permit cost and scheduling overruns to be identified and causes to be quickly pinpointed among numerous work packages and cost accounts (Nicholas 2020). The limitation of this technique is that it cannot be applied directly where the work is valued by a bill of quantities, which relates to the complete work rather than the operation (Harris et al. 2013). It is more useful in design and build project where the contractor can provide a valuation document that shows the operations to be performed (an activities schedule) because PERT/Cost requires an activity or operational schedule instead of the normal bill of quantities. Additionally, while the PERT/Cost technique provides a substantial measure of cost control for large complex projects, the breaking up of large projects into smaller more manageable units may increase the overall problem of coordination in managing costs on projects. Cost estimates in PERT/Cost may also eventually end up as budgets, and even though cost estimates are subject to revision, there is a tendency to inflate the budget in the initial planning stage.
Cost Value Reconciliation
Cost value reconciliation (CVR) is the comparison of the project value with the project cost at predetermined periodic interval during the progress of a project. This interval is normally monthly and tends to tie in with the company’s valuation and accounting procedures. The CVR process allows management and statutory procedures accounts to be prepared on a more meaningful basis. The CVRs are usually completed by the cost personnel on the project such as a quantity surveyor or cost engineer on construction and engineering projects. However, they are produced in liaison with other departments, for example, operations, project management delivery, procurement, accounting, and so on.
The reason for CVRs, especially in construction and civil engineering contracting companies, is first and foremost to monitor and therefore control the overall project. The CVR process allows the monitoring of the performance of a project in terms of cost of labor, plant and machinery usage, material cost against the budget figures, and taking control action if necessary. The CVR process also facilitates the comparison of the overall project profitability against budget and forecasts. It is also a good management practice utilized by construction and civil engineering contracting companies to provide overall accounting information to management and helps to satisfy accounting standards that prescribe the accounting treatment of revenue and cost associated with construction project contracts. Examples of such accounting standards include International Financial Reporting Standards (IFRS) 15 (revenue from contracts with customer) that replaced Internal Accounting Standards (IAS) 11 (construction contracts) in January 2018.
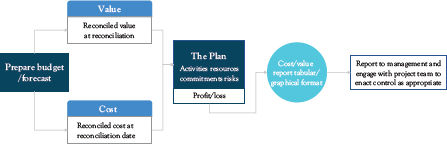
Figure 8.1 Principles of cost value reconciliation
Figure 8.1 depicts the CVR process, which indicates that there are two important aspects of a project that need to be understood in producing CVRs. These are as follows:
• The current cost expended for that value of work including liabilities to third parties and suppliers related to the work
• The current value of work
Cost Reconciliation in CVR
Costs are normally produced for each project monthly and will usually indicate accurately the amount of money spent. The cost should include items such as invoices, salaries as well as liabilities for work done that is yet to be invoiced by the third party or supplier. If these liabilities are not taken into account, then the cost reported for the month will indicate a false position. The liability will need to be recognized and added to the “paid” cost position (this is what is called a cost accrual). Many companies’ financial statements are prepared under the accrual basis of accounting where revenue and costs are recognized when earned (work carried out or service performed) and incurred respectively. Accruals are made for costs that have arisen for activities prior to the reporting date. Therefore, all goods and services received within the reporting period should be accrued for, if not already costed to the contract automatically through the company’s financial system.
Most projects will have their costs grouped against major headings. These are further divided into a series of subheadings to enable closer scrutiny of aspects of the job. The cost allocation must be true and accurate each month, as the monthly reports are used continuously by management to monitor not only the performance of the project, but other areas as well, such as the company’s profit margin, liabilities, cashflow, and so on. The regular monitoring of costs helps to determine whether the project is being delivered as planned or has gone off course, in which case the CVR reporting will highlight areas for appropriate corrective action to be taken.
Value Reconciliation in CVR
Value is what is earned from doing the work, and it is the quantity of work multiplied by the rate for doing the work, that is, the “agreed price,” not the “cost” of doing the work. That is, value is equal to net cost, plus overheads and profit. In the reporting of value during the CVR process, the concern is about the true “earned” (or internal) value of the work done and any out of balance recovery must be taken into consideration before reporting the contract position at any point in time. Without this adjustment, either an overstatement or understatement of the actual position will be given. Consequently, the external valuation (i.e., that certified by the client) may need to be adjusted to reflect appropriately the true earned value of the work carried out (See Table 8.1 for CVR good practices).
Advantages and Limitations of CVRs
Advantages:
• The CVR can be useful in comparing the current profitability and turnover of a project against what was estimated in the budget as well as the forward forecast.
• The CVR can be used to monitor project performance in terms of labor, plant, and material cost against original tender information, which can then be used to minimize overspending and control cost.
• The CVR can be used to facilitate increased accuracy of pricing of future projects since it provides information on general performance that can be used when assessing tenders on other similar projects.
• Once projects commence, cost value comparison is normally carried out on a monthly basis and the results of each project are then monitored against the anticipated performance, which provides management information that can help in the identification of problems on projects.
• CVRs can provide information that can aid cash management especially on large projects and the organization.
• CVRs provides organizations with the ability to control the project from outside the boundary of the project, due to CVR cost control measures being applied at the organizational level to achieve the desired project performance to meet the organizational objectives.
1. In reporting cost and value at monthly or other regular frequencies, the objective is usually to report the true position at that point in respect of cost incurred and income earned and to reconcile this with the overall prediction of the outturn profitability for the project.
2. Cost and value reporting and reconciliation is not simply a case of adding up invoices paid to determine cost.
3. Equally, it is not a matter of simply adding up the payment received to determine the earned value.
4. To obtain a true reflection of the position at any point, the adjustments must be made to both the cost and value sides of the equation.
5. Value should only be taken when it is secure and not liable to reduction in the future.
6. Value is taken against both completed and work in progress (both certified and not certified by the client), but only to a value where it is not likely to be reduced.
7. All costs relative to the value taken are recorded within the CVR.
8. Accruals for costs that have been incurred but not recorded on the system are accrued for in the CVR.
9. A key component of the CVR is the recognition of the true liability to subcontractors and suppliers.
10. It is important to recognize that the true liability to each subcontractor is not solely the amount paid, but it is the realistic financial obligation to the subcontractor at the reporting date or if the subcontractor stops trading, what the main contractor will be liable for at that date.
11. Cost accruals need to be reconciled on a regular basis to avoid the position where there is a large, accrued cost long after the works have been completed, thereby giving a false and pessimistic position.
12. Losses are recognized as soon as they are foreseeable, and profit is taken when it is earned and secure.
• The CVR technique might not lend itself to small and short-term projects or for small companies due to the time and resource requirement, which might be greater than the value derived from it.
• The production of the CVR relies on the skills and training of the personnel producing the CVR and bring inconsistency into the process. However, the use of templates and guidance can minimize this inconsistency but individual judgment and recollection of liabilities cannot be eliminated fully.
• Both cost and value must be taken at the same date, and if they fall on different dates, the data must be adjusted to match; otherwise, the method cannot produce accurate information.
• The reporting system and procedure can become too complex that, in many cases, it just ends up being a “box ticking” exercise with output that is not useful and the project team seeing it as requiring too much effort and a time-wasting exercise.
• The CVR technique can indicate that a project is running at a loss but what caused this loss will usually require further analysis and context.
S-Curve
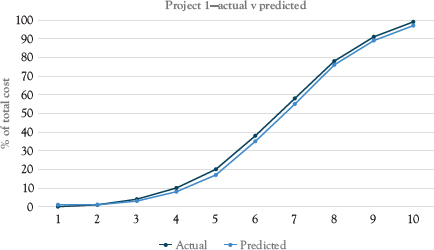
The S-curve is a mathematical graph that depicts relevant cumulative data for a project such as cost or man-hours plotted against time. The S-curve graph shows the shapes of the project’s budgeted cumulative spend and actual cumulative spend when plotted against time. It can then be used to show the difference between these cumulative spends by providing a side-by-side comparison. It derives its name from the shape of the graph for budgeted cumulative cost, which usually forms an “S” shape. The shape is caused by a natural progression of spending on most projects where the work of the project is usually slow at the start and takes some time to accelerate, increases sharply in the middle stage as progress is made, and slows down toward the end (see Figure 8.2). The point of maximum growth in the middle is called the point of inflection. During this period, lot of work will be taking place to deliver the project and majority of the major costs are incurred. After the point of inflection, the growth begins to plateau, forming the upper part of the graph known as the upper asymptote where the project delivery pace stabilizes until it slows to completion. The S-curve usually provides a visual representation of whether the current spending on the project is under the budgeted amount or over budget as the project progresses by comparing the current S-curve with the baseline S-curve.
The form of the S-curve is determined by the start date, the end date, and the way the value of work done is assessed. Once a consistent approach has been established and the historical data analyzed, there are three significant variables that need analyzing: time, money, and the shape of the S (known as the route). Since the expectation is that the route is fixed, then only two variables are left (time and money). Further analysis can be carried out by comparing movement of the S-curve from period to period in order to obtain the current trend for the project so that remedial action can be implemented as necessary.
Benefits and Limitations of the S-Curve
Benefits of the S-Curve
• The main advantage of the S-curve is that when the actual cumulative project spending is plotted on the same graph, it can show easily whether spending is more than was budgeted or less.
• The S-curve graph shows what is happening on a project
in relation to cost and spending visually and can be understood easily in order to act as necessary. The degree of alignment between the two graphs (current S-curve and baseline S-curve) will reveal the progress or lack of progress and if corrections need to be made to get back on track.
• As a tracking tool, it can be used for comparisons of different S-curves (such as cost S-curves, man-hours S-curve, target S-curve, and percentage complete S-curve) against the baseline S-curve to help in monitoring and controlling the project as required.
Limitations of the S-Curve
The S-curve doesn’t show the causes of the differences between the planned and actual spend. For example, if the current cumulative actual cost is less that the planned cumulative cost, it might be due to either of the following:
• The work was completed on schedule or even ahead of schedule but at a lower cost than planned.
• The work was completed behind schedule but at a higher cost than anticipated.
The difference between these two is significant because the former means that future costs are likely to be less than budgeted, and the latter means that future costs look likely to exceed the budget. The best way of answering this question is through a method called earned value analysis (EVA), which is discussed in the next section.
Earned Value Analysis and Management
Earned value management (EVM) is a methodology used to measure and communicate the real physical progress of a project against the baseline and to integrate the three critical elements of project management (scope, time, and cost management). It considers the work completed, the time taken, and the costs incurred to complete the project and helps to evaluate and control project risk by measuring project progress in monetary terms (Vandervoorde and Vanhoucke 2005). The basic principle of EVM is that the value of a package of work or activity is equal to the amount of money budgeted for its completion. EVA (see Figure 8.3) is a technique of analyzing a project’s progress at any given point in time, forecasting its completion date and final cost, and calculating variances in the schedule and budget as it progresses. The goal of the EVA is to support and facilitate the cost control process. The results of these analyses are used for EVM to manage identified variances, trends, and forecasts based on the EVA results.
EVA uses S-curves (see Figure 8.2), which examine the progress and forecast expenditure in terms of man-hours or money. The result is compared with the actual expenditure as the project progresses, or the value of the work done. In EVA, there are three major areas of control; these are commitments, value of work done, and expenditure. Therefore, S-curves can be produced for the value of work done, or commitment or even expenditure. The primary task of project control is to establish the exact position of the project from one time period to another in terms of the value of work done and compare this with the targets for each time period. Project control can comment on the validity of planning work by comparing planned and actual progress via the value of the work done.
EVA Measures
EVA uses three basic measures that are based on the actual costs incurred and cost estimate of a project. These are as follows:
• Planned value (PV) or budgeted cost of work scheduled (BCWS): This is the amount that is expected to be expended for the work scheduled at the present time.
• Earned value (EV) or budgeted cost of work performed (BCWP): This is the amount that is expected to be paid for the work that has been done at the present time.
• Actual cost (AC) or actual cost of work performed (ACWP): This is the actual cost of the work that has been completed at the present time.
The aforementioned three measures are then used to calculate a set of variances as detailed below:
• The cost variance (CV): This is the difference between the budgeted cost of work performed (BCWP) and the actual cost of work performed (ACWP), that is, CV = BCWP − ACWP.
• The schedule variance (SV): This is the difference between the budgeted cost of work performed and the budgeted cost of work scheduled (BCWS), that is, SV = BCWP − BCWS.
The project control status is based on the aggregate of the cost variance and schedule variance as explained above.
EVA is also used to give an indication of how far the project is ahead or behind schedule and how far the project is ahead or under budget by calculating a couple of indexes as explained below:
• Schedule performance index (SPI) is calculated as SPI = EV/PV. When the SPI is less than 1, greater than 1, or equal to 1, it indicates the project is ahead of schedule, behind schedule, or on schedule, respectively.
• Cost performance index (CPI) is calculated as CPI = EV/AC. When CPI is less than 1, greater than 1, or equal to 1, it indicates the project is under budget, over budget, or on budget, respectively.
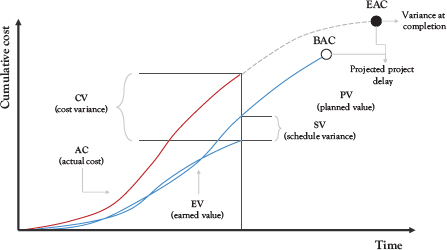
Figure 8.3 Typical earned value curve
EVA can also be used to forecast the performance of the project using the following indexes:
• Budget at completion (BAC): This is the total budget for all the works that need to be carried out on the project, it is calculated before the start or at the start of the project.
• Estimate at completion (EAC): This is used to give an indication of how much an activity of the project will cost at completion considering the rate achieved to date. This is calculated as follows EAC = Budgeted cost at completion/Cost performance index (CPI).
• Variance at completion (VAC): This is used to give an indication on how much over or under budget will the project be at completion considering the rate achieved to date. This is calculated as VAC = Budgeted cost at completion − EAC.
• Schedule at completion (SAC): This is used to give an indication of how long the activity or project will take to complete considering the rate achieved to date. It is calculated as SAC = Forecast duration/Schedule performance index (CPI).
In summary, the EVM is a system of approximation, the accuracy of which depends on the time and costs prepared in the estimate compared with the actual time and costs as work progresses. Therefore, the accuracy of the estimated and actual data is paramount to the successful application of EVM.
Advantages of EVA and EVM
• EVM is a comprehensive yet not oversophisticated methodology that allows the project team to measure and monitor the performance of a project. It brings together cost, time, and scope, which are three diverse but critical factors of a project to enable the analysis of the performance of a project as it progresses.
• It improves project performance, visibility, and accountability and provides data for proactive management action including detailed project progress and forecast analysis data for effective decision making.
• EVA focuses on the measurement of cost and value. The variance analysis inherent in the EVA technique enables the assessment of the differences between the project baseline(s) and the actual performance.
• It can be used for forecasting on projects, which enables trend analysis and the ability to estimate the future performance of a project to identify the areas of improvement.
• The EVA measures can provide accurate results that can help identify discrepancies, change plans, correct mistakes, and make timely yet quality delivery possible.
• It helps achieve greater visibility and control of the project activities, which helps in responding to issues in a proactive manner giving the project a better chance of success.
• It provides a clear communication of the activities involved in delivery of a project and improves project visibility and accountability.
Disadvantages of EVA and EVM
• Earned value does not take quality of the work done into consideration because even though a project might be performing well on all the earned value metrics, but the quality of work may be below what is required.
• The cost of implementing EVM may sometimes discourage companies (especially small organizations) from using the method.
• Generally, computer software is required to use the technique, and the cooperation of different people and coordination among the different departments within the company are required to implement EVM.
• Similarly, it requires a significant amount of time to collect all the relevant data and information; for example, data in relation to actual costs needed to implement the method, especially on big projects, while on small projects the effort required might be greater than the value derived from it.
• Since planned value is used as the baseline, it relies on prediction that brings uncertainty and subjectivity into the process. Therefore, even though a project might be performing well on all the EVA indexes, it might encounter delay in the future due to uncertainty involved in the planned value calculation.
• Once a project is over/under budget, CPI can remain the same for the remainder of the project, unless EV or AC changes significantly. The CPI is dependent on AC for accuracy. If AC does not include all appropriate costs, the CPI will not be accurate.
• The EVA is unable to distinguish between a critical task and a noncritical task. Therefore, even though the SPI may be indicating that the project is ahead of schedule, it might be because of many noncritical activities that are ahead of schedule eclipsing some critical activities that are behind schedule.
An Appraisal of the Suitability of the Cost Control Techniques
The previous sections have presented most of the classical project cost control techniques that can be used to control projects. Table 8.2 presents a summary of their applicability, strengths, and weaknesses.
From Table 8.2, it is evident that there is no flawless cost control technique, as each cost control technique has its own individual strengths and weaknesses, indicating that there is no one cap fits all cost control technique. For example, traditionally, cost control has been carried out using the S-curve technique showing the expected budget performance compared with the current performance S-curve, although the S-curve technique has some advantages such as that it can be drawn from experience of previous similar operations in the company at the estimating stage or it can be prepared on an arbitrary basis. The problem with the S-curve is that because the chart is frequently used as a means of control by plotting the actual expenditure curve against the budget curve, it is sometime wrongly assumed that whenever the actual expenditure curve keeps below the budget curve for value, the cost of the work is being controlled effectively and that the work is being carried out efficiently and profitably. However, from the control point of view, this combination of information is almost meaningless because the actual expenditure curve is not related to the physical quantity of the work, which has been carried out, nor the efficiency of operations. While the EVM, which is undoubtedly the best cost control technique in that it incorporates, time, cost, and scope, it also has some weaknesses such as its reliance on the estimate data and the perception that it is demanding of data. Therefore, it is important for project practitioners to understand the limitations of the cost control technique they are using and guard against them. This chapter has provided information that would help project practitioners in choosing the appropriate cost control technique for their project and using it in an informed way to enable effective cost control.
Table 8.2 Trait summary of existing project cost and time control techniques