
2 Macroeconometrìc Analysis of Quality of Life: Measurement of the Synthetic Latent Categories
Section 1.3 of Chapter 1 provides an analytical review of existing so far world's most well-known methods of modelling and measurement of synthetic (latent) categories of quality of life (QOL) both within the objectivist and subjectivist approaches including their simultaneous use. There were also the following main drawbacks of almost all of these methods.
| (a) | In all the methods it is proposed to construct the integral indicator y, which measures the analysed synthetic latent category QOL only in the form of a linear function from a set indicators that we have at our disposable (partial criteria) |
| (b) | The weights Wj(j = 1,2, ...,ρ), involved in the calculation of the integral indicator y are determined by direct expert evaluation. Meanwhile, numerous experimental studies in economics, sociology and psychology confirm the fact that experts are much more reliable and able to make a concerted integral evaluation of the object rather than to decompose the integral evaluationaccording to the significance of its components.2 |
| (c) | The ability to objectively justify the lack of a satisfactory solution to the problem of transition from multi-objective scheme (with partial criteria x(1); x(2),…, x(p)) to a one-criterion (y) is either ignored altogether, or is not being attempted to determine the number and type of multiple criteria) y(1),…, y(k), to significantly reduce the dimension ρ of the original multi-objective scheme (i.e. k « p). |
| (d) | The integral indicator of quality of life (II QOL) as a linear function of x(1), x(2);…, x(p) is not adjusted to take into account the principle of “noncompensated preference” that occurs when the values of at least some of the particular criteria x(1), x(2),…, x(p), are close to the so-called critical ones (see problem (D) in point 1.3 of the accounting action of “principle of noncompensated preference”). |
The following proposed methodology for building II QOL eliminates the disadvantages (a), (b) and (c) and, in some cases lets us gain a significant progress in eliminating the problem of lack of (d) (due to greater than linear class of admissible “bundle” y=f(x(1), x(2),…, x(p)) and the multicriteria of integral indicators). Recall that this chapter and Chapter 3 are devoted to macro econometric analysis and accordingly these chapters reflect on evaluation (measurement) of synthetic categories of quality of life for the entire population of conglomerates, including the ones that differ a lot (for the population of the country in the whole and its individual regions – the subjects of the Russian Federation and municipalities). This means that we start from the objectivist approach, and our initial information comes from the official international and Russian government statistics.
2.1 Integral Components of “quality of life” category and their analysis
Before describing directly the methodology of constructing the integrated indicators y=f(x(1), x(2),…, x(p)) that measure one or the other category of latent synthetic QOL it is necessary to define the overall structuring of the entire system of statistical indicators, particular criteria and basic synthetic categories, the synthesis of which brings us to the synthetic category of a higher level of generality – “quality of life of the population of the territory” (country, subject of the Russian Federation, municipality).
Described below is a variant of this structuring that was proposed by me at the end of the 90 s of the last century as a result of my work on the subject performed for the State Statistics Committee and the Ministry of Economic Development of Russia [Айвазян, 2000].
In developing this evaluation I proceeded from the assumption that the basic properties of the quality of life of the population are formed and manifested in its interaction with the “external objects” and with each other, in its ability to adapt to the world around it, to survive, to reproduce and to meet its needs. Considering the human being as both biological (operating in accordance with all laws of biological homeostasis) and as a social being (realizes itself only in society, in the processes and mechanisms that operate based on specific “social rules”), I came eventually to the following five basic synthetic categories that form the environment and life support system of the population.
| I. | Quality of the population – integrates such properties as life expectancy, level of education, qualification, births and deaths and marriages [Медков, Качество населения, 1993; Соградов, 1995]. |
| II. | Welfare of the population – integrates the main indicators of quality of life and reflects the degree of satisfaction of its material needs (real incomes, their differentiation, the level of consumption of goods and services, the level of health care, etc.); |
| III. | Quality of social sphere – reflects the level of working conditions, social security, physical and property security of the members of society, the crime and sociopolitical health of the society, etc.; |
| IV. | Quality of the environment (or the quality of the ecological niche) – accumulating data on the pollution of air species, soil and water; we have to note that the human population is the only species of the earth that does not provide utilization of its waste, which is environmentally hazardous and not included into natural technology of the nature – “food chain of the biosphere” [Шакин, 1997] |
| V. | Climatic conditions – characterized by the composition and volume of natural resources and raw materials, climate, frequency and specificity of force majeure. |
It is easy to see that each of the components I-V reflects the conditions under which the processes meet both biological and social needs of members of society. Sequential hierarchical decomposition of each of the basic components would allow us to “go down” to the set of the relevant characteristics of the lowest level, the vast majority of which can be represented by standard statistical indicators (as an exception, some of the indicators of the lower level have to be assessed expertly, for example, by using a point scale).
Figure 2.1 represents a general scheme of a hierarchical system of criteria and statistical indicators of the decomposition of the proposed category of “quality of life”. We equip this scheme with some comments.
The category of “quality of life” as well as each of its basic integrated components I-V, in one form or another is discussed, and even evaluated in various studies (and in the relevant literature) on the analysis of the conditions and the standard of living of the population.
There are also attempts to expertly evaluate the category of “quality of life” [WCY, 1997-2011]. It should be recognized, however, that the degree of subjectivity and hence random spread in the estimates of experts is too high, which is apparently due to excessive blurring of the conceptual guidelines and criteria that govern experts [WCY, 1997-2011] in the formation of their estimates. A similar observation can be attributed to the indicator “security” (“Security”); we have to add to this our assumption that in the interpretation of this indicator [WCY, 1997-2011], this figure reflects only the degree of physical and property safety of members of the society and does not include the working conditions, social security and other necessary characteristics of the category of “social security”.
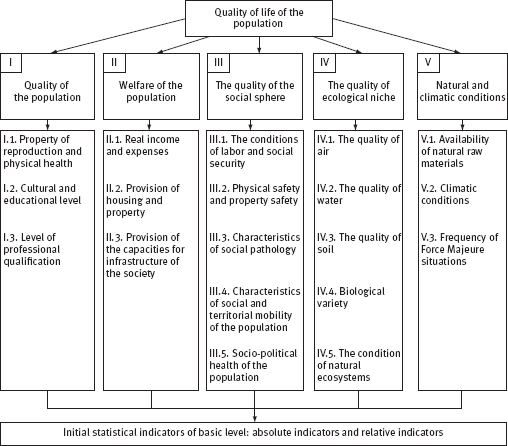
Figure 2.1. Hierarchical system of statistical indicators, particular criteria and integral indicators of the quality of life ofthe population (country, region)
A certain category of “quality of the population” seems to us as relatively more developed. Our position on the interpretation (but not on the dimension) of this integral property is based on conceptual installations close to those given in Sogradov [Соградов, 1995] and in the “Method of calculating the index of human development” proposed by a group of staff and experts of “Development Programme of the UN” [HDR, 2002]. The literature also discusses the characteristics and problems of working with data and experts to assess the quality of the environment [Шакин, 1996; Демография, Экономика, Экология, 1997].
Decoding of the property of “well-being” (or “standard of living”) of the population is mainly based on the methodology used by the State Statistics Service of the Russian Federation (Rosstat). When using this technique and related socio-economic indicators we try to possibly avoid or at least reduce the discrepancies and uncertainties arising from the unreliability or lack of representativeness of primary data of Rosstat. So, no doubt that the “bottleneck” of the primary statistics includes: clearly inadequate coverage of income of the population and non-state enterprises, poor representation of the results of surveys of household budgets (the range of surveys misses a significant proportion of the rich and super-rich families, almost all of them) and excessive narrowness of the range of the covered issues (the most important security issues, social relationships, leisure activities and political relations with the authorities are outside of this range); lack of reliable information on the export of capital from Russia; a clear underestimation of production in the country and others.
It is interesting to compare the above criteria and structuring of the private integral indicators of QOL with a modern point of view on the issue of the global scientific community, expressed, in particular, in the report of the Commission to assess the economic performance and social progress [Report, 2010-2011]. The commission has identified the following key areas that must be taken into account in the analysis and evaluation of QOL:
| (i) | the material standard of living (income, consumption, wealth); |
| (ii) | health; |
| (iii) | education; |
| (iv) | personal activities, including work; |
| (v) | political influence and control; |
| (vi) | social ties and relationships; |
| (vii) | the state of the environment (currently and in the future); |
| (viii) | sense of insecurity, both economically and physically. |
Projecting these key areas on our scheme (see Figure 2.1), we see:
| – | category I “quality of the population” includes the field (ii) and (iii); |
| – | category II “well-being” corresponds to the (i); |
| – | category III “social quality” field includes (iv), (v), (vi) and (viii) (taking into account capabilities required due to the availability of a measure of the statistical information); |
| – | category IV and V “quality ecological niche” and “climatic conditions” constitute the content area (vii). |
We see that there are no fundamental differences with the statements of the report. All the matter is in a particular filling of each of the areas (categories) with relevant statistical indicators, and this is more of a technical (and financial!) problem of government statistical services.
Thus, summing up our thinking about the quality of life of the population and its common metric, we can formulate the following points of the starting position adopted in this paper:
| (a) | it can be varying degrees of integration (and the hierarchy) of the generalized indicator of quality of life – from the reported and recorded statistically indicators (such as life expectancy, the value of per capita expenditures, unemployment or crime) to the integral indicator of top-level that synthesizes all the basic (more specific) aspects of quality of life in it; the choice of the level of generality is dictated by the specific applied research objectives; |
| (b) | for each fixed level of generality, we can postulate the existence of a sufficiently stable in time and space set of basic factors (including latent ones), which together define a quantitative estimate of the analysed categories of integrated quality of life; the composition of these factors depends on the level of generality of the integral indicator and specific applied research objectives; however, the method of constructing the corresponding II QOL (even if we've already selected the level of generality and specific applied research purposes) shall be capable of verifying the underlying factors and the relative densities of their impact on II QOL after a certain period of time and/or the transition from one accepted in the society system of values to another for the purpose of adequate “settings” on the specific time and place; |
| (c) | an integrated indicator of any category of synthetic quality of life is a particular type of convolution of estimates of more specific properties and criteria of this concept (which, in turn, can be presented either in the form of various combinations of reported statistical indicators or in the form of a relevant expert evaluations); it is designed for comparative analysis (in time and space) in this category, as well as to identify “bottlenecks” in the socio-economic development of the country or region. |
On the basis of these conceptual provisions that belong to the synthetic categories of quality of life of the population, and in particular to its basic integral properties I-V, let's look at the main components of each of these properties.
It is obvious that the maintenance on the appropriate level of quality III.1 and III.2 will help improve the efficiency of socially useful work, achieving high rates of GDP and GNP, and create a comfortable socio-psychological climate in society. A high level of component III.3 is the guarantee that the state is providing all the necessary civil rights and freedom, which contributes to the high quality of the socio-economic and socio-political behaviour of the population, and that in turn works on the efficiency of the processes of enhancement of national wealth and its fair distribution among the members of society.
| IV. | Quality of the environment (ecological niche). Assessment of the state of natural and biological environment in terms of living conditions of the population should characterize the degree of suitability of its elements for life, work and recreation of the population. This could be easily done, if we would have had, at first, sound system of standards that characterize the quality of the elements of nature, and, second, the functioning system of environmental monitoring in the country, that would have had the capabilities that match the characteristics of the problem at hand.
The first of these problems is solved today through the development of standards for maximum permissible concentrations (MPC) of harmful substances in air and water. The Ministry of Health until recently approved MPC of 114 harmful air substances and 294 harmful waterbody substances that are intended for sanitary and domestic use. The second problem is the need for the formation and development of the Unified State Environmental Monitoring System [On the organization of work, 1994]. It is aimed at assessing Natural Environment as a factor determining the quality of life of the population. Existing environmental control authorities today carry this task only on a very limited scale. Control over the pollution of water and air pollution is the most developed of their functions today. It is carried out by hydrometeorological, public health and other services. It should be recognized that the national system that would fully ensure the collection and processing of information necessary to monitor the state of the environment as a whole has not yet been created. So, as of now, means of collecting factual information on the state of the environment as well as an integrated system of assessment of that state is clearly underdeveloped. Under these conditions, a rough estimate of the quality of the environment is proposed to be made on the basis of the following three private properties:
|
||||||
| V. | Natural and climatic conditions. Of course, these greatly influence the formation of mentality, values, and living standards of the population. Understanding in this paper the complex climatic conditions that the population of the region lives in and natural resources for the certain region (country) comes from the overall context of analysing and measuring various aspects of quality of life. Our understanding of this integral component of the synthetic category of quality of life is based on the thesis, according to which, natural raw materials and climatic conditions are treated as “body and the forces of nature that at this level of development of the productive forces are essential to the life and activities of human society, but not directly involved in the material production and non-production activities of people” [Минц, 1972] (italics mine). |
Accordingly, the formation of a system of statistical indicators of natural raw materials and climatic conditions are proposed to be done by using the following scheme.
| 1. | Highlight basic elements (climate, topography, landscape, natural resources, etc.) that are not the direct object of economic relations in any socio-economic formations, and that are characterized by long-term (at least 25-30 years) stability, and determine the level of comfort of living conditions of the population of the region (country) [Resources, the environment, resettlement, 1974, pp. 199-207]. |
| 2. | Build a rating system of regional climatic conditions, based on the measurements of the previously entered basic elements (for example, using the methods of assessment mapping) [Resources, the environment, resettlement, 1974, pp. 189-198]. |
| 3. | Form integral indicators of the natural resources and natural climatic potentials which are then used as components – correction factors when calculating the integral indicators of quality of life of the population of the region (country). We can do it with the help of special methods based on measurement estimates of basic elements. |
2.2. Requirements for the formation of a priori set of statistical parameters for different synthetic categories of quality of life of the population
Each applied research that presents the hierarchical system of statistical indicators has to be filled with specific content, as we did above, by experts based on:
| – | the level of the analysed population conglomerates (cross-country, interregional, inter-municipal); |
| – | some general requirements for representativeness (relevance), information accessibility and information reliability of statistics. |
With regard to taking into consideration the level of analysis (cross-country, interregional or inter-municipal), it is determined by the specifics of the overall strategy of development of the world, regional (within the country) and municipal (within the region). This means that the composition of initial statistical indicators (partial criteria) that characterize analysed synthetic category, for example, at the country level, will, in general, be different from the composition of the indicators at the regional and municipal levels.
In addition, while forming the initial (a priori) set of statistical indicators (partial criteria), characterizing a certain synthetic category of QOL experts should be guided by the following general requirements:
| (A) | representativeness (relevance), according to which this list must include (with an exogenous conditions being preset for all other aspects of QOL) all the main indicators that are considered to be a synthetic category; for example, for the category of synthetic QOL of the very top level this list should include the most important quality characteristics of the population (aspect I), material well-being (aspect II), the quality of social services (aspect III) and the quality of the ecological niche (aspect IV); |
| (B) | the availability of information, according to which the further analysed indicators and private criteria should be at least available for their statistical registration, and moreover, they must be included in the nomenclature of periodically recorded official statistics (or can be calculated according to the values of the latter); |
| (C) | the reliability of information in accordance with which the statistics and the particular criteria used should adequately reflect the condition of the analysed aspects of the quality of life; for example, precisely because of the violation of this requirement, we had to abandon the use of such seemingly essential for the synthetic category of QOL top-level indicator as “the average number of reported violent crimes per year per 100 000 inhabitants”: the fact is that the small values of this index and a low crime rate are often not indicators of a great state of affairs in this area, but instead it is due to weak statistical work and poor law enforcement. |
2.3. Measurement methodology of synthetic categories of the quality of life and methods of mullticriteria rating of the territories (countries, subjects of russian federation, municipalities)
2.3.1. Statement of the main tasks
So, we have to present and justify the methodology of building the integrated indicators for the various synthetic categories of QOL of a country or a region, based on a special type of convolution of the number of private (statistically recorded) criteria of the appropriate synthetic categories of QOL. We also have to demonstrate the efficiency of this methodology in comparative macroeconomic analysis and in the rating of the countries or regions as well as to propose an approach to multicriteria classification of countries (regions) according to the analysed integral properties of QOL in situations where the problem of constructing a single scalar II QOL has no satisfactory solution. To achieve this goal, we must be able to perform the following tasks.
Task 1 (preanalysis). Determination of the initial (a priori) list of statistical indicators x(1), x(2),…, x(p) that would characterize the analysed synthetic category of QOL adequately (reflecting different aspects). Taking into account the semantic load of the above indicators we will also call them the partial criteria of the analysed synthetic category.
Task 2 (preanalysis). Development of specific methods of selection of relatively small number ρ'(p'<p) of partial criteria that play a major role in shaping the values of the analysed integral indicator of quality of life from a priori list of partial criteria x(1), x(2),…, x(p), derived from the solution to problem 1. In other words, we are talking about a method of forming a posteriori set of particular criteria x(j1), x(j2),…, x(jp’) selected from a priori list of indicators x(1), x(2),…, x(p).
Task 3 (preanalysis). Unification of measuring scales of all the analysed variables, i.e. transition to [0; N]-point scales for the measurements of the analysed partial and integral criteria of QOL so that the value “zero” would correspond to the lowest level of QOL and the value of N to the highest (the dimension of the scale N is chosen by an investigator).
Task 4 (central). Development of methodology for constructing an integral indicator – a measure of the analysed synthetic category of QOL (II QOL) in each of the two possible formulations of the problems:
| – | version “with learning': the construction of II QOL using values of partial criteria x(j1), x(j2),…, x(jp’) of posteriori set and using some (“teaching”) expert information on the comparison of the considered objects (in our case, territories) of the analysed synthetic category of QOL; |
| – | option “without learning”: the construction of II QOL only by the values of a set of particular criteria x(j1), x(j2),…, x(jp’) of posteriori set. |
Task 5 (post-analysis in the presence of “learning”). Evaluation of the consistency of the two rankings of the territories in question by analysed synthetic QOL category, one of which is based on the existing expert “training”, and the other is based on the values of II QOL constructed by solving the problem 4 (in either of the two options).
Task 6 (post-analysis). The construction and analysis of auto- and inter-territorial dynamics of II QOL that allows us to compare in time the analysed property of QOL of the territory in relation to itself (auto-dynamics) and in relation to other areas (inter-territorial dynamics).
Before proceeding to the description of methods for solving the problems stated above, it is necessary to introduce the concepts and forms of “statistical learning” in the general problem of measuring latent synthetic category.
2.3.2. Concept and forms of “statistical learning” in the general problem of measuring latenty synthetic categories
In professional work and in everyday life man is constantly faced with situations where he has to compare some objects with each other and organize or sort them by some of their qualities (not directly measurable). This may include, in particular, a comparison between countries of various aspects of quality of life; companies in the industry, their performance, sophisticated products, generalized characteristics of quality; specialists, effectiveness of their participation in the implementation of certain task; and the participants of team sports, the level of their demonstrated excellence etc. The work of Aivazian [Айвазян, 1974] was devoted to the formalization of the situations arising out of the above-described tasks. It provided recommendation for the construction of a conditional measure of the said property and suggested a so-called expert statistical method for solving this problem.
The method of solving problems of formation of a-posteriori set of particular criteria and obtaining a certain convolution of these partial criteria as a measure of the analysed integral property essentially depends on the presence or absence of the so-called learning in our initial statistical data and on the form of presentation of this learning. Let's discuss more aspects of this problem.
So, let's think that the generalized summed up characteristic ƒ of the analysed property of the object is determined by a set of partial criteria defined by identifiable and measurable variables x(1),…, x(p), but this very characteristic is latent, i.e. is not directly quantifiable (there is no objectively defined scale for it). Natural to assume that its intuitive expert (professional) perception (we'll call it yst) can be represented as a somewhat distorted value ƒ(x(1),…, x(p)), and this distortion δ has an accidental quality to it, and it is due to both the resolution of such a “measuring tool” as an expert (according to our scheme) and also the existence of some particular criteria that have some weak influence on yэ, but are not really a part of X = (x(1),…, x(p)). Then the model that relates the intuitive idea of a composite index of quality (yэ) with the consolidated exponent f(X) (as a function of X) and a random error δ(X), can be defined as
![]()
If we accept the natural, almost not limiting the generality of the scheme assumptions about the first two moments of the residual random component δ(X):
![]()
it is obvious that a generalized consolidated (integral) characteristic f(X) can be interpreted as regression yst no X.
Note on the objective functions. It is very common in the field of socioeconomic research to interpret the generalized consolidated (integral) characteristics of quality ƒ (X) as an objective function. Wherein, we consider as objective function of analysed output quality y any transformation ƒ of particular criteria x = (x(1), x(2),…, x(p)) that would preserve a given relation of order between η objects under consideration for y. In other words it has to have the property that from
![]()
always follow the inequalities
![]()
where ƒ (Xi) and yi – accordingly is the value of the objective function and a consolidated measure of quality that characterize the ř object. Obviously, the definition of objective function given here is ambiguous. Indeed, if f(X) is an objective function and φ(ƒ) is any monotonically increasing function, then any function of the form
![]()
will also be objective. This implies that our assumption of a certain scale to measure y in some cases has purely instrumental role and doesn't point us in the direction of identifying it. Indeed, according to this definition, the objective function value does not reflect any real, physically meaningful quantitative regularities. Actual patterns are recorded only as relations of “more” or “less” between the values of this function for different sets of values of the input parameters X = (x(1), x(2),…, x(p)). Thus, these ratios reflect the preference (from the point of view of analysed output quality) of some X values over the others. So, in applications in which it is possible to adjust the value X (in some area that would allow us to do it), the most efficient (optimal) management would be the one that maximizes (with given restrictions for X) values of the objective function.
By the way, the issues of constructing objective functions will be looked at in Chapter 4 in connection with the problem of statistical evaluation of the objective function of consumer preferences based on data from selected surveys of household budget (see point 4.1.2).
Definition. We say that our initial statistical data contain the “learning” if when performing the statistical analysis of the model (2.1) we don't only know the values of the partial criteria ![]() the total number of statistically surveyed, compared with each other objects), but we also have some information on the comparison of the objects (in our case, territories) by the analysed synthetic category.
the total number of statistically surveyed, compared with each other objects), but we also have some information on the comparison of the objects (in our case, territories) by the analysed synthetic category.
This information is usually obtained with the help of specially organized survey of experts and appropriate statistical processing of expert estimations. These data are usually presented by experts in one of the following forms.
Form (i) – the most informative (and therefore the most difficult for experts) option. It involves obtaining the expert scores on output quality
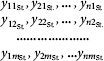
where yijst is the estimation of the output quality of the object Oi, obtained from the j-th expert (here η is the estimated number of objects, and m is the number of participating experts).
Form (ii) – the average in terms of information (and the degree of difficulty for experts) option. It requires the experts to sort the inspected objects by the degree of manifestation in them of the property analysed, i.e. rankings of the following type

where Rijst is the rank (or place) assigned to the object Oi by the j-th expert in a line of η inspected objects, sorted by this expert by the degree of manifestation of the analysed property.
Form (iii) – the least informative (and least difficult for experts) option. Information from each (j-th) expert comes in the form (n×n) – Boolean matrix of paired comparisons
![]()
where γ;fc. is the result of paired comparison by j-th expert of the objects Oi and (¾, which is defined by the following rule:
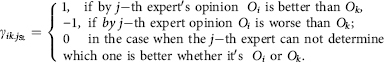
Note. In the inter-territorial analysis of the quality and way of life the most common form of expert learning is perhaps the one when they split the territory in question into a small number of groups sorted by the synthetic category analysed, that doesn't give any preference though to one territory over the other in the same group (for example, grouping all the analysed territories into three groups: leaders, “average” and outsiders). But, strictly speaking, such form of expert learning fits both within the frame of the form (ii) (if we assume the existence of so-called connected, i.e. indistinguishable ranks), and also within the form (iii).
Computational difficulties associated with the implementation of algorithm of building II QOL in the form of convolution naturally increase as we move from a more informative options for expert learning to less informative. Below (in point 2.3.5 and 2.3.6) we'll look at these algorithms for each of the above forms of learning.
2.3.3. Unification of scales in the measurements of particular and integral criteria of qol (task 3)
Before we proceed directly to the procedure of convolution of partial criteria, it is necessary to bring these criteria x to the “common denominator”, i.e. apply such a transformation to each of them that as a result they all are going to be measured in JV-point scale. The zero value of the transformed figure has to correspond with lowest quality of given property, and the maximum (JV) value with the the highest. The particular choice of unifying conversion depends on which of the three types the analysed indicator belongs to.
| 1. | If the initial value (particular criteria) x is connected with the analysed integral property of the quality of life by monotonically increasing dependence (i.e. the higher the value x, the higher the quality), then the value of the corresponding unified variable is calculated by the formula
where xmin and xmax are the lowest (worst) and the highest (best) values of the baseline indicator. |
| 2. | If the initial value (particular criteria) x is connected with analysed integral property of the quality of life by a monotonically decreasing dependence (i.e. the greater the value of x, the lower the quality), then the value of corresponding unified variable is calculated by the formula
|
| 3. | If the initial value (particular criteria) x is connected with analysed integral property of quality of life by non-monotonic dependence (i.e. between xmin and xmax there is an optimal value xopt, which provides the highest quality), then the value of corresponding unified variable is calculated by the formula
|
To implement these changes we need to be able to determine the values xmin, xmax and xopt. for every private criterion x. Since theoretical-normative approach in determining these values in most cases can be very complicated (and, in particular, the need to harmonize different points of view), in this paper we propose to use an empirical approach for this purpose. In particular, we offer to assign the minimum and maximum values of all the observed values (for different regions or different time steps) of this variable as xmin and xmax, respectively. Question on the definition of values xopt is solved in each case individually taking into account the specific situation.
For example, if we have learning in the form of expert scores or rankings of the territories in question by analysed synthetic category, then xopt can be a result of averaging of this index for three or five territories that the experts consider to be the leaders in synthetic analysed category.
Note. It is easy to see that the first two formulas with the help of which we perform the unification of the measurement scales of the analysed parameters are actually special cases of the third formula with xopt = xmax and xopt = xmin.
2.3.4. Formation of the reduced (a posteriori) set of particular criteria (task 2)
In forming the initial (a priori) sets of statistic values for each of the analysed latent synthetic categories of QOL (task 1) experts are invited to rely on the above-described structuring of particular criteria and integral properties of QOL (see Figure 2.1) and bear in mind the general requirements (A) (B) and (C) (Paragraph 2.2).
The basic idea on which the method of forming the reduced (a posteriori) sets of particular criteria for each of the analysed synthetic categories is built consists of the following.
From the formed (theoretical, substantive considerations at the expert level) a priori set of particular criteria of the specified integral property we want to select (or leave it for further analysis) a relatively small number of indicators so that, first, they really directly characterize this integral property and, second, we should be able to reconstruct fairly accurately the values of all other particular criteria (excluded from the set of a priori) by using the values of this small number of indicators with the help of appropriate regression models.
Method of implementing of this general idea depends on the presence (or absence) of learning in formulating the problem of measurement of latent synthetic category.
a) Selection of the most significant private criteria in the presence of learning. We assume that the model (2.1) is parameterized in the class of linear functions of partial criteria x(1),…, x(p), and at the same time we have learning in the form of (i) as a common version of the expert scores y1St:, y2St:,…, ynSt,:. of the analysed synthetic categories for the all considered objects (regions, countries). In this case, for the “point in time” t, we can consider the linear regression model of the following type
![]()
Then, we can do the selection of the most significant partial criteria, for example, through a combination of stepwise regression methods (or “method of all possible regressions”) with “addition” and with “exclusion'. Let's recall the general scheme of these procedures.
Step-by-step procedure of successive addition is designed for selection (in the linear multiple regression model (2.1')) of the most informative set from k of explanatory variables selected from the source (a priori) multitude of explanatory variables x(1),…, x(p) (obviously, k < p).
In the first step of this procedure (k = 1) we select a variable xˆ from the original set of explanatory variables X = (x(1),…, x(p))T that has the maximum value of the square of the coefficient of pair correlation with the dependent variable y, i.e.
![]()
On the (v + 1) step of this procedure (1 ≤ ν ≤ρ-2, k = ν + 1) we already have the previously selected most informative variables x(j1),…, x(jv), Next (v + 1) informative variable x(jv+1) selected so that
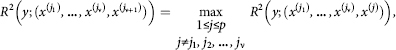
where R2(y; (x(l1),…, x(lN))) – retouched “for unbiased” coefficient of determination between y, on one hand, and the set (x(l1),…, x(lN)) on the other.
Typically, such a procedure is ended on the step, at which the transition to the next step doesn't give a statistically significant increment to the value R2.
Step-by-step procedure of successive elimination is designed to remove from the source (a priori) set of explanatory variables x(1),…, x(p) those variables that do not increase the predictive power of the model (2.1′).
In the first step of this procedure from the original set of explanatory variables we remove the variable x(i1), the exclusion of which from the model (2.1′) leads to a minimum decrease in the value of the coefficient of determination R2, i.e.
![]()
where X(l) denotes the initial set of explanatory variables, from which the variable x(l) is removed.
Before implementing (v+1) step of the procedure (l≤v≤ρ-2) we would have ρ – ν of explanatory variables that remained from the initial set. We denote them as x(v) = (x(j1),…,x(jp-v))T. Then on the (v+ 1) step we will exclude the variable xˆ+1' whose removal results in a minimum decrease in the value of R2 (y; (x(j1),…,x(jp-v))), i.e.
![]()
where x(v)(l) denotes the set of explanatory variables x(v) from which the variable x(l) is excluded.
Usually, the procedure of successive elimination is carried out till the step, after which the next removal of the variable leads to a statistically significant decrease in the value of the coefficient of determination R2.
Note that there may be situations where the initial statistics
are regression-heterogeneous (in the sense of the criterion of Chow, see [Айвазян, 2010], i.e. the values of regression coefficients θ̂j(t) vary statistically significant during the transition from one value t to another one, but the procedure to identify the most important particular criteria in our problems gave, however, as a rule, the same result for different points in time t.
It is possible to summarize the above procedure in relation to cases when learning was presented in the form of (i) or (ii).
b) Selection of the most important particular criteria in the absence of learning. Methodological scheme that the total basic idea relies upon is as follows.
| 1. | Analysis of multicollinearity of partial criteria of a priori set of indicators. With above goal in mind, we calculate for the variables of each a priori set the following:
|
||||
| Analysis of the numerical characteristics allows us to have a preliminary step to identify closely related pairs, triples, etc. groups of variables, and raise the question of selection of one representative from each group. The other evidence that also points to the necessity of reduction of each of the sets of a priori of particular criteria is the fact that the values of the vast majority of the above coefficients of determination R2 are close to 1 (see examples of the results of calculations based on this scheme in A2.4). | |||||
| 2. | The selection of the most informative particular criteria among the indicators of a priori set for each of the integral property. Let's say we are given a quantitative content (p′) of the reduced set of indicators of the specific integral property (p′ < p). A set of partial criteria
|
Note. Selection of the most significant particular criteria both in the presence of learning and without it is based on solving the corresponding optimization problems. In order to leave the possibility of taking into the account the informative (and not just formal) considerations, it is proposed along with the optimum composition of the posterior set of variables to also display a so-called near optimum compositions, i.e. such sets of a predetermined number of variables that the value of the optimized criterion for them differs very little (statistically insignificant) from the optimum. Then we can make the final choice of the composition of the posterior set of particular criteria (from the options provided by the “optimum” and “near optimum” sets) based mainly on the informative (or meaningful) considerations. I would have recommended the above remark be considered for the general case by including it in the description of the procedures contained in the statistical and econometric packages (SPSS, Ε-views, STATA, etc.)
2.3.5. Building ii qol with the presence of learning (expert-statistical method)
| 1. | 1. | II QOL at the presence of score based form of learning (see the above form (i))3. In this case, the task of building II QOL comes to statistical estimation of the regression function (convolution) ƒ (X) in model (2.1) based on the initial data of the following type
|
i.e. it comes to the standard problem of regression analysis. So if we limit the scope of our search of convolution to parametric family {(f(X;Θ)}, then
![]()
where the “weighing” coefficients ![]() are determined by two factors:
are determined by two factors:
| – | relative competence of the experts (the dependence on j); |
| – | relative importance of the analysed objects or the relative reproducibility (exactness) of expert assessments for each of the objects (the dependence on i). |
One of the possible methods of determining the coefficients ![]() is a factorization of their values using the formula
is a factorization of their values using the formula
![]()
where
![]()
and
![]()
Obviously, the value ![]() characterizes the “fuzziness” in the accuracy of the expert evaluation of i-th object, and the value
characterizes the “fuzziness” in the accuracy of the expert evaluation of i-th object, and the value ![]() is a measure of deviation in estimates of the j-th expert from the opinion of the general group.
is a measure of deviation in estimates of the j-th expert from the opinion of the general group.
In the case of a single (group) variant of expert estimation, i.e. when we have data in the form of
![]()
the II QOL we are seeking will be determined as the solution to the problem
![]()
where in the absence of information about the relative importance of the objects it is considered that ![]() .
.
Software implementation of the solutions to the problems (2.6) and (2.6') carried out by an ordinary or generalized (weighted) method of the least squares the reader can find in any of the integrated statistical (econometric) software packages (SPSS, Statistica, E-views, etc.).
Note on choosing the general form of II QOL. The choice of a parametric family {ƒ(X;Θ)}, as a rule, cannot be backed up by strict theoretical foundation. After all the scalar characteristic of the analysed quality may not exist (see above point (c) at the beginning of this chapter), so in this case we are dealing with some approximation that has conventional meaning within a limited period of time and under certain conditions. Therefore, exploiting the idea of expanding any function into a Taylor series, we usually limit ourselves to linear or quadratic approximation of the desired convolution, i.e.
![]()
or
![]()
Note that when specifying the problem we can often fill the coefficients θk and θkl with real socio-economic sense [Слуцкий, 1963].
| 2. | Construction of II QOL in the presence of expert rankings of the objects based on the analysed synthetic category (see above, form (ii)). In this case, we have the data in the form of |
![]()
where Rijst – rank (place) assigned to the i-th object by j-th expert in a row of n inspected objects, who ordered them based on the analysed synthetic QOL category (in order from best to worst). If we had already have II QOL in the form of f (X;Θ) (i.e. we had have known the value of a vector parameter Θ), then using the values of Xi = (i = 1,2, …, n) for j (X;Θ) and calculating the corresponding values of fi = j(¾Θ), we could get the ordering of the objects according to the values fi, i.e. ranks Ri(Θ)(i = 1,2, … , n), which, of course, would L depend on the values of the parameters Θ.
But then we can compare the consistency of this ordering with the ordering of each (j-th) of the experts with the help of, for example, the Spearman rank correlation coefficient:
![]()
In the presence of so-called connected ranks we should use the appropriate modification of the above formula [Айвазян, 2010; point 3.3.4].
It would be natural to “set up” the value of the parameters Θ on expert training, maximizing the consistency of ranking that is based on II QOL j (X; Θ) with rankings of experts. This can be done, for example, by solving one of two problems:
![]()
or
![]()
where q1 q2, … , qm – non-negative weights, proportional to the level of expertise of involved experts (in particular q1 = q2 = … = qm = l), and r(Θ) – coefficient of Spearman's rank correlation between the ranking of the objects that is based on II QOL f(X;Θ), and a single (group) version of expert ordering of the same objects.
Note on weighting coefficients qj. As one of the possible ways to determine the weighting coefficients qj(j = 1,2, … , m) we can recommend a method based on conditional comparative assessment of competence of the j-th expert with the help of values of the coefficients of concordance [Aivazian, 2010, point 3.3.7]
![]()
![]()
Assuming that the more the coefficient of concordance increases in the rankings of experts W when we exclude the expert with number j from our group of experts (i.e. the greater than the difference Wj-(m-l)-W(m)), the less competent that expert is, and the values qj can be calculated, for example, by the following formula:
![]()
Note on the evaluation of the group version of expert ordering. Group ordering ![]() is determined as the solution of the optimization problem
is determined as the solution of the optimization problem
![]()
It is known that the solution of this problem is given by the median values of a row (Ri1st., Ri2st., Rimst.).
Unfortunately, in terms of computational realization the problems (2.7) and (2.7') are very complex and have no standard software. However, there is a special variant of this problem that gives us a formulation of it with ranking, in which both the expert task and the task of computing implementation are simplified. In this variant, experts are invited to divide multiple objects (in our case, the territories) into small number of classes (groups) sorted by analysed synthetic category of QOL. Therein, it does not allow any preference between the objects belonging to any one group. Obviously, such a partition can be formally represented in the form of (ii), in which there is a large number of “connected” (i.e. indistinguishable) ranks. So, in the end, we have data of the following type
![]()
where zi is the number of the class to which the object is assigned by a single (group) expert partitioning of the objects into classes4 (we assume that the total number of classes is equal k, and that the higher the class number, the higher the quality of life of the analysed synthetic category). Then the procedure of multicriteria-ordered classification of objects can be obtained as a solution to the standard problem of multiple choice with an ordinal dependent variable in the form of, for example, the corresponding logit model. In the course of the procedure [Айвазян, 2010, Paragraph 9.2] x(1), x(2), … , x(p) are latent variables, which in this case play the role of II QOL.
Let us briefly recall the general scheme of the implementation of this procedure. So, let the random variable Z take the values 1,2, … , k (according to the number of analysed ordered groups) and that the higher the number of the group that owns the region i, the higher the quality of the analysed synthetic category of this region. Since this quality is mainly determined by the values of the partial criteria, it is natural to assume that there is a latent variable in the form of a linear combination
![]()
and threshold values c0, c1 … , ck, such that
![]()
The parameters W = (w1 w2, … , wp)T of the linear form (2.9) as well as the thresholds c0, c1 … , ck, are subject to statistical estimation according to available data (2.7').
Postulating a linear or logistic form of the distribution F(u) of residues ein the ratio (2.9) and the mutual independence of these residues εi (with Eεi = 0 and Dεi = 1, which doesn't limit the generality of the model), we obtain the following expression for the likelihood function:
![]()
Maximizing the right side (2.10) on w1 …, wp; c0, c1, … , ck, we obtain estimates W and ĉ0, ĉ1, … , ĉk for the unknown parameters. Appropriate computational procedures are implemented in standard software packages (SPSS, Ε-views, etc.).
Note: Normally, without loss of generality, it is believed that: c0 = -∞ and ck = +∞.
| 3. | Building of II QOL in the presence of expert pair-wise comparisons of objects by analysed synthetic category (see above, Form (iii)). In this case we have learning in the form of matrices Γst(j)(j = 1,2,…, m). There are different approaches to solving the problem of building an integral indicator based on the data of the following type
|
see, for example, “the method of voting” proposed by Y. Zhuravlev, or a method based on a linear programming [Айвазян, 1974; Киселев, 1980]. However, given the specificity of the tasks of inter-regional multicriteria analysis of QOL, the most appropriate thing to do is to use the opportunity to fit case into the schemes described in the previous paragraph, i.e. the schemes based on the results of the expert ranking of objects (territories), including in the form of dividing them into a small number of ordered classes.
For this purpose it is sufficient for each (i-th) object to calculate its characteristic of preference γ; from the formula
![]()
and then rank the objects in descending order of their characteristics. The transition to a variant of the dividing the objects into a small number of ordered classes is done by simple aggregation of objects with relatively similar values yi, i.e. by solving a simple one-dimensional problem of cluster analysis.
2.3.6. Construction of ii qol in the absense of learning
In this formulation of the problem we only have the unified value of particular criteria of a posteriori set
![]()
i.e. we do not have any information on the comparison of the objects (territories) by analysed synthetic category. The question arises:
Is it right in such a situation to set a task of measuring the analysed latent synthetic category using convolutions of particular criteria?
Conditionally positive answer to this question is based on the following logic:
| (a) | The analysed synthetic category is adequately characterized by standardized values of particular criteria |
| (b) | If we want to limit ourselves to only one (i.e. scalar) aggregate indicator (integrated indicator) of the given synthetic category, then it is natural to look for a such an indicator ŷ amongst all the other latent indicators that would have the following property: among all scalar variables that characterize the analysed latent synthetic category, it is this indicator ŷ that can be most accurately (in a sense) used to restore the values of all the particular criteria of the a posteriori set, using for that the appropriate model of pair-wise regression. |
But if you limit the view of the desired convolution by class of linear functions (i.e. to build II QOL in the form of ![]() , it is precisely this property (b), that the first principal component built on particular criteria (2.12) of a posteriori set has, as it is known [Айвазян, Мхитарян, 2001, п. 13.2.5].
, it is precisely this property (b), that the first principal component built on particular criteria (2.12) of a posteriori set has, as it is known [Айвазян, Мхитарян, 2001, п. 13.2.5].
But there is another question:
Is it always enough when only one convolution of particular criteria, even if it is best in the sense of property (b), is used for solving the problem of recovering the values of all particular criteria of a posteriori set by using the values of this convolution with satisfactory accuracy, and if not, what is the minimum dimension of the corresponding multicriteria scheme? That is, if using one convolution is not enough then how many of such convolutions should we use and how should we build them?
After all, there are situations where there is no satisfactory solution of the problem of building a scalar indicator of analysed integral category of QOL. These situations happen in particular when considered set of particular criteria has a certain number of mutually weakly correlated variables, although each of them makes a significant contribution to the description and interpretation of the analysed integral category of QOL.
Then the problem of approximation (with reasonable accuracy) of the values of all particular criteria while using a single scalar value of the indicator may not have a satisfactory solution, even though this scalar indicator is relatively the best predictor in this approximation scheme.
And then there is the question of determining the minimum dimension k < p of the multicriteria space within which it is possible to find a satisfactory solution to problems of rating and typology of objects (countries, regions) on the analysed synthetic category. This section of the book offers an approach to finding answers to the above questions.
The overall logical scheme of the proposed approach involves four main stages of the research. At the first stage, we solve the question of determining the minimum dimension k of the space of integral indicators, sufficient to restore (from the values of these II) with acceptable accuracy the standardized values of all particular criteria of a posteriori set. The criterion of informativeness that is used for that is based on the ideology of factor analysis, in particular, on the known properties of the principal components.
At the second stage (which is necessary only in case of k > l), with the help of special methods of analysing the structure of correlations between particular criteria of a posteriori set, this set is divided into k subsets (blocks) so that each of the resulting subsets of particular criteria serves as an informational base for building of one of k sought integral criteria.
At the third stage, the particular criteria of each of identified at the previous stages subsets fold linearly so that when using the obtained liner convolution we can predict reliably (within the linear model of pair-wise regression), the value of each of the particular criteria of the subset.
Finally, the fourth stage (which is the same as the second, is necessary only in case of k > l) is dedicated to building a single (composite) integral indicator in the form of a some non-linear convolution of k indicators built at the previous step.
We now describe each of these steps in more detail.
Step 1: Determining the number of integrated indicators needed to characterize the analysed synthetic category. First, let's clarify in what sense we understand the accuracy of reconstruction of standardized values of particular criteria ![]() of the specified a posteriori set on the values k (1 ≤ k < p) of auxiliary (integrated) indicators y(1), y(2), … …, y(k).
of the specified a posteriori set on the values k (1 ≤ k < p) of auxiliary (integrated) indicators y(1), y(2), … …, y(k).
With this goal in mind let's investigate the linear regression of the type
![]()
where Y = (l,y(1), y(2), … , y(k))T, bj(Y) = (bj.0(Y), bj.1(Y), … , bj.k(Y)) are coefficients of regression ![]() on Y, and ε(j)(y) are regression residues in classical linear regression model (2.13).
on Y, and ε(j)(y) are regression residues in classical linear regression model (2.13).
We are saying that/c of integrated indicators ![]() provide the best accuracy of reconstruction of the values ρ of the variables
provide the best accuracy of reconstruction of the values ρ of the variables ![]() if
if
![]()
So, it is known [Aivazian, Mkhitaryan, 2001, point 13.2.5] that this exact property is possessed by the first k of principal components built on the variables ![]()
(i.e. ![]() is itself the first k of principal components), and the right-hand side (2.14) can be expressed in terms of the ratio
is itself the first k of principal components), and the right-hand side (2.14) can be expressed in terms of the ratio ![]() , where λ1,λ2,…, λp – the eigenvalues of the covariance matrix
, where λ1,λ2,…, λp – the eigenvalues of the covariance matrix ![]() of the vector
of the vector ![]() positioned in descending order (non-increasing).
positioned in descending order (non-increasing).
Our criterion for determining the minimum number k of integrated indicators that are necessary for the characterization of analysed synthetic categories is based on these very facts. In particular, it is suggested to determine k from the condition:
![]()
where q0 is some number (more than 0.5), the specific value of which depends on the desired accuracy of reconstruction of values ![]() based on the values
based on the values ![]() and on the type of the correlation matrix of vector
and on the type of the correlation matrix of vector ![]() .
.
The empirical implementation of the rule (2.15) requires:
| – | evaluation
|
| – | calculation of the eigenvalues λ1,λ2,…, λp of the matrix |