
NOTHING HELPS YOU ORGANIZE INFORMATION LIKE A TABLE. Whether you’re working with numbers in an annual report, combining pictures and text for a catalog, or just arranging pictures, QuarkXPress tables make the process easy. First, you can enter table information directly into QuarkXPress, convert text to tables, and work with Microsoft Excel files. Once the information is in a table, you have precise control over its placement and background along with row, column, cell, and gridline formatting.
As tables are adjusted, you can add and remove rows and columns, combine cells, continue tables across pages, and specify automatic headers and footers. Tables are flexible items that can be converted to grouped items and converted back to text as necessary. All the standard QuarkXPress item and content formatting options are available to tables.
In this chapter you’ll learn how to create tables, work with Excel data, add content to tables, edit and format table text, format tables themselves, position tables on the page, continue tables across pages with headers and footers, and more.
QuarkXPress provides a variety of methods for creating tables. In some cases, you won’t need an “official” QuarkXPress table at all—you might design your own table with tabs, rules above and below paragraphs, and lines. You will find, however, that these “fake” tables are difficult to adjust as the information and design changes. A QuarkXPress table is much more flexible. The method you choose for creating a table depends on the source of the table information.
![]() Create a new table: If you’re entering information from hard copy, flowing text through linked cells, or importing pictures into cells, create a new table with the Table tool.
Create a new table: If you’re entering information from hard copy, flowing text through linked cells, or importing pictures into cells, create a new table with the Table tool.
![]() Convert text to a table: If the table consists of text that is already delimited (divided by tabs and paragraph returns, for example), you can convert the text to a table.
Convert text to a table: If the table consists of text that is already delimited (divided by tabs and paragraph returns, for example), you can convert the text to a table.
![]() Import or paste from Excel: If the information exists in an Excel table or chart, you’ll need to decide whether to import it into a new table, copy and paste the information, or import a chart.
Import or paste from Excel: If the information exists in an Excel table or chart, you’ll need to decide whether to import it into a new table, copy and paste the information, or import a chart.
If you need to enter information into a table in QuarkXPress—including entering text in individual cells, flowing text through linked cells, and importing pictures—create a new table. Note that if text is delimited in some way (with tabs indicating columns, for example), a better option is to import the text into a text box, then convert it to a table. To create a table:
1. Select the Table tool ![]() on the Tools palette. You can press G to select it (unless the Text Content tool is selected).
on the Tools palette. You can press G to select it (unless the Text Content tool is selected).
2. Click and drag to draw a rectangle that is roughly the size of the final table; press Shift to constrain the rectangle to a square.
3. Release the mouse button to display the Table Properties dialog box and set up the table (Figure 6.1).
Figure 6.1: Use the Table Properties dialog box to specify the number of rows, number of columns, cell type, and more.

4. Enter the initial number of rows and columns based on your table data. You can add and remove rows and columns later as necessary.
5. Click OK to create the table. QuarkXPress calculates the row and column sizes according to the size of the table.
The remaining options in the Table Properties dialog box rarely need to be changed. If you need to change them, they work as follows:
![]() Story Direction controls whether text flows horizontally across the cell or vertically down it. For English text, this is generally set to Horizontal.
Story Direction controls whether text flows horizontally across the cell or vertically down it. For English text, this is generally set to Horizontal.
![]() Cell Type lets you create text cells or picture cells. Since cells can contain either text or pictures just like boxes, this setting doesn’t matter much. The only difference is that if you click Picture Cells, you cannot link the cells.
Cell Type lets you create text cells or picture cells. Since cells can contain either text or pictures just like boxes, this setting doesn’t matter much. The only difference is that if you click Picture Cells, you cannot link the cells.
![]() Table Direction, Tab Order, and Link Order all control how you jump from text cell to text cell (when you press Control+Tab) and how text flows through linked text cells.
Table Direction, Tab Order, and Link Order all control how you jump from text cell to text cell (when you press Control+Tab) and how text flows through linked text cells.
![]() Auto Fit lets you create text cells that expand as you add text. Check Rows to increase row height to accommodate text; check Columns to increase cell width. When both are checked, maximum values specified in the Cell pane of the Modify dialog box (Item menu) control how much the cells can expand. (When Maintain Geometry is checked, the Auto Fit controls are disabled.)
Auto Fit lets you create text cells that expand as you add text. Check Rows to increase row height to accommodate text; check Columns to increase cell width. When both are checked, maximum values specified in the Cell pane of the Modify dialog box (Item menu) control how much the cells can expand. (When Maintain Geometry is checked, the Auto Fit controls are disabled.)
![]() Check Link Cells to link all the text cells so imported text flows through them. (Again, if text is already delimited, it’s better to convert the text to a table.) You can also link individual cells later with the Text Linking tool.
Check Link Cells to link all the text cells so imported text flows through them. (Again, if text is already delimited, it’s better to convert the text to a table.) You can also link individual cells later with the Text Linking tool.
![]() Check Maintain Geometry to keep the size of the table consistent when the number of rows and columns changes. When this is checked, the row height and column width adjust rather than the table size.
Check Maintain Geometry to keep the size of the table consistent when the number of rows and columns changes. When this is checked, the row height and column width adjust rather than the table size.
![]() To import an Excel spreadsheet, check Link to External Data. This disables the Rows and Columns fields, as those will be determined by the data in Excel.
To import an Excel spreadsheet, check Link to External Data. This disables the Rows and Columns fields, as those will be determined by the data in Excel.
You can convert text that contains delimiters—invisible characters that indicate the difference between rows and columns—into a QuarkXPress table. Generally, the delimiters consist of tab characters between columns and paragraph returns between rows, since that is how information is often entered into Microsoft Word (Figure 6.2). In fact, if you import a Word table into a QuarkXPress text box, the text is imported with tab and paragraph return delimiters. The keys to successfully converting text to a table are first identifying the delimiter characters and then ensuring that they are used consistently.
Figure 6.2: Delimited text prepared in Microsoft Word shows a paragraph return at the end of each row and only one tab character between each column.

1. Import or type the text into a text box.
2. Choose View > Invisibles to display the delimiters and determine how the information is currently separated. If necessary, remove any extra characters (such as two tabs rather than one) and add any missing ones.
3. Using the Text Content tool ![]() , select the text to convert to a table.
, select the text to convert to a table.
4. Choose Table > Convert Text to Table. Confirm the settings in the Convert Text to Table dialog box (Figure 6.3) and click OK.
Figure 6.3: The Convert Text to Table dialog box is where you can control how data is divided into rows and columns, the order in which cells are filled, and whether you want to automatically fit the rows and columns to the text.

5. The new table is placed on top of the text box containing the original text (Figure 6.4). If you converted all the text in the box, you can delete the source text box.

The options in the Convert Text to Table dialog box work as follows:
![]() The Separate Rows With and Separate Columns With menus indicate the delimiters used in the text.
The Separate Rows With and Separate Columns With menus indicate the delimiters used in the text.
![]() The Rows and Columns values indicate the number of rows and columns needed to contain the selected text. You can increase these values to add placeholder rows and columns. Note that if the Rows and Columns numbers look way off, you may need to click Cancel and check the delimiters in the selected text again.
The Rows and Columns values indicate the number of rows and columns needed to contain the selected text. You can increase these values to add placeholder rows and columns. Note that if the Rows and Columns numbers look way off, you may need to click Cancel and check the delimiters in the selected text again.
![]() The Cell Fill Order controls the order in which the text fills the table cells. The default (left to right, from the top down) is appropriate for most U.S. English text. You might choose another option for a different language or if you want to display information in a different order (for example, list prices from lowest to highest rather than highest to lowest).
The Cell Fill Order controls the order in which the text fills the table cells. The default (left to right, from the top down) is appropriate for most U.S. English text. You might choose another option for a different language or if you want to display information in a different order (for example, list prices from lowest to highest rather than highest to lowest).
![]() When you convert text to a table, the rows and columns are automatically sized to contain all the selected text. The Auto Fit controls let you specify that row and column sizes continue to expand as necessary to contain text as it is edited and formatted.
When you convert text to a table, the rows and columns are automatically sized to contain all the selected text. The Auto Fit controls let you specify that row and column sizes continue to expand as necessary to contain text as it is edited and formatted.
You have three options for working with information from Microsoft Excel: Copy and paste delimited data, link to a spreadsheet, or import a chart as a picture.
![]() Copy and paste: QuarkXPress can quickly create a table for you based on information copied from an Excel spreadsheet. The table data, however, is not linked to the Excel spreadsheet and will not update. To do this, copy rows and columns from a spreadsheet in Excel. Switch to QuarkXPress, and paste the information into a text box. A table is created automatically.
Copy and paste: QuarkXPress can quickly create a table for you based on information copied from an Excel spreadsheet. The table data, however, is not linked to the Excel spreadsheet and will not update. To do this, copy rows and columns from a spreadsheet in Excel. Switch to QuarkXPress, and paste the information into a text box. A table is created automatically.
![]() Link to Excel: You can link a newly created table to an Excel spreadsheet, then update the table as the data in Excel changes (through Utilities > Usage > Tables). When you update table data, however, text formatting applied in QuarkXPress is not maintained and other adjustments may occur. To link to a spreadsheet, create a table with the Table tool, then check Link to External Data in the Table Properties dialog box. Browse to the spreadsheet, select the sheet you want to import, and set the import options (Figure 6.5).
Link to Excel: You can link a newly created table to an Excel spreadsheet, then update the table as the data in Excel changes (through Utilities > Usage > Tables). When you update table data, however, text formatting applied in QuarkXPress is not maintained and other adjustments may occur. To link to a spreadsheet, create a table with the Table tool, then check Link to External Data in the Table Properties dialog box. Browse to the spreadsheet, select the sheet you want to import, and set the import options (Figure 6.5).

![]() Importing charts: Charts inserted into Excel (through Insert > Chart or Insert > Picture) can be imported into QuarkXPress as pictures. The disadvantage to this method is that most graphic designers prefer more sophisticated chart designs than those used for utilitarian spreadsheet purposes. To import a chart, choose File > Import, select the Excel file, and use the Chart pane to select the chart to import. If the chart changes, you can update through Utilities > Usage > Pictures.
Importing charts: Charts inserted into Excel (through Insert > Chart or Insert > Picture) can be imported into QuarkXPress as pictures. The disadvantage to this method is that most graphic designers prefer more sophisticated chart designs than those used for utilitarian spreadsheet purposes. To import a chart, choose File > Import, select the Excel file, and use the Chart pane to select the chart to import. If the chart changes, you can update through Utilities > Usage > Pictures.
Understanding the components of a QuarkXPress table will help you remember which tools to use while working with them. A table is an item—so you make adjustments to its size, placement, background, and frame by selecting it with the Item tool ![]() . The rows, columns, and cells in a table, however, are all treated as contents—so you make adjustments with commands in the Table menu, the Text Content tool
. The rows, columns, and cells in a table, however, are all treated as contents—so you make adjustments with commands in the Table menu, the Text Content tool ![]() , or the Picture Content tool
, or the Picture Content tool ![]() . Table cells are essentially mini boxes that can contain text boxes or pictures.
. Table cells are essentially mini boxes that can contain text boxes or pictures.
Table cells are essentially boxes that can contain text or a picture. To add contents to empty cells, you can type text into them, paste text or pictures into them, or import text or pictures through File > Import or drag and drop from the desktop. A few notes about adding text:
![]() When typing text into table cells, press Control+Tab to jump to the next cell or Control+Shift+Tab to jump to the previous cell.
When typing text into table cells, press Control+Tab to jump to the next cell or Control+Shift+Tab to jump to the previous cell.
![]() You can import text into an individual cell or a series of linked cells. You can specify linked cells in the Table Properties dialog box when you create a new table or you can link individual cells using the Text Linking tool.
You can import text into an individual cell or a series of linked cells. You can specify linked cells in the Table Properties dialog box when you create a new table or you can link individual cells using the Text Linking tool.
![]() When working with linked cells, use the Next Column character (Enter on the keypad) to force text to the next linked cell.
When working with linked cells, use the Next Column character (Enter on the keypad) to force text to the next linked cell.
If you are working with delimited text—such as tabular data—use Table > Convert Text to Table rather than manually adding all the text to table cells.
To edit and format table text, always use the Text Content tool ![]() . In general, you make text selections, edit text, and format text the same way you do when working with text in boxes. In addition, you can position text within cells and link text cells as if you were working with text boxes.
. In general, you make text selections, edit text, and format text the same way you do when working with text in boxes. In addition, you can position text within cells and link text cells as if you were working with text boxes.
When working with text in table cells, select it; cut, copy, and paste it; and navigate through it with the arrow keys as you do when working with text in boxes. When working with table text:
![]() Press the arrow keys on the keyboard to move the text insertion point within cells and from cell to cell.
Press the arrow keys on the keyboard to move the text insertion point within cells and from cell to cell.
![]() Click and drag the Text Content tool to select text in multiple, adjacent cells.
Click and drag the Text Content tool to select text in multiple, adjacent cells.
![]() Click the edges of a table with the Text Content tool to select all the text in a row or column (Figure 6.6). Click and drag to select multiple rows or columns; Shift+click to select noncontinuous rows or columns. Note that the table must already be selected.
Click the edges of a table with the Text Content tool to select all the text in a row or column (Figure 6.6). Click and drag to select multiple rows or columns; Shift+click to select noncontinuous rows or columns. Note that the table must already be selected.
![]() Choose options from the Select submenu of the Table menu to make other helpful text selections: Cell, Row, Odd Rows, Even Rows, Column, Odd Columns, Even Columns, All Cells, Header Rows, Footer Rows, and Body Rows.
Choose options from the Select submenu of the Table menu to make other helpful text selections: Cell, Row, Odd Rows, Even Rows, Column, Odd Columns, Even Columns, All Cells, Header Rows, Footer Rows, and Body Rows.
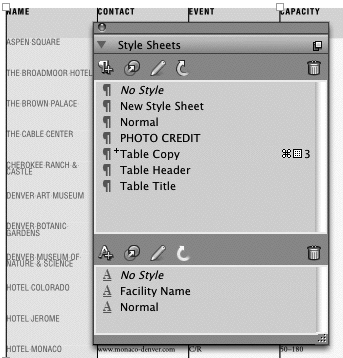
When text in table cells is selected, you can format it the same way you format any other text—using options in the Style menu, the Measurements palette, and the Style Sheets palette (Figure 6.7).
To precisely position text within selected table cells, you can specify all the same options that are available for text boxes. These include text inset and vertical alignment, one of which you will probably need to change to prevent the text from touching the cell’s gridlines (Figure 6.8). You might change the angle of text within a cell to create vertical row labels. The Text pane of the Measurements palette and Modify dialog box (Item menu) provide controls for positioning text within table cells (Figure 6.9). For consistent positioning, be sure to select all the cells in a table.


You can link table cells so text flows through them—although you are not likely to do this often as the data in a cell is often self-contained. To link cells:
![]() Use the Text Linking tool and Text Unlinking tool to create and break links (respectively) between text cells in a table.
Use the Text Linking tool and Text Unlinking tool to create and break links (respectively) between text cells in a table.
![]() Check Link Cells in the Table Properties dialog box when you create the table; this links all the cells in the table.
Check Link Cells in the Table Properties dialog box when you create the table; this links all the cells in the table.
![]() Choose Table > Link Text Cells to link selected cells in a table. As with linking text boxes, only the first cell can contain text when you link cells. That text will flow through the linked cells.
Choose Table > Link Text Cells to link selected cells in a table. As with linking text boxes, only the first cell can contain text when you link cells. That text will flow through the linked cells.
Table formats come in three flavors—formats that apply to the entire table such as its frame and background, formats that apply to all or selected gridlines, and formats that apply to all or selected cells. By combining all these formats along with paragraph and character attributes, you can create an attractive, easy-to-read table. To format an entire table, select it with the Item tool ![]() . To format gridlines, rows, columns, and cells, select them with the Text Content tool
. To format gridlines, rows, columns, and cells, select them with the Text Content tool ![]() .
.
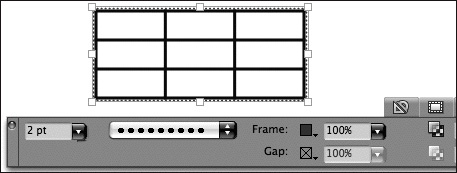
To place a frame (otherwise known as a stroke) outside the edges of a table, select the table with the Item tool. You can then use the Frame tab of the Measurements palette or Modify dialog box (Item menu) to specify the width, style, and color of the frame (Figure 6.10).
A table can have a single background color, blend, or picture. In order for the background to display, the table’s cells need to have a transparent background.
![]() Background color: To specify a background color for a table, first select all the cells and make sure they have a transparent background (Item > Modify > Cells > Opacity > [less than 100%]). Then, select the table with the Item tool and specify the color, shade, and opacity in the Table tab of the Measurements palette or Modify dialog box (Item menu).
Background color: To specify a background color for a table, first select all the cells and make sure they have a transparent background (Item > Modify > Cells > Opacity > [less than 100%]). Then, select the table with the Item tool and specify the color, shade, and opacity in the Table tab of the Measurements palette or Modify dialog box (Item menu).
![]() Background picture: To use a picture for a table background, place the table on top of the picture. Then, be sure the table background and the table cells are transparent (Item > Modify > Table/Cells tab > Opacity > [less than 100%]).
Background picture: To use a picture for a table background, place the table on top of the picture. Then, be sure the table background and the table cells are transparent (Item > Modify > Table/Cells tab > Opacity > [less than 100%]).
The lines between rows and columns are called gridlines, and they can be formatted with a specified width, style, and color like any other line in QuarkXPress. To select gridlines for formatting:
![]() Click the Text Content tool
Click the Text Content tool ![]() to select a single gridline; Shift+click to select multiple gridlines.
to select a single gridline; Shift+click to select multiple gridlines.
![]() Choose an option from the Table > Select submenu: Horizontal Grids, Vertical Grids, Border, or All Grids.
Choose an option from the Table > Select submenu: Horizontal Grids, Vertical Grids, Border, or All Grids.
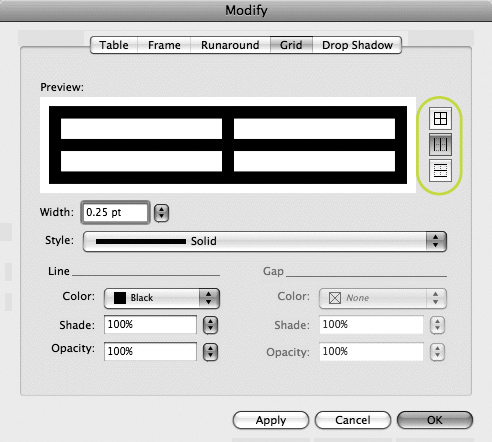
![]() Select the table with the Item tool, then click the selection buttons in the Grid tab of the Modify dialog box (Item menu): Select All, Select Vertical, or Select Horizontal.
Select the table with the Item tool, then click the selection buttons in the Grid tab of the Modify dialog box (Item menu): Select All, Select Vertical, or Select Horizontal.
Once gridlines are selected, you can make changes to them in the Table Grid tab of the Measurements palette or the Grid tab of the Modify dialog box (Item menu). See Figures 6.11–6.12.
You can format cells—and entire rows and columns of cells—with the same background color, shade, opacity, and blend options as boxes. For readability, every other row or every other column of a table is often formatted differently. The key to formatting cells is selecting them:
![]() Individual cell: Click the Text Content tool
Individual cell: Click the Text Content tool ![]() to select a cell.
to select a cell.
![]() All cells: Click in a table and choose Table > Select > All Cells.
All cells: Click in a table and choose Table > Select > All Cells.
![]() Individual row or column: Click the Text Content tool outside a selected table. Or click in a cell and choose Table > Select > Row or Table > Select > Column.
Individual row or column: Click the Text Content tool outside a selected table. Or click in a cell and choose Table > Select > Row or Table > Select > Column.
![]() Adjacent rows or columns: Drag the Text Content tool along the edge of a selected table.
Adjacent rows or columns: Drag the Text Content tool along the edge of a selected table.
![]() Noncontinuous rows or columns: Shift+click the Text Content tool along the edge of a selected table.
Noncontinuous rows or columns: Shift+click the Text Content tool along the edge of a selected table.
![]() Pattern of rows or columns: Choose Table > Select > Odd Rows, Even Rows, Odd Columns, or Even Columns. If you’re working with header rows and footer rows in a continued table, you can also choose Header Rows, Footer Rows, or Body Rows (Figure 6.13).
Pattern of rows or columns: Choose Table > Select > Odd Rows, Even Rows, Odd Columns, or Even Columns. If you’re working with header rows and footer rows in a continued table, you can also choose Header Rows, Footer Rows, or Body Rows (Figure 6.13).
Figure 6.13: The Table > Select submenu lets you select a pattern of rows or columns for formatting.

Once cells are selected, you can change the background in the Classic tab of the Measurements palette or the Cells tab of the Modify dialog box (Item menu). See Figure 6.14.
You can place a table anywhere you want on the page the same way you position other items. Select the table with the Item tool ![]() and drag it, enter X and Y values in the Classic tab of the Measurements palette, or enter Origin Across and Origin Down values in the Table tab of the Modify dialog box (Item menu). You can also rotate the table using the Item tool or by entering a value in an Angle field (Figure 6.15).
and drag it, enter X and Y values in the Classic tab of the Measurements palette, or enter Origin Across and Origin Down values in the Table tab of the Modify dialog box (Item menu). You can also rotate the table using the Item tool or by entering a value in an Angle field (Figure 6.15).

As information changes, you may need to make adjustments to a table such as changing its size, adding or removing rows or columns, and merging cells. You can do all these things plus precisely control column width and row height.
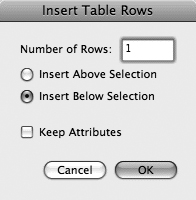
You can insert a row above or below the selected row, and you can insert a column to the left or right of the selected column. To select a row or column, click in a cell with the Text Content tool ![]() . Then, choose Table > Insert > Row or Table > Insert > Column. Specify the number of rows or columns to insert and the location (Figure 6.16). You can check Keep Attributes to insert rows or columns with the same background and gridline formatting as the selected row or column.
. Then, choose Table > Insert > Row or Table > Insert > Column. Specify the number of rows or columns to insert and the location (Figure 6.16). You can check Keep Attributes to insert rows or columns with the same background and gridline formatting as the selected row or column.
If you no longer need certain rows or columns, you can delete them. First, select the rows or columns to delete using the Text Content tool ![]() or the Table > Select submenu. Then, choose Table > Delete > Row or Table > Delete > Column. Table contents are deleted as well—except for text that is able to flow into other linked text cells.
or the Table > Select submenu. Then, choose Table > Delete > Row or Table > Delete > Column. Table contents are deleted as well—except for text that is able to flow into other linked text cells.
Cells can be merged and split as necessary to fit your content. You might, for example, merge the cells in a table’s first row to create a heading that spans the table. To select the cells to merge, Shift+click a rectangular area of adjacent cells with the Text Content tool ![]() . Then, choose Table > Combine Cells (Figure 6.17). To restore combined cells to their previous configuration, select a combined cell and choose Table > Split Cells.
. Then, choose Table > Combine Cells (Figure 6.17). To restore combined cells to their previous configuration, select a combined cell and choose Table > Split Cells.

If you prefer fixed table dimensions—that is, you don’t want the dimensions of a table to change when you adjust the number of rows and columns—check Maintain Geometry in the Table menu. You can also check Maintain Geometry in the Table Properties dialog box when you create a table and in the Table tab of the Modify dialog box (Item menu). It’s easier to understand Maintain Geometry in an example: If you add a row to a table for which Maintain Geometry is checked, the height of the other rows is reduced to squeeze in another row; if you add a row in a table for which Maintain Geometry is unchecked, the height of the entire table is increased.
If you’re typing text into table cells, you can use the Auto Fit feature to specify that cells automatically expand to fit all the text. Auto Fit also works when you increase the font size of text in cells. The Auto Fit feature, however, does not work in the opposite direction—cells do not decrease in size as text is deleted or resized. In addition, when you’re working with linked cells, text that doesn’t fit into one cell simply flows into the next cell.
Enable Auto Fit for selected rows or columns in the Cells tab of the Modify dialog box (Item menu) shown in Figure 6.18.
![]() If you want the cell width to expand, check Auto Fit under Column Width and specify a maximum width.
If you want the cell width to expand, check Auto Fit under Column Width and specify a maximum width.
![]() If you want the cell height to expand, check Auto Fit under Row Height and specify a maximum height.
If you want the cell height to expand, check Auto Fit under Row Height and specify a maximum height.
![]() If you enable Auto Fit for both columns and rows, column width expands first.
If you enable Auto Fit for both columns and rows, column width expands first.
![]() Once cells expand to its maximum size, text overflows.
Once cells expand to its maximum size, text overflows.

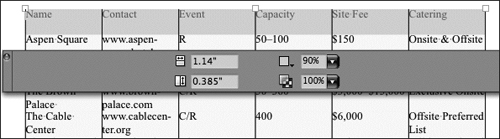
You can resize tables, rows, and columns by entering specific height and width values into fields and by dragging the table or gridlines with the mouse.
![]() Resize a selected table: Enter values in the Width and Height fields in the Table pane of the Modify dialog box (Item menu) or Classic tab of the Measurements palette.
Resize a selected table: Enter values in the Width and Height fields in the Table pane of the Modify dialog box (Item menu) or Classic tab of the Measurements palette.
![]() Resize selected rows and columns: Enter values in the Column Width and Row Height fields in the Cells pane of the Modify dialog box (Item menu).
Resize selected rows and columns: Enter values in the Column Width and Row Height fields in the Cells pane of the Modify dialog box (Item menu).
![]() Distribute selected rows or columns evenly: To create rows or columns of equal size that fit within the selected area, click Distribute Evenly under Column Width or Row Height in the Cells pane of the Modify dialog box.
Distribute selected rows or columns evenly: To create rows or columns of equal size that fit within the selected area, click Distribute Evenly under Column Width or Row Height in the Cells pane of the Modify dialog box.
Using the Text Content tool ![]() , you can drag gridlines to resize rows and columns (Figure 6.19). Using the Item tool
, you can drag gridlines to resize rows and columns (Figure 6.19). Using the Item tool ![]() , you can drag a table handle to resize the table.
, you can drag a table handle to resize the table.

Tip: Resizing Table Elements
When you resize a table with the Item tool, you can press Command (Mac) or Control (Windows) to resize the rows and columns along with the table. Add the Shift key to resize the table, rows, and columns while constraining the shape to a square. To resize the table, rows, and columns proportionally, press Command+Option+Shift (Mac) or Control+Alt+Shift (Windows) as you resize the table.
Tables are not expected to always fit on a single page—or even within a defined space on one page. You can “break” a table and then continue it in another location, which is generally on another page but can be on the same page. After you break a table, you can add automatic header and footer rows to help identify the table contents.
To continue a table in another location, you have to “break” it into segments. Unfortunately, you don’t get to choose when and where the table breaks. Instead, in a nonintuitive process, QuarkXPress breaks the table for you when it gets “too big.” (You do get to define what “too big” means.) If the table gets too small, the table segments are automatically recombined. To break a table:
1. Select the table and choose Table > Table Break.
2. To break the table when it reaches a maximum width, check Width. Enter the maximum width the table can reach before it splits between columns.
3. To break the table when it reaches a maximum height, check Height. Enter the maximum height the table can reach before it splits between rows.
4. To split the table right away, decrease the value in the Width or Height field.
Note that if you leave the maximum Width or Height value at the default setting, which is the current table width and height of the table, nothing happens until you expand the table beyond these values. In general, check Width or Height as table break criteria—not both.
When the table breaks, it splits into two or more linked table segments. You can move the table segments to other locations in the layout (Figure 6.20). Any changes to the table, such as inserted rows or columns, are reflected throughout all the table segments.

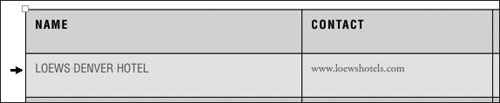
The first row of a table usually contains labels for the columns so you know what’s in them. The last row of a table often provides other useful information. You can automatically repeat and update this information by specifying these rows as official “header” and “footer” rows for a table. You can only specify header and footer rows for a table that has already split because it reached the maximum height specified in the Table Break dialog box.
![]() To specify header rows for a table, select the first row (or several rows) and choose Table > Repeat as Header (Figure 6.21).
To specify header rows for a table, select the first row (or several rows) and choose Table > Repeat as Header (Figure 6.21).
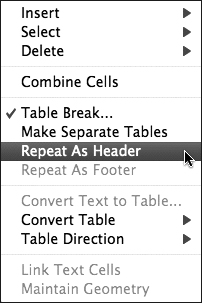
![]() To specify footer rows for a table, select the last row (or several rows) and choose Table > Repeat as Footer.
To specify footer rows for a table, select the last row (or several rows) and choose Table > Repeat as Footer.
![]() The header and footer rows are added to all the table segments, increasing their height and possibly resulting in additional table segments (Figure 6.22).
The header and footer rows are added to all the table segments, increasing their height and possibly resulting in additional table segments (Figure 6.22).
Figure 6.22: In these table segments, the header row labels the columns while the footer row provides a key to the information.

![]() Text in all header and footer rows is automatically synchronized. This means you cannot add words such as “continued from page 1” to the header on the second segment of a table on page 2.
Text in all header and footer rows is automatically synchronized. This means you cannot add words such as “continued from page 1” to the header on the second segment of a table on page 2.
Information in a QuarkXPress table is not stuck there—you can export it as delimited text. The table data is copied out of the cells and placed in a new text box; picture cells are converted to anchored boxes within the text. When you export table data, you will need to decide what order to extract the table data in, the delimit characters (such as tabs and paragraph returns) you want to separate the row and column information with, and whether to delete the source table. To export table data, select the table and choose Table > Convert Table > To Text.
If you want to take apart a table—for example, break up the cells and use them as individual sidebars rather than as a table—you can convert a table to a group. When you do this, each cell becomes an individual text box or a picture box (containing its table contents). To convert a table to a group, choose Table > Convert Table > To Group. (If you still need parts of the table, convert a copy of the table to a group by first choosing Item > Duplicate.) To separate the boxes in the group, choose Item > Ungroup.