2
Benefits of QRM
TO GAUGE THE FORCES AT WORK in the marketplace today, consider what the CEO of a Massachusetts-based high tech electronics company told me in the spring of 1996:
What this senior executive is saying, and many companies have experienced, is that competing on price can be a very slippery slope. Further, it’s all downhill for everyone! Second, he notes that the quality movement has taken a firm foothold in industry and is no longer a significant competitive edge, particularly since customers have become sophisticated in their expectations with regard to quality. A month later, this CEO told me:
Another example is provided by the phenomenal growth of Dell Computer Corporation. Started by Michael Dell in 1984 with $1,000 in savings, Dell grew to sales of $14 million in 1989, and to an amazing $2 billion in 1993. How did Dell manage this?
In searching for the strategy that would eventually propel his company into the stratosphere, Dell found the Achilles heel of the computer sales process. Retailers thought that customers would pay a substantial markup in return for being able to go to a store and touch and feel a machine. But a lot of buyers were old-time users coming back for their second or third machine, quite knowledgeable about what they wanted. More critical was Dell’s amazing responsiveness compared to the retailers.
These two examples-the CEO of the electronics company and the Dell strategy-are critical to our study of QRM because they differentiate QRM from JIT, lean manufacturing, synchronous manufacturing, flow manufacturing, and other recent manufacturing techniques. Most such efforts focus on minimizing the inventory in the system with a relatively stable and predictable demand. However, QRM allows you to focus more and more on individual, customized production, while still maintaining low inventory and fast response. Also, these other initiatives have typically been confined to the shop floor, with only minimal changes in the rest of the company. Yes, some areas such as materials planning were affected, but for the rest of the organization, such as cost estimating, order processing, or engineering, it was “business as usual.” QRM affects the entire organization. No department can conduct business as usual once a QRM program is fully in place.
BENEFITS OF QUICK RESPONSE IN PRODUCT INTRODUCTION
Clearly if your firm’s lead time in bringing new products to market is shorter than that of your competition, you can capture market share while the competition plays catch up with your product (see Figure 2-1). You may even be able to “skim” the market by charging high prices during the period when there is no competing product. All of this can result in excellent profits for your firm.

Figure 2-1.
Beating the Competition to Market
However, what is less frequently appreciated is a different benefit. With a shorter time to market, your firm and its competition can hit the market at the same time with similar products, yet your firm’s product will contain newer technology.
Consider the example in Figure 2-2. There are two firms, one with a four-year time to market, and the other with a two-year time to market. Both firms wish to introduce a new product in 1998, aimed at a similar market niche. However, the second firm is able to start development two years after the first. Most design and manufacturing decisions are cast in concrete in the first 5 percent to 20 percent of the total time to market. As a result, while the first firm locks into 1994 technology, the second firm uses 1996 technology. This includes decisions on materials, controls, manufacturing processes, and manufacturing equipment. As examples of the advantages to the product, the second firm’s product designs could incorporate microprocessor and control technologies that had not been developed in 1994, as well as plastics, composites, and other new materials that also were not available then. It could plan its production based on new injection molding, laser machining, or other processes that were not well developed in 1994. These and other decisions will result in a product that will be perceived by consumers as being more up-to-date and having superior functionality than the first firm’s product. It is also likely to have higher quality and lower cost. All this can result in a very successful product offering.2
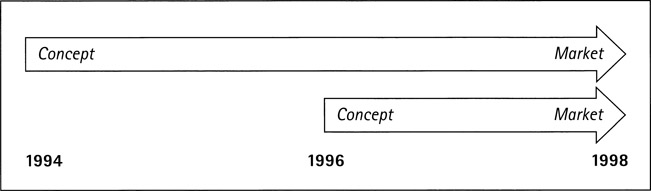
Figure 2-2. Hitting the Market at the Same Time, But with Newer Technology
Another benefit often underestimated in firms that are able to cut their product introduction lead times is that they are able to do this while at the same time using fewer resources for the development and introduction processes. In some cases, firms have cut their lead times in half and used half the number of people3–a fourfold improvement in productivity. Since most of the resources used in product introduction are not accounted for as direct costs, but rather as overhead, this results in a substantial reduction in a firm’s overhead. This is a critical observation as far as the implementation of a QRM program goes, and we’ll return to this point later in the chapter.
BENEFITS OF QUICK RESPONSE IN EXISTING PRODUCTION
The advantages of a short lead time to produce and deliver existing products does not refer only to manufacturing—it includes all the steps from receipt of order to delivery to the customer. Typically this may include activities such as design engineering, process planning, production planning and scheduling, procurement, fabrication, assembly, packaging and shipping.
Again, there are some obvious benefits of quick response. Responding fast to your customers clearly promotes customer satisfaction. There is nothing like a happy customer. If you can fulfill your customers’ needs every time they contact you, there will be little reason for them to go elsewhere. In fact, your performance reputation may assist in taking orders away from your competitors if they are sluggish in their deliveries.
Moreover, if your customer has an urgent need for your product, you might even be able to charge a price premium and further add to your profits. Consider a company that supplies manufacturing equipment and aftermarket parts. Suppose one of its customers’ production machines breaks down, and the customer’s entire production is halted as a result. This customer might be happy to pay a few thousand dollars more for the privilege of getting the needed spare part delivered in 48 hours instead of the standard two weeks. Now you are in the enviable position of having a happy customer who is also paying more.
Although these are good reasons for considering quick response or having your company embark on a QRM program, these short-term reasons are not the key reasons for implementing QRM. Less obvious, but more fundamental, is the fact that implementing QRM improves integration of your whole enterprise and searches for ways of squeezing time out of the whole process, thereby uncovering sources of inefficiency, quality problems, and wasted efforts. As these are eliminated, costs decrease and quality improves. However, this explanation is only the tip of the iceberg. As firms like Beloit Corporation and Ingersoll Cutting Tool Company have discovered, the more an organization gets into QRM, the more opportunities it finds. For instance, an initial study at Ingersoll Cutting Tool seemed to indicate that order processing time could be reduced by just 30 percent, but with deeper exploration, it was found that the reduction could be as much as 70 percent, and finally, the team that was charged with implementation devised ways of achieving a 90 percent reduction in lead time.4 Similarly, the CEO of Northern Telecom stated, “We found that all the things that were vital to our long-term competitiveness had one thing in common: time. Everything we wanted to do to improve operations had something to do with squeezing time out of our processes.”5
The QRM Detective
The QRM detective is about the process of seeking out and finding opportunities for improvement. All it requires is asking one question: “Why is this order waiting here?” After this, the QRM detective just follows up with common-sense questions to find the root cause. Let’s say our QRM detective is pointing at a batch of twenty castings that are sitting in the middle of the shop floor with no obvious destination machine. He or she would turn to the supervisor of the machining operation and ask:
QRM Detective: “Why is this order waiting here?”
Supervisor: “There was a blowhole in several of the castings.”
QRM Detective: “Why not continue with the rest of the castings?”
Supervisor: “The defect wasn’t discovered until the third machining operation. We were concerned about putting more time into this job and have it be wasted. We have contacted the supplier—a foundry on the West Coast—and asked for a whole new batch of castings. So production of the whole job has been halted pending the arrival of the new castings.”
QRM Detective: “Has this happened before with this foundry?”
Supervisor: “Yes, several times. I’ve complained to our purchasing department, but this foundry always underbids the others, and purchasing wants to keep giving them a chance.”
At this point the message is clear: Your purchasing department needs to make it a priority either to work with this foundry to improve its quality or else find another foundry that has a better track record. In addition, it is time to reevaluate purchasing policies, so that buyers are not driven by cost alone.
Now let’s say our QRM detective spies several batches of parts sitting in front of a CNC lathe. Again, he or she starts by asking the machine operator the key question:
QRM Detective: “Why are these orders waiting here?”
Machine Operator: “The machine is down.”
QRM Detective: “Is it down often?”
Operator: “Yes, about once a month, for several days at a time.”
QRM Detective: “Why does it take so long to fix?”
Operator: “Because a few years ago we reduced all our inventories as part of a JIT program. This included all the spare parts. Often we just need a $20 belt or a hose, but we have to wait for it to be shipped by the manufacturer.”
Again the message is clear. The firm needs to reevaluate its policies for storage of critical spare parts, as well as its preventive maintenance policies, and possibly even operator training in case the operator’s procedures are contributing to the failures.
But this detective work is not limited to the shop floor. The QRM detective is free to roam anywhere in the company, including office operations. Now we find our QRM detective in the design engineering department, where he or she discovers a large stack of folders on a desk, with partially completed drawings in them.
QRM Detective: “Why are these folders of orders waiting here?”
Engineer: “They are all waiting for information from our inside sales department.”
QRM Detective: “Didn’t these folders come from the inside sales department?”
Engineer: “Yes, they did!”
QRM Detective: “Then why do you still need their input?”
Engineer: “In each case, some details about the customer requirements are missing. I can’t complete the design until those details are supplied.”
Here too, the message is clear after only three questions. You need to improve this process so that you deliver the right information the first time. Perhaps a set of forms needs to be designed, or the inside sales staff needs to be trained. The problem may even go back to the field sales reps. In any case, the opportunity for improvement has been uncovered.
Everyone in the company should be encouraged to become a QRM detective. By asking these kinds of questions a company will continually be uncovering improvement opportunities. You can then tackle these opportunities using well-established TQM or continuous improvement problem-solving techniques such as pareto charts, fishbone diagrams, and affinity diagrams.6
As you tackle these opportunities and improvements are realized, two things happen in the organization. First, quality improves significantly. By quality I don’t mean simply the number of parts rejected at a given step, or how close you can observe specified tolerances in a machining process. That is a narrow view of quality. By quality I mean doing things right the first time, that is, a definition based on the concept of total quality. Second, operating costs start to go down. To understand this, you need to be aware of a significant statistic. In the average American company, 25 percent of total operating cost is spent on fixing problems that should never have occurred in the first place.7 Consider the magnitude of this statistic. For a company that has an annual operating budget of $100 million, this means that $25 million is spent each year fixing problems that should not have occurred at all. Suppose the company makes a profit of $10 million a year. If it can reduce the wasted efforts by 50 percent, it will cut $12.5 million out of its annual expenses and more than double its profit.
These wasted efforts take on many forms. Some are obvious, others are more insidious-they’ve been around for so long you don’t even recognize them as non-value-adding; you just think of them as standard operating practice. Let’s consider some instances of these wastes and related practices in the specific context of QRM, and perhaps you may recognize a few that are close to home.
WASTE DUE TO LONG LEAD TIMES AND LATE DELIVERIES
A cornerstone of JIT is the elimination of waste. However, in the JIT literature descriptions of the types of waste to be eliminated ignore many of the wasted efforts that are the result of delays in delivery, which is important in understanding QRM. To show the difference between the JIT and QRM approaches I’ll first give some classic and obvious examples of resources devoted to fixing problems that should not have occurred in the first place:
- People whose job it is to do rework.
- Supervisors of the people doing rework.
- Time spent by managers and executives on managing the rework department and its employees.
- Scrap material as a result of poor quality.
You have probably thought of all these situations as wasteful, and they are typically given as examples in the JIT literature too. But now let’s look at some less obvious examples of waste:
- Time spent by planners and schedulers to reschedule jobs due to rework that caused delays.
- Time spent by managers to resolve conflicts between competing delayed jobs that need access to common resources.
- Expeditors: people whose entire job consists of keeping orders moving in spite of unexpected delays.
- The cost of overtime pay to expedite delayed jobs, or for herculean efforts to complete jobs in order to prevent them from being shipped late. One Martin Marietta plant found that 90 percent of the overtime it was using could be eliminated when it adopted QRM approaches.8
- Time spent by salespeople to placate customers who are upset because of quality or delivery problems. This can be much worse than you think. The vice president of a Midwest company that manufactures sophisticated testing machinery recently gave me an astounding statistic. This company has a sales subsidiary in Asia. The company estimated in 1996 that a full third of the resources of this subsidiary were spent dealing with customers who were upset with late deliveries. Why would it take so much? Here is how he explained it to me:
When we first receive notification from the U.S. plant that we are going to be late, we need to take the customers out for lunch or dinner and gently tell them the news. But then we hear from the plant again about a further delay. This time it takes two or three meetings with the customers to calm them down. The worst, however, is when we find out that there is yet another delay. Now I have to dedicate a salesperson full time to this customer just to make sure the entire sale isn’t revoked. But it doesn’t end there. The next time this customer wants a machine, if they even want to talk to us, it takes our salespeople three to four times the average sales effort to close the sale, because of the customer’s bad experience. And this haunts us in the general marketplace too. We find more and more customers hearing about our track record and it is taking us longer and more effort to close sales with other companies as well.
- Jobs that have been institutionalized so that you don’t question them anymore, but are essentially non-value-added. Consider a large East Coast factory of an aerospace company that I visited a few years ago. The factory consisted of many departments sprawled over almost a whole square mile. One department in the factory had 50 workers. Of these, 4 workers had the job title “Parts Chaser.” I was tempted to ask whether parts in this factory had wings and these poor workers had to run around with butterfly nets attempting to capture them. The truth was that in such a large factory parts did get misplaced. Often one department would insist that it had completed a batch of parts, but the next department would insist equally strongly that it had never received them. The job of the parts chasers in each department was to find where incoming “lost” batches of parts had landed. Note that fully 8 percent of the salaries in this department were going into this particular job of fixing problems that should never have occurred. Similar ratios could be seen for other departments. Yet the management of this company did not see anything wrong. Quite the contrary: Both management and the union had institutionalized this job to the point where parts chaser was a union job classification.
No wonder the typical company spends 25 percent of its budget on wasted efforts and yet doesn’t realize it. Although we can find many such examples in diverse industries, a study of contrasts between two industries serves to highlight the magnitude of waste as well as the lack of general awareness of this waste.
Although JIT is, among other things, a powerful way to eliminate non-value-added waste it does not focus on these less obvious, time-consuming, and insidious forms of waste, waste that so often becomes standardized and part of the company’s culture. To break from this mold you must look at why this form of waste is occurring.
This brings us back to the discussion about the more fundamental reason for embarking on the QRM journey: The QRM mind-set, as embodied in the QRM detective and adopted across the organization, reveals opportunities for improvement. Creating the mind-set of the QRM detective is an important first step for an organization. By beginning here, and working on the opportunities uncovered by your QRM detectives, you get higher quality and less waste of the type mentioned in the examples. In addition, less rework and shorter lead times result in lower work-in-process (WIP). As you will see in later chapters, you will also achieve substantial reductions in inventories of raw materials and finished goods. The payoff of all these factors is a significant reduction in total operating cost.
RESULTS OF QUICK RESPONSE STRATEGIES
Firms that are successful in implementing QRM become formidable competitors in their markets. They are leaner and they deliver high-quality products faster than their competitors. Imagine the following dialog between a field sales representative for a firm that makes custom sheet metal products and a buyer at a customer’s company.
Buyer: “Have you had a chance to review those drawings for the electrical cabinets that we need?”
Sales Rep: “Yes, our engineers and I have looked them over. They are within the scope of our capabilities and we can definitely make them for you.”
Buyer: “And what about delivery time? We need these rather soon to assemble them into our product. We have just received an order from an important customer who needs a shipment of our products urgently.”
Sales Rep: “That should be no problem. I know that you usually need three to four weeks before you can get all the other components for your final assembly. We’ll have the cabinets to you in two weeks so that you’re not held up at all.”
At this point the buyer is amazed. The other cabinetmakers that she has been speaking with have all been quoting 10–14 weeks, some even 16 weeks. She finds two weeks unbelievable and is a bit skeptical. She decides to probe the rep a bit further.
Buyer: “Are you sure you can still meet our expectations of quality if you rush this order through for us?”
Sales Rep: “Absolutely! I can give you several references from recent customers. They have been amazed at how good our quality has been over the last year. And you should know, we won’t be cutting any corners to rush your order through. We have consistently been making high-quality cabinets with lead times of two to three weeks for some time now.”
Now the buyer feels there must be a catch to this. So she asks, guardedly:
Buyer: “That sounds impressive. But does that mean we have to pay a premium to get our order through so quickly?”
Let us pause a moment to think about the rep’s answer. Sometimes customers that have an urgent need are willing to pay a premium to get rapid delivery, such as the company with the broken machine discussed earlier. Should the rep mention a premium? Traditional sales training would say, “Why not? The customer is in trouble and may be willing to pay. Test the water and see how the customer reacts.” But the QRM principle is a firm no. You should definitely not add any premium for delivering faster than the competition. Let’s understand this further.
Successful companies know that the name of the game for persistent success is long-term market share, not short-term profitability. Suppose the rep does quote a price with a premium. His quote comes in at $880 per cabinet for 20 cabinets, or $17,600 total. The buyer already has a quote from another cabinet company, for $750 per cabinet for a total of $15,000. This company has pledged to expedite the cabinets through their shop in four weeks, but it usually takes them 12–14 weeks and they do not have a good track record of delivery. So the choice facing the buyer is, either get the cabinets on time, or be willing to risk a delay in her own company’s production but save $2,600. This is a difficult trade-off to evaluate and at this point it is possible that the buyer will need to think this through in detail and perhaps consult some other managers in her company.
The QRM approach, on the other hand, is to make the buyer’s decision a “nobrainer.” The rep should quote a price that is consistent with the marketplace, not higher. Now the decision for the buyer is simple. Not only is the price the same as that of other companies, but the quality is superb and the delivery time is what she needs. At this point the buyer need look no further. She does not need to run any complex justification past any managers. The choice is clear.
As a result of such thinking, companies that adopt such QRM strategies, both in their production and in their pricing, find themselves seizing market share at an amazing pace and increasing their profitability. Herein lies another reason for the sales rep not to quote a premium price. If the rep’s price is at the same level as other companies in the market, but his company has adopted a QRM program, then his cost of production is steadily decreasing. Thus, even while maintaining the market price, his company is already making more profit relative to the competition.
It is not surprising then, that statistics show companies adopting quick response strategies doing very well relative to their competition. One study showed, for example, that such companies grow at a rate three times the average for their industry. At the same time, their profitability can be twice the industry average.11
Another study of 561 plants on three continents showed the impact of lead time reduction on a plant’s competitiveness. Three aspects of each plant’s performance were studied: its rank in the industry, its rank in the company, and its improvement in productivity. Along with this, a large number of operational characteristics were measured for the plants. Of all the characteristics in these 561 plants, only one showed strong correlation with all three performance aspects: The percentage of lead time reduction by a plant over the past five years had a strong correlation with all three aspects, industry rank, company rank and productivity gains.12
My claim that QRM leads to improvements that result in cost reduction is not just based on logical arguments and anecdotal evidence. Researchers have actually been able to quantify the impact of lead time reduction on cost reduction. A study of a number of companies that reduced their lead times found that on average, there was a 2:1 ratio between reductions in lead time and cost. In other words, a 50 percent reduction in lead time resulted, on average, in a 25 percent reduction in overall product cost.13 Another study of 75 component manufacturers showed that companies implementing quick response strategies had 70 percent fewer “overhead people”-salaried and indirect labor—than companies that operated using traditional scale- and cost-based strategies.14
These are just aggregate performance figures over a broad range of companies. Actual performance, if a company targets a market that is ripe for a strategy of quick delivery, can be much higher.
BENEFITS OF QUICK RESPONSE IN SECURING ORDERS
When companies try to speed up the delivery process, an area of operations that is often ignored is the aspect of securing an order in the first place.15 Looking at the big picture for a moment, you should investigate speeding up the entire cycle from first customer contact to receipt of payment, if you wish to fully adopt a QRM strategy. This cycle can be broken down into six major stages (see Figure 2-3). Five of these stages run sequentially; one, materials procurement, runs in parallel with some of the stages. Although the details of these stages vary for different companies, a typical description of each stage is as follows:
- Stage 1: Order Capture: This begins with initial customer contact and ends with receipt of a purchase order or other contract from the customer. It includes one or more cycles of cost estimating and quoting, and other negotiations to close the sale.
- Stage 2: Order Process: Here the order is entered into a computer system, engineering tasks are completed if needed, components and materials that need to be procured are identified, manufacturing process routings are developed, the stages of production are scheduled, job tickets are printed, and a “shop packet” is released to the shop floor. (Note that actual release of the order to the shop floor might be contingent on arrival of certain materials.)
- Stage 3: Materials Procurement: Although some standard materials might be kept on hand, items that are particular to a custom order usually need to be purchased. These items have been identified in the previous stage; this stage involves procuring them, and typically proceeds in parallel with part of the order processing and manufacturing stages.
- Stage 4: Manufacture: This includes fabrication of components, and assembly and test of the finished product.
- Stage 5: Ship: Here the order is packed and shipped to its destination.
- Stage 6: Collect Payment: In this final stage, accounts receivable obtains payment from the customer.
Figure 2-3.
Major Stages from Customer Contact to Collection
This entire six-stage cycle should be the target of a QRM strategy, not just the production portion. This is especially significant since we have found that the first two stages often account for 50 percent or more of the total time in this cycle.16 Let’s take a look at the typical activities that occur in the order capture cycle stage:
- Determining the customer’s requirements.
- Performing a rough design.
- Estimating the cost of making the product.
- Putting together a formal quote, which includes an appropriate price markup as well as legal terms and conditions.
- Getting the customer to accept the quote and issue a purchase order. This is most important.
You know the obvious benefit of reducing the order capture time, namely, a faster cash flow cycle for the company. There are, however, many less obvious benefits:
- Reducing order capture time cuts down the organization’s overhead. A lot of organizational resources go into the above activities. Since these activities are performed to obtain jobs, they cannot be charged to a specific job, and are usually lumped into overhead costs. As you will see in Chapter 11, reduction of time in this stage comes from methods that also reduce the amount of effort expended in these activities.
- Often the order capture and order processing parts of the cycle take extra time and resources because customer requirements have not been properly determined. The order capture part of the organization is also not exempt from visits from the QRM detective. Consider a scene in the cost estimating department:
QRM Detective: “Why are these folders of quotes waiting here?”
Estimator: “They are all waiting for field sales reps to call me back. In some cases I’ve been playing phone tag with a rep for over a week!”
QRM Detective: “Why do you need the reps to call you?”
Estimator: “In each case, information that they put on the form is inconsistent. It doesn’t make sense with earlier information on the same form. I can’t do a cost estimate until the contradiction is straightened out.”
As before, the message is clear after only two questions. You need to improve this process so that you deliver the right information the first time. Perhaps the forms need to be improved, or the field sales force needs to be trained. In any case, the QRM detective has uncovered an opportunity for improvement.
- Sometimes customers can’t afford to wait to get a host of competitive bids. Consider this story. A buyer for a manufacturing firm is looking for an engineered component to go into a production machine that has broken down. She calls around for quotes. Most companies say it will take two to three weeks to look over the drawings and respond with a detailed cost estimate. In contrast, one company, we’ll call Custom Metal Products Co. receives a faxed drawing of the component while speaking with the buyer over the phone and is able to give her a quote right away, during the initial phone call. The buyer has dealt with Custom Metal before, has faith in its quality and delivery, and knows from past experience that Custom Metal’s prices are reasonable. Her expertise also tells her that this quote “is in the ballpark.” Given the urgency of the situation, she decides she can’t afford to wait another two to three weeks to get all the quotes in, and she issues a verbal purchase order to Custom Metal during this first phone call. She tells them that they will receive a fax of the purchase order the next day. Custom Metal, having also dealt with this buyer in the past, knows her word is as good as a firm order, and begins processing the order right away. This cycle could well have taken five weeks—say, three weeks to get all the quotes in, a week to review them and negotiate with different companies to try to get a better deal, and a week to issue the purchase order. You have reduced an entire five-week process to about 15 minutes, a 99.9 percent reduction in the time for this stage. Sounds too good to be true? In Chapter 12 I give an example of a company that did just this. Such a procedure is not created overnight, though. You will learn the techniques for putting in place this type of quoting process.
- Companies report that when they take a long time to make a quote they often find that they have lost the sale anyway. As Bill Vogel, president of Vogel Wood Products of Madison, Wisconsin said to me, “If we take longer than a week to make a quote, we might as well not bother, because the job has already been given to someone else.”
- A rapid quoting process creates a favorable impression on the customer. If, as a company that professes quick response in delivery, you take a long time to turn a quote around, you have left some doubt in the customer’s mind about your responsiveness. On the other hand, if the customer routinely deals with companies that take two weeks to respond, and you issue your quote in a day, you have made a lasting impression on the customer about your abilities. The image that you are creating will pave the way for additional business.
BENEFITS OF QRM: FOREWARNED IS FOREARMED
Although there is an impressive potential for QRM strategies, many companies have initiated a QRM program, only to kill it in less than a year. Why? Because of inappropriate and misleading measurements. This is why you need to be clear about what needs to be observed and measured under a QRM program and how it affects the traditional measurement systems. This way you will be prepared to help others understand QRM and keep your company from swerving off the QRM path.
To make this discussion concrete, let’s again consider the company that makes sheet metal cabinets and analyze the cost of production. Specifically, I will look at what is known as cost of goods sold or COGS. This is the company’s best estimate of what it took to make a particular product, including accounting for all the nonproduction activities, such as order entry and engineering. For the purpose of this example, I will also include sales and general administrative costs in the COGS value. Put this way, if the COGS is accurate, and the company sells all of its products at exactly the COGS value, then it will exactly break even at the end of the year. Whenever the company sells a product at a price exceeding the COGS, and assuming again that the COGS is accurate, then the company is making a profit. Likewise, if it sells below the COGS, it is suffering a loss. So it is important for managers to know the COGS, and companies typically have elaborate accounting systems to track this value for each product.
In the cabinet company, let’s take a line of cabinets whose COGS is typically around $1,000 (see Figure 2-4). For this line the cost of materials is $500, or 50 percent of the COGS. (This is fairly typical of manufacturing firms. The materials component of the COGS can vary between 30 percent and 75 percent, but it is close to 50 percent for a large proportion of firms.) Next we find that the cost of direct labor (i.e., shopfloor labor that works directly on manufacturing operations for this line) is $100 or 10 percent of the COGS. (Again, this is typical. In U.S. industry, direct labor usually ranges from 7 to 20 percent of the COGS.) That leaves $400 in cost. Where does that come from? This indeed is the cost of the rest of the organization being “allocated” to this line of cabinets by the accounting system. It is usually called overhead.

Figure 2-4.
Breakdown of Cost of Goods Sold (COGS) for a $1,000 Cabinet
Another name for this $400 component of the COGS is burden because it is allocated by “burdening” the direct labor cost with an additional amount. In the above example, if historically the company has found that for each $ 1 in direct labor, it spends $4 in other organizational costs (not including materials whose costs are accounted for), then it will establish a 400 percent burden on direct labor. The COGS is then derived by the formula:
So, in the above example, the $400 was derived not by tracking the other costs exactly, but by allocating them by multiplying $100 by 4.
Now, it is not unusual that when you implement a QRM program for a line of products on the shop floor, the direct labor content for the products actually increases by 10–30 percent (see Figure 2-5). This may sound surprising, given what I just said earlier in this chapter—I’ll explain this discrepancy in a moment—but let’s see what might happen in a company that was not prepared for this occurrence.

Figure 2-5.
Impact on COGS After Three Months of a QRM Program
In our company, suppose the direct labor cost increases by 25 percent to $125. Since the materials cost and burden rate in the accounting system have not changed, the new COGS will be calculated according to the formula above as:
or an increase of $125. This will soon raise flags in various managers’ offices, ranging from the controller to the VP of finance, to the VP of manufacturing, and even the president or CEO. “What’s going on?” they will ask. “The cabinets that were made for $1,000 are now costing us $1,125-ever since we started that newfangled QRM program! We’ve made 200 of those cabinets in the last few months. That means we’ve lost around $25,000 since we initiated this program.” In the vernacular of accounting, managers will begin to see “variances” all over the place, and the VP of manufacturing might even be given a warning by the president, to whom it seems the corporation is hemorrhaging badly. “Fix this problem in the next two months or you’ll be out of a job,” the VP is warned. What choice does the VP have? In the absence of detailed understanding of QRM by senior management, the VP can only revert back to the old way of doing the job, and so the QRM program is scuttled.
I have seen this happen at several companies. So what is going on? Is the COGS really going up? It shouldn’t be, if you believe all the arguments just made about the benefits of QRM. This is what is happening to the three major cost components in the case of the cabinet line, and why.
- Direct labor. There are three main reasons this goes up. First, when you reorganize production for QRM, many of the tasks normally allotted to indirect labor are now done by direct labor. Examples are material handling, quality checks, supervision, and even ordering of components. Second, because of the need for additional skill sets in the direct labor pool, wages will need to be increased. Third, a key strategy for QRM is to maintain a level of idle capacity in the resources. So, instead of planning for utilizing labor at 100 percent of available capacity, one might aim for an average of 80 percent. This means the cost of the remaining 20 percent of labor time is being spread over this line of cabinets.
- Overhead. Precisely because you have given some of these indirect tasks to the shopfloor labor, however, you can expect overhead resources used by this line of cabinets to decrease. But the effect is greater than that. You eliminate or minimize many additional activities such as expediting, managers’ time for problem solving and rescheduling jobs, and other examples of non-value-added activities given earlier. Also, decrease in inventory of raw material, work-in-process, and finished goods means a decline in carrying costs. It would be conservative to say that the overhead costs incurred by this line of cabinets would decrease from $400 per cabinet to $350.
- Materials. The story does not stop with the above two cost components. One might think, since there is no change in design or manufacturing processes, the materials cost will not change. However, with quality improvements, less rework and scrap, and other initiatives taken on by shopfloor workers under the QRM organization, one finds a 5–15 percent savings in total material cost. So in our example, using an average figure of 10 perent, the materials cost would be reduced to $450.
The result of these three effects is a total cost of:
or a savings of $75 per cabinet, not an increase of $125 per cabinet as reported by the accounting system.
The problem, clearly, is that the accounting system uses historical data for both materials and overhead-data that are not keeping pace with the changes created by the QRM methods of work. You usually need a year or so of experience to document some of the new data, and even then the problem is only partially fixed because some of the reductions in overhead cannot be easily traced to our particular line of cabinets (products), and are spread over all the products instead.
Admittedly, this is a simplified example. Most accounting systems are more sophisticated than this and break the COGS down in more detail. However, this problem still occurs. In fact, accountants have documented this phenomenon themselves in the specific context of lead time reduction.17 It should also be emphasized that a newer approach to cost allocation, called activity-based costing or ABC, will not necessarily fix this problem either. It might make the effect a bit less extreme, but the effect will occur nevertheless.
One Solution—Use a Strategic Overhead Allocation Method
So what is the solution? It’s one thing for management to give a green light to a QRM program and quite another navigating through the difficult implementation process. The solution to understanding the QRM program involves a combination of factors: an educated, even enlightened, management that is aware of the ramifications of QRM; participation and buy-in from the accounting and finance department before the program is initiated; advance notice to the board or owners of the company about this effect, and patience (or courage!) from this same body of people until enough time has passed for the company to get a better handle on true costs and benefits resulting from the QRM changes.
There is one additional bold approach to this COGS problem, which you can use in conjunction with the above. I call this a strategic overhead allocation method. The idea is for management to estimate the impact of the program on the materials and overhead costs for the next year based on analysis for a line of products conducted prior to the initiation of the QRM. The company then uses this estimate to strategically reset the costs allocated to this line of products. Now management will no longer feel the pressure from unexpected “variances” for this product line.
Let’s see how this could work for our metal cabinet example. Management knows that the current overhead cost in a $1,000 cabinet is $400. It reasons that this will certainly not increase, and probably will decrease. So it decides on a conservative figure of $350 per cabinet for the overhead after the QRM organization is in place for the cabinets. However, this figure is now set as a fixed overhead allocation, not as a burden that is a multiplier based on labor content. If cabinets of widely differing complexity are being made, then management could provide a table of new fixed overhead numbers based on cabinet style. Similarly, management decides on a conservative 3 percent reduction in materials cost. Now the traditional material costs can be accumulated for each cabinet, but the aggregate is reduced by 3 percent before reporting the total.
Of course this will require other adjustments in the costing system. If overhead allocated to this line of products decreases, someone else has to pick up the cost. This is not entirely bad, since it will put pressure on the rest of the organization to find similar improvements. Also, if material costs are being reduced by 3 percent, where is this cost being balanced out in the system? One way to tackle either or both of these issues is to create a strategic pool to collect such variances. If the estimated QRM benefits are achieved or exceeded, then at the end of the year the improvements will be such that actual costs will have gone down and improvements will “cancel out” or even exceed the amount in this strategic pool. The burden however, has been shifted-in a manner of speaking-from labor to top management. Because now, as the year goes on and before concrete results are in, management will see this strategic pool growing, accumulating dollars that have not been accounted for, and it will take some courage to stay the course. So it is clear that you need to do the strategic allocation in concert with and not instead of the other management approaches we listed.
The good news is that there is light at the end of the tunnel. As I will show, companies experience 50–200 percent increases in productivity and 30–50 percent reduction in floor space and other overhead costs. Better still is that in the long term, as a result of many incremental productivity improvements, the direct labor content often goes down to below the original level. In our last cabinet example, where we started at $100 for direct labor per cabinet and went first to $125, you might find after two years that you have come below $90. And all this while the shop floor has accepted more responsibility.
To end with an inspirational example we look at the Beloit Corporation in Beloit, Wisconsin, a manufacturer of paper-making machinery. Beloit used QRM principles to reorganize how they made formed metal tubes that are needed as components for their machines. Where it used to take them 12 departments and 3 interplant moves to make these tubes with a lead time of four weeks or more, today two workers make the tubes in one small area with a lead time of under three days. Better still, after two years of experience with the new approach, they have doubled their production. This is a 100 percent increase in productivity combined with an 80 percent reduction in lead time. At the same time a great deal of material handling and transportation has been eliminated, and rework and quality problems have dropped from frequent to almost nonexistent.18 If Beloit Corporation had used a strategic pool, I’m sure at the end of the year management would also have been delighted with the final values in this pool.