Chapter 15
Reporting on the State of Affairs
IN THIS CHAPTER
![]() Printing QuickBooks reports
Printing QuickBooks reports
![]() Using the Reports menu commands
Using the Reports menu commands
![]() QuickZooming report totals
QuickZooming report totals
![]() Sharing information with a spreadsheet
Sharing information with a spreadsheet
![]() Editing and rearranging report information
Editing and rearranging report information
![]() Processing multiple reports
Processing multiple reports
![]() Using QuickReports
Using QuickReports
To find out whether your business is thriving or diving, you use the QuickBooks Reports feature. The different kinds of reports in QuickBooks cover everything from cash flow to missing checks, not to mention QuickReports. QuickReports are summary reports that you can get from the information in forms, account registers, or lists by merely clicking the mouse.
In this chapter, I tell you how to prepare reports, how to print them, and how to customize reports for your special needs.
What Kinds of Reports Are There, Anyway?
If you run a small business, you don’t need all the reports that QuickBooks offers, but many of these reports are extremely useful. Reports show you how healthy or unhealthy your business is, where your profits are, and where you’re wasting time and squandering resources.
To make sense of what might otherwise become mass confusion, QuickBooks organizes all its reports in categories. You can see all the categories by pulling down the Reports menu or by clicking the Report Center icon. The names of the reports read a bit like public-television documentary names, don’t they? (“Tonight, Joob Taylor explores the mazelike federal budget in Budget Reports.”) You select a report category to see a list of report names.
In Table 15-1, I describe reports by category and give a short description of the major reports in each category. To get a thorough description of a particular report, use the Help feature. To find out what a standard profit and loss report does, for example, choose Help ⇒ QuickBooks Help and then click the Index tab. Type financial statements in the text box. (The Help information includes a wonderful discussion of how to understand the profit and loss and balance sheet financial statements.) Or, in the Reports Center, select the type of report on the left side. You see a list of the different reports available on the right side, with a description of the information contained in each one. To read the details about a topic, click that topic in the list.
TABLE 15-1 QuickBooks Report Categories
Report Category |
Description |
|---|---|
Company & Financial |
These reports give you a bird’s-eye view of your company’s health and cash flow. They give you a snapshot of your assets, liabilities, and equity, showing income, expenses, and net profit or loss over time. |
Customers & Receivables |
These accounts receivable reports are great for finding out where you stand in regard to your customer invoices. You can list unpaid invoices and group them in various ways, including by customer, job, and aging status. |
Sales |
These reports show what you sold and who your customers are. You can see your sales by item, customer, or sales representative. |
Jobs, Time & Mileage |
These reports let you see job and item profitability, compare job estimates with actual costs, view time recorded on jobs and activities, and look at vehicle mileage. |
Vendors & Payables |
These accounts payable reports tell you everything you need to know about your unpaid bills. You can list bills in a variety of ways, including by vendor and by aging status. This category also includes a report for determining sales tax liability. |
Purchases |
If you enable the Inventory and Purchase Orders option within QuickBooks when you run QuickBooks Setup, these reports show from whom you bought, what you bought, and how much you paid. You can list purchases by item or by vendor. One handy report shows any outstanding purchase orders. |
Inventory |
These reports help answer the ever-important question “What items do I have in stock?” You can get an enormous amount of detail from these reports, such as how many units of an item you have on hand and how many units you have on order. You can group inventory by vendor or item. If you need price lists, you can print them by using a special report from your QuickBooks file. Note the Inventory and Purchase Orders option needs to be turned on to access these reports. |
Employees & Payroll |
These reports, available if you signed up for one of the QuickBooks payroll options, offer ways to track payroll or check your payroll liability accounts. Believe me: These reports come in handy. |
Banking |
These reports list checks and deposits. |
Accountant & Taxes |
These reports include income tax reports, journal and general ledger reports, and a trial balance. |
Budgets & Forecasts |
These reports show you once and for all whether your budgeting skills are realistic. You can view budgets by job, month, or balance sheet account. Then you can compare the budgets with actual income and expense totals. (You need to have a budget already set up to use this report — something I discuss in Chapter 12.) |
List |
These reports let you see your lists in detail. You can see the contacts, phone numbers, and addresses on your Customer, Vendor, or Other Names lists, for example. You also can create a detailed report of your inventory. |
Industry Specific |
Some versions of QuickBooks also supply industry-specific reports under the Industry Specific submenu command. At this writing, QuickBooks comes in industry-specific versions for accountants, contractors, manufacturers, wholesalers, professional service firms, retailers, and not-for-profit organizations. |
Contributed Reports |
QuickBooks provides a Contributed Reports menu command that enables you to display web pages of custom QuickBooks report templates that Intuit and outside parties (accounting firms, small businesses, and so on) have developed and then “contributed.” |
Custom |
QuickBooks allows you to create customized summary reports and transaction listings. You create these reports by choosing either the Summary or Transaction Detail command from the Custom Reports submenu. |
 If you’re not sure which specific report you want, you can use the Report Center. Just choose Reports ⇒ Report Center and then choose a report category in the list along the left edge of the Report Center window (see Figure 15-1). QuickBooks displays a picture of the most common reports within the category in the Report Center window.

FIGURE 15-1: The Report Center window.
Creating and Printing a Report
After you decide what report you need, all you have to do is choose it from the appropriate menu or select it in the Report Center window. To create a standard profit and loss report, for example, choose Reports ⇒ Company & Financial ⇒ Profit & Loss Standard; select it in the Report Center; or double-click the report image in the Report Center window.
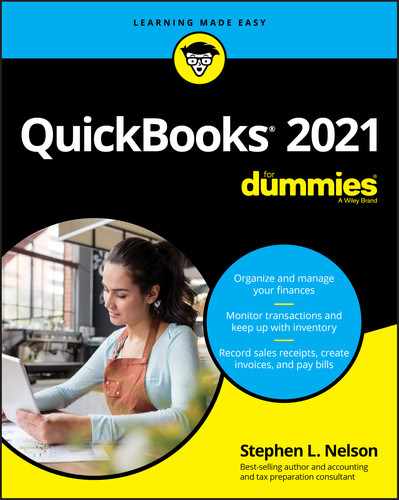
Depending on how much data QuickBooks has to process, you may see a Building Report box before the report appears onscreen in all its glory. Figure 15-2 shows a standard profit and loss report, or an income statement.
If you see a Customize Report dialog box instead of a report, you can tell QuickBooks to change this option. To do so, choose Edit ⇒ Preferences and then click the Reports & Graphs icon in the list on the left. Click the My Preferences tab, if you have one and if it isn’t already selected. Remove the check mark from the check box titled Prompt Me to Modify Report Options Before Opening a Report.
 You can’t see the entire onscreen version of a report unless your report is very small (or your screen is monstrously large). Use the Page Up and Page Down keys on your keyboard to scroll up and down, and press Tab and Shift+Tab to move left and right. If you’re a mouse-lover, you can use the scroll bar instead.
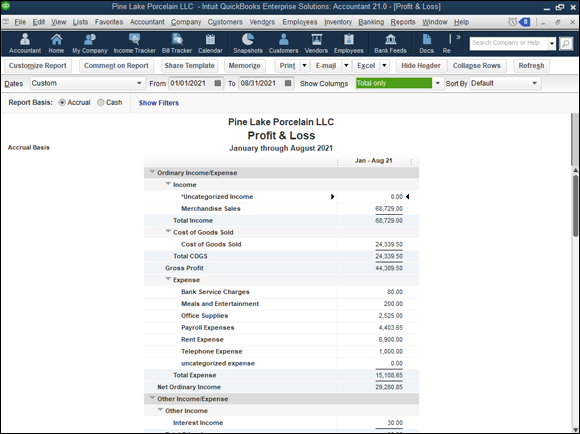
FIGURE 15-2: A standard profit and loss report.
To print a report, click the Print button at the top of the report, and choose Report from the drop-down menu that appears. QuickBooks displays the Print Reports dialog box, as shown in Figure 15-3. To accept the given specifications, which are almost always fine, click the Print button. You’ll never guess what happens next: QuickBooks prints the report!

FIGURE 15-3: The Settings tab of the Print Reports dialog box.
The first time you print a report, QuickBooks displays a Printing Features dialog box that explains a few things about the mechanics of choosing and printing reports.
Before I forget, I want to tell you that you can select the File radio button in the Print To panel to tell QuickBooks to save the report as a file instead of printing it. Then you can choose the file format: ASCII Text File, Comma Delimited File, or Tab Delimited File. You can use either delimited-file format if you want to open the file later with a spreadsheet program, such as Microsoft Excel. After you click Print, use the Create Disk File dialog box that appears to specify the filename and storage location.
Both the File menu and the submenu of the report window’s Print button provide a Save As PDF command, which you can use to create a PDF version of the report that appears in the report menu. Just choose the command and provide a name for the PDF when QuickBooks prompts you.
The Orientation settings tell QuickBooks how the report is supposed to appear on the paper. The Page Range settings specify the pages that you want to print. The Fit Report to xx Page(s) Wide and Fit Report to xx Page(s) High check boxes enable you to shrink the report so that it fits on the number of pages you specify. The purpose of the Print in Color (Color Printers Only) check box is pretty self-evident.
QuickBooks includes two page-break options for creating easier-to-read reports:
- Select the first check box (Smart Page Breaks) to keep items that belong in the same group on the same page.
- Select the second check box to give each major group its own page.
You can preview the report by clicking the Preview button.
Visiting the report dog-and-pony show
You can do some neat things with the reports you create. Here’s a quick rundown of some of the most valuable tricks:
QuickZooming mysterious figures: If you don’t understand where a number in a report comes from, point to it with the mouse. As you point to numbers, QuickBooks changes the mouse pointer to a magnifying glass marked with a Z. Double-click the mouse to have QuickBooks display a list of all the transactions that make up that number.
This feature, called QuickZoom, is extremely handy for understanding the figures that appear in reports. All you have to do is double-click any mysterious-looking figure in a report. QuickBooks immediately tells you exactly how it arrived at that figure.
- Sharing report data with Microsoft Excel: You can export report data to an Excel spreadsheet by clicking the Excel button in the report window. When QuickBooks displays its menu, choose the Create New Worksheet or Update Existing Worksheet command. (QuickBooks displays the Send Report to Excel dialog box, which you can use to exercise additional control of how the report gets sent to Microsoft Excel.)
Editing and rearranging reports
You may have noticed that when QuickBooks displays the report document window, it also displays a row of buttons: Customize Report, Comment on Report, Share Template, Memorize, Print, E-Mail, Excel, and so on (refer to Figure 15-2). Below this toolbar are some drop-down menus that have to do with dates, a drop-down menu called Show Columns, and a drop-down menu called Sort By. (Not all these menus are available in every report document window. I don’t know why, really. Maybe just to keep you guessing.)
You don’t need to worry about these buttons and menus. Read the discussion that follows only if you’re feeling comfortable, relaxed, and truly mellow, okay?
Modifying
When you click the Customize Report button, QuickBooks displays the Modify Report dialog box, as shown in Figure 15-4. From this dialog box, you can change the information displayed in a report and the way in which that information is arranged (the Display tab); the data used to generate the report (the Filters tab); the header and footer information (predictably, the Header/Footer tab); and the typeface and size of print used for a report (the Fonts & Numbers tab).
Commenting on a report
You can annotate a report with comments in QuickBooks 2015 and later. To do this, click the Comment on Report button. When QuickBooks displays the Comments panel at the bottom of the report window (see Figure 15-5), click the comment box next to the reported-on value you want to comment on and then click in the Comments panel to type your remarks. To save your comments, click the Save button in the Comments panel. To save your report and all the comments you added, click the Save button in the top-left corner of the report window. To access these saved reports later, choose Reports ⇒ Commented Reports. Note that you can also print and email an annotated report by using the Print and E-Mail buttons, which appear in the top-left corner of the report window.

FIGURE 15-4: The Display tab of the Modify Report dialog box.
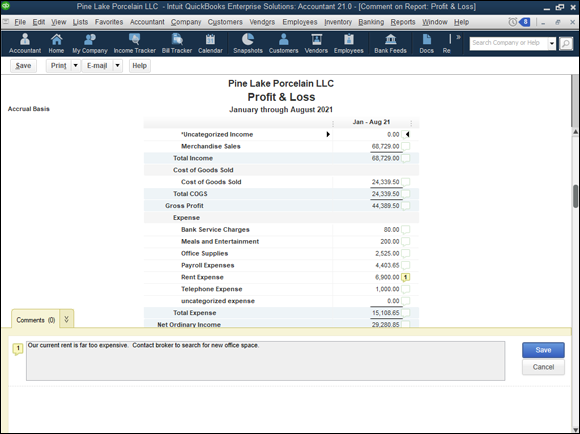
FIGURE 15-5: The report window with the Comments panel displayed.
Sharing templates
If you work in a multiple-user QuickBooks environment, and you create a customized report, you can share this report with other users. To do this, click the Share Template button. When QuickBooks displays the Share Template dialog box (not shown), name and describe the shared report by using the Report Title and Description text boxes. Then click the Share button.
Memorizing
If you do play around with the remaining buttons, you can save any custom report specifications that you create. Just click the Memorize button. QuickBooks displays the Memorize Report dialog box (not shown), which asks you to supply a name for the customized report and assign the memorized report to a report group. After you name and assign the customized report, QuickBooks lists it whenever you choose Reports ⇒ Memorized Reports and then click the report group. You can also access Memorized Reports from the top of the Report Center screen. Whenever you want to use your special report, all you need to do is choose it from the list and click the Report button.
QuickBooks memorizes the print orientation with the report, so if the print orientation isn’t the way you want it for the report, you should change it first by choosing File ⇒ Printer Setup. Select the orientation you want to memorize, click OK, and then memorize the report.
Emailing
If you click the E-Mail button, QuickBooks displays a drop-down menu of commands that lets you email an Excel workbook or a PDF version of the report to someone else. When you choose one of the commands that says you want to email a report, what QuickBooks does depends on whether it sees that you have an email program already set up and installed. If QuickBooks doesn’t see any such program, it displays the Edit E-Mail Information dialog box. If QuickBooks does see such a program, it starts the email program and adds the report to a new message as an attachment.
Exporting
If you click the Excel button and choose Create New Worksheet from the drop-down menu, QuickBooks displays the Send Report to Excel dialog box (see Figure 15-6). You can use this dialog box to create an Excel report that holds the same information as shown in the report. Select the Create New Worksheet radio button to create a new Excel workbook with the report information or the Update an Existing Worksheet radio button to add the report to an existing Excel workbook (which you’ll need to identify when prompted).

FIGURE 15-6: The Send Report to Excel dialog box.
You can also get fancy by exporting a comma-separated-values (CSV) file (these files can be opened by other electronic spreadsheet programs and by database programs) to a specific Excel workbook file and by clicking the Advanced button to display another dialog box that lets you control how the exported information is formatted. If time may be a factor, exporting to CSV can be quicker than exporting large files to Excel. Another benefit of exporting to CSV is that you can open the file in Notepad or other text editors so that you aren’t forced to use (or, if you don’t have it already, buy) Excel or other products.
A friendly suggestion, perhaps? Feel free to experiment with all the special exporting options. Just remember that after you export a QuickBooks report to a new, blank Excel workbook, you can also do any of this fancy-dancey stuff — special formatting and so on — there.
The other buttons and boxes
If you want to see how the Hide Header, Collapse, and Dates stuff works, just noodle around. You can’t hurt anything.
If you change the report dates, click the Refresh button to update the report. To set refresh options for reports, choose Edit ⇒ Preferences. Then click the Reports & Graphs icon in the list on the left and click the My Preferences tab if necessary. Click one of the Reports and Graphs options and then click OK.
Reports Made to Order
If you intend to print a large number of reports — and, more important, if you intend to print a large number of reports and show them to customers, investors, and other significant people — you want your reports to look good and to be easy to understand. I believe that beauty is in the eye of the beholder, so I’m not going to get into the aesthetics of report layouts. What I am going to do is explain how you can make QuickBooks reports look exactly the way you want them to look.
Choose Edit ⇒ Preferences. Click the Reports & Graphs icon in the list on the left and then click the Company Preferences tab to see the Preferences dialog box for reports and graphs (see Figure 15-7).
FIGURE 15-7: The Preferences dialog box for reports and graphs.
You need to be logged in to single-user mode as the administrator to change company preferences. Read how in Appendix C.
Here are your options:
Accrual: Accrual is one of those cruel accounting terms that can be hard to understand at first. If you select the Accrual radio button in the Summary Reports Basis panel, you tell QuickBooks to include all your transactions, sales, purchases, expenses, and so on from the moment they’re recorded, not from the time you receive or pay cash for them.
Accountants follow the accrual method because it provides a more accurate picture of profits. Also, the Internal Revenue Service (IRS) says that big corporations must use accrual accounting for their tax returns.
- Cash: If you select the Cash radio button, all the financial transactions in your reports are counted at the time you make your expense payments and you receive your customers’ payments.
- Age from Due Date: If you select the Age from Due Date radio button in the Aging Reports panel, QuickBooks counts your expenses and invoices from the day that they fall due. Otherwise, QuickBooks counts them from the day they’re recorded.
- Age from Transaction Date: If you select this radio button, QuickBooks counts your expenses and invoices from the day you entered them into QuickBooks.
- Reports – Show Items By/Show Accounts By: You select a radio button in the Reports – Show Items By or Show Accounts By group to indicate how you want QuickBooks to arrange account information on your reports: by name, description, or both name and description.
- Statement of Cash Flows: You click the Classify Cash button to tell QuickBooks how it should handle its accounts when it produces a picture-perfect statement of cash flows using generally accepted accounting principles. A suggestion? Leave this for your CPA.
- Format: Clear the Default Formatting for Reports check box and then click the Format button if you want to improve the appearance of your reports. In the Report Format Preferences dialog box that appears, as shown in Figure 15-8, you can use the Header/Footer tab to choose preferences for displaying the company name, the report title, the subtitle, and so on.
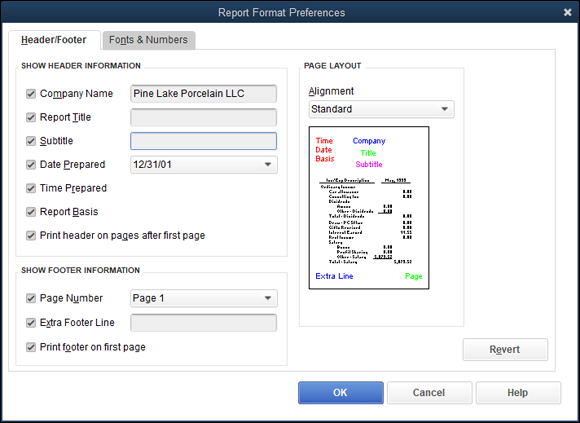
FIGURE 15-8: The Report Format Preferences dialog box.
You can use the Fonts & Numbers tab of the Report Format Preferences dialog box to choose preferences for displaying numbers, decimal fractions, and negative numbers. You also can fool around with different fonts and point sizes for labels, column headings, titles, and other things in your reports.
Click the Revert button in the Report Format Preferences dialog box to undo your customization changes.
Processing Multiple Reports
Want to print several reports at the same time? No problem. Choose Reports ⇒ Process Multiple Reports. When QuickBooks displays the Process Multiple Reports dialog box, as shown in Figure 15-9, select the reports that you want to print or display.
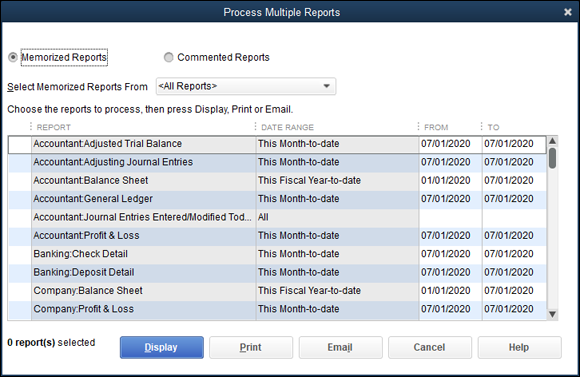
FIGURE 15-9: The Process Multiple Reports dialog box.
Your Other Reporting Options
Some versions of QuickBooks present a handful of additional Reports menu commands. These additional commands are especially numerous in the Enterprise Solutions version of QuickBooks. I’m going to touch on some of these commands ever so briefly:
- Custom Reports: Displays commands that you can use to create reports from scratch, following your specific instructions. These custom reports are pretty easy to use if you’ve noodled around much with the customization options I mention earlier in the chapter.
- Company Snapshot: Displays a window with a bunch of little graphs and tables that summarize various tidbits of financial data: trends in income and expense, big account balances, open invoices, and so forth.
- QuickBooks Statement Writer: Starts the QuickBooks Statement Writer (formerly the Intuit Statement Writer) add-on program that creates financial statements in Microsoft Excel. QuickBooks Statement Writer comes with the Accountant and Enterprise Solutions versions of QuickBooks.
- Combine Reports from Multiple Companies: Enables you to create a consolidated report by using data from more than one QuickBooks company file. When you choose the command, QuickBooks displays a dialog box that you use to identify the company files and the report combination you want. This command is available only in QuickBooks Enterprise Solutions.
Last but Not Least: The QuickReport
The QuickReport is one of the best kinds of reports, so I saved it for last. You can generate a QuickReport from a list, from invoices and bills with names of people or items on them, and from account registers. QuickReports are especially useful when you’re studying a list and see something that momentarily baffles you. Simply make sure that the item you’re curious about is highlighted, click the Reports button, and then choose the QuickReports command for the item from the drop-down menu.
You can also right-click an item and choose QuickReport from the contextual menu to create a QuickReport of the item.
Figure 15-10 shows a QuickReport produced from a register. I clicked the QuickReport button to display this Register QuickReport window with the transaction information for a vendor: Bertha’s Workshop.
The QuickReport option is also on the Reports menu when you have a register or list open. In that case, you can display a QuickReport from a form — even though no QuickReport button appears — by choosing the menu option. If you’re writing a check to a vendor, for example, you can enter the company’s name on the check and choose Reports ⇒ QuickReport to see a report of transactions involving the company.
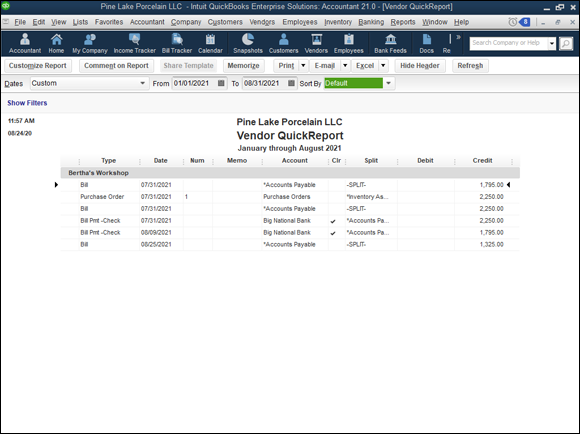
FIGURE 15-10: A QuickReport report.