
Appendix B. An illustrated example
This appendix demonstrates a hands-on approach to Reactive system design, illustrating the tenets of the Manifesto through concrete examples. We encounter these while solving issues that come up when building applications that are scalable to a global user base. Globally distributed interaction is also at the heart of the example problem we will tackle here: you will build an app with which users can share their location in real time and in which they can watch others move on a map. An extension to this core function is that users can exchange text messages with other users in their vicinity.
To be more precise, the location of each individual is used for two purposes:
- Each user can share their location with a set of other users who can track it on a map.
- Each user can share their location in anonymized form so that aggregated data can be displayed to all users (such as, “37 users per hour moving westward on highway 50 through Dodge City, Kansas”).
B.1. Geographic partitioning
How do you construct such an application? One thing is clear: most of the information processing will be local, as in pertaining to some specific place on Earth. Therefore, you need to divide the Earth into regions, starting perhaps with one region per continent (plus some for the oceans). The granularity of countries within each continent varies greatly, so for simplicity you will continue by cutting each continent along lines of latitude and longitude. The result is 16 tiles, 4 by 4, as shown in figure B.1.
Figure B.1. The North American continent, divided recursively into 4-by-4 tiles
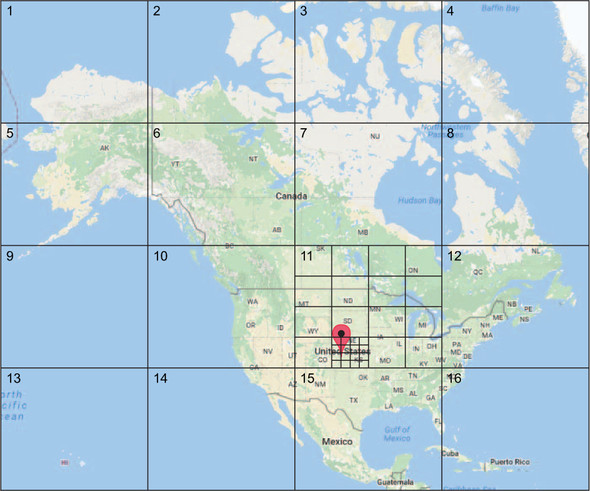
Continue this process recursively, as shown in the figure, quadrupling the resolution in longitude and latitude at each step until it is fine enough—say, less than one mile in either direction.[1] Now you have a way to associate every possible location on Earth with a map region. For example, consider Dodge City, Kansas:
There are more-refined ways to partition a map, but this is a sufficiently simple approach that allows you to concentrate on the essence of the program. For further study, please refer to information about R-trees or other literature.
- It is in North America ...
- ... in tile number 11 (at level 1)
- ... within that in subtile number 14 (at level 2)
- ... within that in subtile number 9 (at level 3)
- ... and so on
When someone shares their location, the lowest-level map tile containing that location must be informed that there is a user positioned within it. Other users looking at the same map tile can register for (anonymized) updates about what happens in that little map area. The influx of position updates for each of these lowest-level map tiles is given by how many users are logged in to the application in that geographic area, and the outflux conversely is given by how many users are watching that precise map tile. Therefore, no matter how many users may eventually be using this application, you can regulate the amount of information processing per map tile by choosing the granularity—which means choosing the number of levels in your partitioning.
The first important point about implementing a Reactive application is thus to identify the minimal unit of processing that can operate independently. You can execute the bookkeeping functions of where people are moving within a map tile separately from the bookkeeping of all other map tiles, possibly on different computers or even in different data centers—each catering to one continent, for example. You can adapt the processing capacity of the overall system to the load by growing or shrinking the number of these processing units: merging two or more into one is not a problem, because they were independent to begin with, so the only limit is given by how fine you can make this split. The result is a system that can be scaled up and down elastically and can thereby react to varying load.
But we are getting ahead of ourselves, because the current design is not yet complete. Users will always—knowingly or not—push applications to their limits, and in this case a simple exploit will ruin your calculations: zoom out on the map tile you are watching, and your interest will cover a large number of map tiles, resulting in a correspondingly large rate of position updates being requested and sent. This will overwhelm the curious user’s client with too much data; and if too many users do this, your expectations about the outflux of data from a map tile will be exceeded. Both of these factors cause more communication bandwidth to be used than you planned for, and the consequence will be system overload and failure.
B.2. Planning the flow of information
In a Reactive application, each part—each independent unit of processing—reacts to the information it receives. Therefore, it is very important to consider which information flows where and how large each of these flows is. The principle data flows for the example application are shown in figure B.2.
Figure B.2. Data are flowing from the clients that submit their position updates through a front end that handles the client connections into the map tiles and on to those clients that are watching the map.

In the example application, you could define that each user sends one position update every 5 seconds while the app is running on their mobile device—phone, tablet, or watch. You can ascertain that by writing the client app yourself or by enforcing this limit in the API that the application offers to the author of client apps. Each position update will amount to roughly 100 bytes, give or take (10 bytes each for timestamp, latitude, and longitude; 40 bytes for lower-level protocol overhead, such as TCP/IPv4; plus additional space for encryption, authentication, and integrity data). Factoring in some overhead for congestion avoidance and message scheduling between multiple clients, you will assume that each client’s position-update stream costs roughly 50 bytes per second on average.
B.2.1. Step 1: Accepting the data
The position updates need to be sent via the internet to a publicly addressable and accessible endpoint; we call this the front-end node. The current lingua franca for such purposes is HTTP, in which case you need to offer a web service that clients contact in order to transmit their data; the choice of protocol may vary in the future, but the fact remains that you need to plan the capacity of this data-ingestion endpoint according to the number of users you expect. The functionality in terms of the processing the endpoint provides is merely to validate incoming data according to protocol definitions, authenticate clients, and verify the integrity of their submitted data. The endpoint does not care about the details of the position; for those purposes, it will forward the sanitized data to the map tile it belongs to.
Common networks today operate at 100–1,000 Mbps. This example conservatively assumes an available bandwidth of 50 Mbps, half of which you will allocate to the reception of position updates; you can therefore arrive at a capacity of 500,000 clients that can be handled by one front-end node. For the sake of simplicity, also assume that this node’s computing resources are sufficient to handle the validation of the corresponding rate of data packets that need to validated, authenticated, and verified—otherwise, you would reduce the nominal capacity per node accordingly.
Given these numbers, it is clear that one node will probably suffice for the initial deployment from a data-rate perspective; you will want to have two in any case, for fault tolerance. Serving the entire world’s population of 7.5 billion people would hypothetically require 14,000 active network nodes for data ingestion, preferably distributed among data centers spread across the planet and with a healthy percentage of spares for redundancy. The important point is that each of these nodes operates fully independently of all the others: no communication or coordination is necessary between them in order to unwrap, check, and route position updates, which enables you to do this simple back-of-an-envelope estimation of what you need to grow this part of the system to a given scale.
B.2.2. Step 2: Getting the data to their geographical home
The function of the front-end node is to accept and sanitize the incoming data and then send it on to the map tile it belongs to. The rough estimate of the data rates likely applies to the sanitized data as well; you will trade data integrity and authentication data for client IDs and associated data. Those were implicit to the client’s network connection with the front-end node, but now they need to be explicitly incorporated in the data packet on the network connection between the front-end node and each map tile for which it receives updates.
Hosting a map tile on a single network node translates to the ability to handle 500,000 clients within that map area. Therefore, the tiles need to be small enough that this limit is never violated. If all map tiles are the same size—that is, if the same level of partitioning is used throughout the entire map—then some tiles will be much more frequented than others. Densely populated areas like Manhattan, San Francisco, and Tokyo will be close to the limit, whereas most of the tiles covering the Pacific Ocean will rarely have anyone move on them. You can account for this asymmetry by collocating a number of low-rate map tiles on the same processing node while keeping high-rate tiles on their own nodes.
Recall that it is crucial for the front-end nodes to be able to perform their work independently of each other, in order to be able to adjust the system capacity by adding or removing nodes; you will see another reason for this when we discuss how to react to failures within the system. But how can you achieve consensus about which map tile is hosted by which internal network node? The answer is that you make the routing process simple and deterministic by having a map tile–allocation service disseminate a data structure that describes the placement of all tiles. This data structure can be optimized and compressed by using the hierarchical structure of the map partitioning. Another consideration is that once this application has grown beyond a single data center, you can route clients to the correct data center that hosts the geographic region in which they are currently located, at which point each front-end node only needs to know the location of tiles for which its data center is responsible.
An interesting question at this point is how you react to changes in your application deployment: when a node dies or is manually replaced, or when map tiles are reshuffled to adapt to changed user habits, how is this communicated to the front-end nodes? And what happens to updates that are sent to the “wrong” node? The straightforward answer is that during such a change, there will be a time window during which position updates pertaining to certain map tiles will be lost. As long as you can reasonably expect this outage to be temporary and on the order of a few seconds long, then chances are, nobody will notice; one or two missing location updates will not have a major effect on the aggregated statistics of a map tile (or can be compensated for), and not seeing a friend’s position move on a map for a few seconds once in a blue moon is unlikely to be of consequence.
B.2.3. Step 3: Relocating the data for efficient querying
You have now ensured that the influx of each map tile will not exceed a certain threshold that is given by the capabilities of the processing hardware. The issue that sparked this foray into data-rate planning was that the outflux is not limited, because clients can zoom out and thereby request and consume more data than they produce and submit.
When you visualize the map that will show the movement of all the anonymized users within its area, what do you expect to see when you zoom out? You certainly cannot follow each individual and track their course once there are more than a handful of them in the region you are looking at. And when you zoom out to view all of Europe, the best you can hope for is aggregate information about population density or average velocity—you will not be able to discern individual positions.
In the same way you designed the information flow for data ingestion, you can look at data extraction. Looking at a map of Europe is an easy case, because it does not require much data: the large-scale averages and aggregate numbers do not change quickly. The largest data demand will be given by users who are being tracked individually while being closely zoomed in. Assume that you allow up to 30 users to be shown individually before switching to an aggregated view, and further assume that you can limit the data consumption of the aggregate view to be equivalent to those 30 tracked points. One update will have to contain a timestamp and up to 30 tuples of identifier, latitude, and longitude. These can presumably be compressed because they are in a small map region, perhaps amounting to 15 bytes for each 3-tuple. Including some overall status information, you arrive at roughly 500 bytes for a single update, which means about 100 bytes per second on average for 1 update every 5 seconds.
Calculating again with an available network bandwidth of 50 Mbps, where half is allocated to client-facing traffic, this yields a capacity of serving 200,000 map views from a single front-end node (subtracting 20% overhead).[2] These front-end nodes are also answering requests from clients, but they are of a different kind than the nodes responsible for data ingestion. When a user logs in to the app, their mobile device will begin sending position updates to the ingestion nodes; and every time the user changes the map view on their device, a request will be sent to the front-end nodes, registering for the updates to be displayed on the screen. This naturally decouples the two activities and allows a user to view a far-away map region without additional headaches for implementers.
Sending from one host to a multitude of others requires less overhead than having a multitude of clients send to a single host. See also the TCP incast problem (www.pdl.cmu.edu/Incast).
At this point, the big question is, where do these map-view front-end nodes get their data? You have so far only provided the position updates to the lowest-level map tiles, and requesting their updates in order to calculate aggregate values will not work: serving 200,000 views could mean having to listen to the updates of millions of map tiles, corresponding to hundreds of terabytes per second.
There is only one solution to this dilemma: you must filter and preprocess the data at their source. Each lowest-level map tile knows the precise location and movement of all users within its geographic region, and it is easy to calculate their number, average movement speed and direction, center of gravity, and other interesting quantities. These summary data are then sent every 5 seconds to the map tile one level up that contains this tile.
As a concrete example, consider that the lowest level is seven partition steps below the North American continent. The center of Dodge City, Kansas, on level 7 calculates the summary information and sends it to the encompassing level-6 map tile, which also receives such summaries from the 15 other level-7 neighbors it contains. The good thing about aggregate quantities such as user count, center of gravity, and so on is that they can be merged with one another to aggregate at higher and higher granularity (summing up the users, calculating the weighted center of gravity of the individual centers, and so on). The level-6 map tile performs this aggregation every 5 seconds and sends its summary up to its encompassing level-5 parent, and this process is repeated all the way up to the top level.
The data rate needed for this transfer is fixed to the size of the summary data packet: once every 5 seconds for each sender, and 16 times that amount for each recipient. You can assume that each data packet should fit within 100 bytes. In many cases, these data do not even need to travel across the network, because sparsely populated map areas are collocated on the same processing node, and the summary levels can be collocated with the lowest-level map tiles as well.
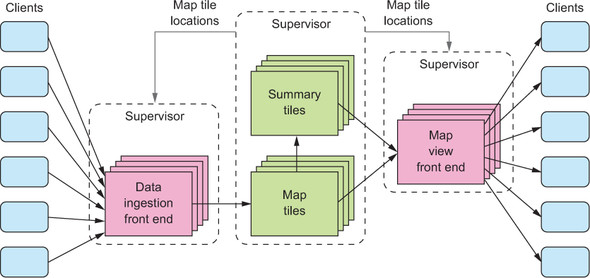
When a map view front-end node needs to access the summary information at level 4 to display a map spanning approximately 100 by 100 miles, it will request the summary information from the roughly 16 level-4 map tiles covering the viewport. Knowing that network bandwidth will likely be the most limiting factor for these view front-end nodes, you can optimize their use internally by redirecting external clients between them such that one front-end node handles many similar requests—for the same approximate geographic region at the same summary level. That way, a node can satisfy multiple clients from the same internal data stream. This is shown in figure .
Figure B.3. The flow of data from data ingestion on the left to the map views on the right, with summary data traveling upward in the hierarchical map tile structure

The one piece that still needs consideration is how to handle the fully zoomed-in case: when a user points their map at Big Ben to see all the tourists milling about in the center of London, care must be taken to not send all the data from that highly frequented map tile to the front-end node, because that could potentially take up all the available bandwidth by itself. We said earlier that a map should display only summary information as soon as the number of individual data points exceeds 30. In this case, the calculation of this summary must happen on the network node that hosts the Big Ben map tile: the request from the front-end node will contain the coordinates of the desired viewport, and the map tile can determine whether to calculate aggregate information or send the updates of up to 30 individual user positions, depending on how many people are moving within the map area in question.
One aspect of this flow diagram deserves mention: it takes a little while for each new piece of information to make its way up to the top. In this example, which has 7 levels, it takes on average about 18 seconds (7 times an average delay of 2.5 seconds). This should not be a problem, though, because the summary information changes much more slowly, the higher up you get in the hierarchy.
B.2.4. Taking stock
What have you achieved so far? You have designed the flow of information through an application as shown in figure B.4. You have avoided the introduction of a single bottleneck through which the data must pass: all parts of the design can be scaled individually. The front ends for data ingestion and map views can be adapted to user activity, and the map data are modeled as a hierarchy of map tiles whose granularity can be chosen by picking the number of partition steps. The processing of the data passing through the map tiles can be deployed onto a number of network nodes as needed, in terms of processing and network resources. In the simplest scenario, everything can run on a single computer—but at the same time, the design supports deployment in a dozen data centers and on thousands of nodes.
Figure B.4. The flows of position updates and summary information through the application, from position updates generated on the left through the map tile hierarchy toward the map views on the right

B.3. What if something fails?
Now that you have a good overview of the parts of the application and the data flows within it, you should consider how failures will affect it. This is not a black art—on the contrary. You can follow a simple procedure: consider every node in your processing network and every data flow link, one by one, and determine what happens if it fails. In order to do this, you need a failure model. A good starting point for a network-based system is the following:
- Network links can drop arbitrary bursts of messages (which includes the case where “the link was down for three hours”).
- Processing nodes can stop responding and never recover (for example, by way of a hardware failure).
- Processing nodes can intermittently fail to respond (for example, due to temporary overload).
- Processing nodes can experience arbitrary delays (for example, due to garbage collection pauses, as for the JVM).
More possibilities of what can go wrong should be considered, and you will need to assess your system requirements carefully to decide what else to include. Other choices are that network links may corrupt data packets; data packets may experience arbitrary delay; processing nodes may respond with erroneous data, or they may execute malicious code and perform arbitrary actions. You also need to consider the effect of executing multiple parts of the application on the same hardware, because this means hardware failure or resource exhaustion can affect all these parts simultaneously. The more vital the function of your application is for your organization, the more detailed the considered failure model should be. For this example case, you will stick to the simple list from the previous bullet points.
B.3.1. A client fails
Mobile devices can fail for a host of reasons ranging from their destruction, to empty batteries, to a software crash. Users are used to dealing with those (replacing the phone, charging it, or restarting the phone or an app), and they do not expect things to work while their device has failed. Therefore, you only need to concern yourself with the effects of a failure on the internal processes of your application.
First, the stream of position updates will cease. When this happens, we might want to generate a visible representation for others who were seeing this user on their map, perhaps changing the color of the marker or making it translucent. The lowest-level map tile will be responsible for tracking whether the users that move within it are alive.
Second, the map view for the client will no longer be able to send updates, network buffers will fill up, and socket writes will eventually time out. Therefore, you must protect the map view front ends from becoming clogged with defunct client registrations. This is commonly done by including a heartbeat signal in the protocol and closing the connection when the heartbeats stop coming in.
B.3.2. A client network link fails
From the perspective of the application, it does not matter why position updates cease: the failure of the mobile device or its software is indistinguishable from a failed network connection. The consequences are thus the same as discussed in the previous section.
From the perspective of the client, on the other hand, in general it is not distinguishable whether the front-end node it was connected to failed or the network link is at fault: both will look largely the same. Hence, the remedy is also the same as discussed in the next section.
B.3.3. A data-ingestion front-end node fails
The role of such a node is to sanitize and forward position updates, so a failure means the client will eventually run into trouble sending data to it. In the same way the map view monitors the health of its client using heartbeats, you can also solve this situation: the client will reconnect to a different front-end node if something goes amiss, regardless of whether the failure is temporary or fatal. This is typically realized by placing a network load balancer in front of the pool of real web service endpoint nodes, a strategy that is possible only because it does not matter exactly which node a client sends its updates through into the system: the gateways are all equally suited.
In any case, the mobile app should let the user know that there is trouble with the connection. This is much better than having the user figure it out via missing activity—that way, you can clearly distinguish between problems local to the app and problems with network communication.
The other action that must be taken upon the failure of a front-end node is to properly dispose of it (stopping the application, taking down the machine) and spin up a new instance that starts from a known good configuration. The precise kind of failure is irrelevant: the overall system returns to a fully fault-tolerant state by doing the most robust, simplest thing possible. Consequently, whatever went wrong is contained within the removed node and cannot spread to the others. The recovery must be initiated by a separate service that cannot be infected with the failure; this is called a supervisor service. The supervisor monitors its subordinates for proper function and, as described, takes corrective action when necessary.
B.3.4. A network link from data ingestion to map tile fails
This situation has no negative impact on the overall function of the application. Its effect is the same as if the connected clients stop sending position updates to the affected map tile. Therefore, depending on which communication protocol is used for this network link, both parties should monitor the health of their connection and release all associated resources if the connection becomes stale.
The simplicity of this problem and of its solution is due to the fact that neither side—front-end node nor map tile—depends on the other for correct function. Data flow in only one direction from one to the other, and if data stop flowing, both sides know how to deal with the situation. This is called loose coupling, and it is essential for achieving robust failure handling.
B.3.5. A map tile–processing node fails
Because this is the heart of the application, we will consider the different failure modes more carefully:
- Hardware failure— In case of a node crash, all map tiles that were hosted by this node will be failed with it. The front-end nodes will eventually notice and stop sending updates, but you need to recover from this situation. The front ends cannot be responsible for that, because it would involve coordination of who performs the necessary steps. Therefore, you install a supervisor service that monitors all map tile nodes and spins up a new instance in case of a crash. We discussed earlier that this service will then update the routing knowledge of all front-end nodes so they begin sending updates to the new destination.
- Temporary overload— If a map tile sees more traffic than was planned for, it will need to be moved to a separate processing node; otherwise, it will take resources from all of its collocated neighbors, and the overload will spread and turn into a node failure. This scenario must also be handled by the supervisor service, which for this purpose needs to gather usage statistics and, if necessary, rebalance the map tiles across the available nodes. If the load is increasing in all parts of the system, then this supervisor should also be able to request that new nodes be brought online so the additional load can be handled. Conversely, once load drops significantly, the supervisor should reallocate map tiles to free up and release redundant nodes.
- Permanent overload— It is also possible that the partitioning of your map is not adequate and a single map tile is hit consistently by too many requests. Because you cannot split or reallocate this map tile, such a failure will need to raise an alert when it is detected, and the system configuration must be adapted manually to correct the mistake.
- Processing delays— In some cases, the inability to process new data lasts only a few seconds (for example, while the JVM is performing a major garbage collection cycle). In such cases, no specific recovery mechanism is necessary beyond possibly dropping some updates that are outdated by the time the machine comes back to life. There is a point, of course, where such an interruption is mistaken for a node crash; you will have to configure the supervisor service to tolerate pauses up to a given duration and take corrective measures once that is exceeded.
As in the case of a front-end node failure, you need a supervisor service that keeps an eye on all the deployed processing nodes and can heal the system in case of failure by using its global view and, if necessary, disposing of faulty instances and creating fresh ones. The supervisor does not become a bottleneck in the system because you keep it outside of the main information flows of the application.
B.3.6. A summary map tile fails
These processing units are very similar in function to the lowest-level map tiles. They are part of the same information routing infrastructure, so you supervise them in the same fashion.
B.3.7. A network link between map files fails
This case is similar to front-end nodes being unable to forward position updates to map tiles—data will not arrive while the failure lasts. You need network monitoring in place so the operations crew is notified and will fix the issue; other than that, you have to throw away data as they grow stale. This last part is important to avoid the so-called thundering herd problem when network connectivity is restored: if all data are buffered and then sent at once, the destination will likely be overloaded as a result. Fortunately you do not need to buffer data for long periods of time in this part of the application, because all you are modeling is a live view on a map with no historic information; lost updates are a fact of life.
B.3.8. A map view front-end node fails
In this case, you can act in the same fashion as for the data-ingestion front-end nodes: you have clients reconnect through a load balancer as soon as they determine something is wrong, and you have a supervisor service that disposes of nodes and provisions new ones when needed. The latter actions can also occur in response to changes in load; this way, monitoring by the supervisor enables the system to elastically scale up and down.
There is one more consideration in this situation: map view updates are sent by the map tiles according to the front ends’ registrations. If a front end becomes unavailable and is replaced, then map tiles need to stop sending data their way as soon as possible, because the new client registrations that replace the failed ones will soon take up their share of the planned bandwidth again. Therefore, map tiles need to pay attention to their connections with map views and drop updates when they cannot be transmitted in a timely fashion.
B.3.9. Failure-handling summary
As we systematically walked along all data flows and considered the consequences of node and communication failures, we encountered two main needs:
- Communication partners frequently are required to monitor the availability of their interlocutors. Where no steady stream of messages is readily available, traffic can be generated using a heartbeat mechanism.
- Processing nodes must be monitored by supervising services in order to detect failures and load problems (both over- and under-utilization) and take corrective action.
Figure B.5 shows the complete deployment structure of the example application with the added supervisors. It also notes that the service supervising the map tiles must inform both types of front-end nodes about the current mapping where each map tile is hosted.
Figure B.5. Deployment structure of the application, with supervisor services and their relationship: the map tiles’ supervisor informs the front-end supervisors about where position updates and map view registrations should go.
B.4. What have you learned from this example?
We have modeled an application that can serve any number of clients, allowing them to share their location and see how others are moving on a map. The design is such that you can easily scale its capacity from trying it on a development notebook—running all parts locally—to, hypothetically, supporting use by all humans on Earth. Doing so would require considerable resources, and their operation would require a large effort, but from the technical side, the application is prepared. You have achieved that by considering foremost the information that will be processed by the application and the main flows of data that are necessary.
The most important characteristic is that data always flow forward from their source (position updates of mobile devices) via processing stages (map tiles) toward their final destination (the map displayed on mobile devices). The processing nodes on this path of information are loosely coupled in that failures of one are dealt with the same way as communication outages.
You build resilience into a design by considering the major parts of the application to be isolated from each other, communicating only over networks. If multiple parts are running on the same machine, a failure of the machine—or resource exhaustion caused by one part—will make all of them fail simultaneously. It is especially important for achieving fault tolerance that the services tasked with repairing the system after failures—the supervisors—are isolated from other parts and are running on their own resources.
In this way, you have experienced all the main tenets of the Reactive Manifesto:
- The application is responsive due to resource planning and map partitioning.
- The application is resilient because you built in mechanisms to repair failed components and connect to properly functioning ones.
- The application is elastic because it monitors the load experienced by the different parts and can redistribute the load when it changes, a feat that is possible due to the lack of global bottlenecks and processing units that can work independently of each other.
- All of this is enabled by message-driven communication between the parts of the application.
B.5. Where do you go from here?
The attentive reader will have noticed that not all functionality has been implemented for the example application. We have detailed how to implement the second requirement of sharing anonymized position updates, but we left out the first requirement that a user should be able to share their location with a set of other users. It will be a good exercise to apply the same reasoning in this case, designing additional parts of the application that keep data in a user-centric fashion rather than the map-centric one you have built so far. Modifications of the trust relationship between users will have to be processed more reliably than position updates, but they will also be vastly less frequent.