
Sealed Lead Cells and Batteries
Starved-electrolyte sealed-lead batteries are the most advanced form of lead battery in use today. Because of their demonstrated superior performance and reliability, these batteries are essential components of a variety of products ranging from inexpensive toys and consumer products to telecommunications systems and aircraft. The features that make starved-electrolyte sealed-lead cells and batteries the choice for such diverse applications are briefly described below.
FEATURES AND BENEFITS
Among the areas where this form of lead battery offers advantages are the following:
Excellent Performance
Performance remains the key concern of many designers. By taking advantage of the superior performance of the starved-electrolyte sealed-lead design, they can often use smaller batteries with resulting savings in weight and volume throughout the system.
Discharge Currents — The thin-plate, low-impedance design of many sealed-lead cells and batteries gives much higher discharge currents than traditional designs of the same rating. Currents as high as 12C are available at usable voltages.
Power Density — Thin plates and minimum amounts of electrolyte mean more of the battery’s weight and volume may be devoted to active materials.
Low-Temperature Performance — No battery likes low temperatures for discharge, but the starved-electrolyte design minimizes cold weather problems.
Voltage Maintenance — The decline in voltage from the beginning to the end of discharge has often caused problems for application designers using classic lead batteries. With starved-electrolyte sealed-lead cells and batteries, the voltage delivery characteristic is very good, especially at higher discharge rates and at temperature extremes. Many of the design compromises necessary due to voltage variation may be eliminated with these batteries.
Long Life
Starved-electrolyte sealed-lead batteries have demonstrated an enviable longevity whether they are used in float or cyclic duty or just kept in storage.
Float — These batteries, when properly charged, offer up to 10 years’ life at room temperature before their capacity drops to 80 per cent of its rated value.
Cyclic — Starved-electrolyte sealed-lead batteries outperform other lead batteries when used in cyclic service.
Storage — The self-discharge rate for many starved-electrolyte sealed-lead batteries is very low. This not only makes storage easier, but products are much more likely to come from storage with some residual capability available. This is especially important in some consumer applications where the purchaser expects to see the product operate straight out of the box, even before he has charged it.
Simplified Charging
Trying to find a charging scheme that would bring the battery to full charge in all conditions without damaging overcharge used to be a major concern. The result was often unsatisfactory. The gas recombination within the starved-electrolyte battery greatly improves its ability to accommodate overcharge, giving designers a new freedom in tailoring the charger to the application.
Float Charging — Charging batteries on float is a sensitive problem—too little charging and the battery will not discharge properly when next needed, but too much charging can shorten the battery’s life. Starved-electrolyte sealed-lead batteries may be charged either by constant-voltage or two-step constant-current methods to obtain maximum life while providing adequate discharge performance.
Fast Charging — Because of their construction, starved-electrolyte sealed-lead batteries will accept high charge currents without the water loss that curtails the life of other lead batteries. By using a constant-voltage charger set at the proper voltage, fully discharged batteries can be brought back to a high level of charge (80–90 per cent) in less than an hour.
Design Flexibility
Conventional lead-acid batteries are normally unwelcome guests—tolerated because of their usefulness, but disliked because of their nasty habits. Many applications require that conventional batteries be isolated in separate compartments made from acid-resistant materials with independent venting and drainage systems. Starved-electrolyte cells and batteries do not require this special treatment. Since spillage and corrosion are not problems, these batteries do not have to be separated from other equipment. In fact even sensitive applications, such as computers and aircraft, now locate starved-electrolyte batteries among other electronic equipment. And, these batteries no longer have to be mounted vertically; allowing equipment designers enhanced design flexibility.
Elimination of Maintenance
Inexpensive batteries that require routine maintenance often turn out to be no bargain at all. It is easy to spend far more than the initial cost of the battery in labor cost for regular upkeep over the life of the battery. Plus, equipment that requires maintenance may be incorrectly maintained. If the battery has to be accessible for regular maintenance, the designer loses some latitude in choosing a location for it. Freedom from all of these liabilities is among the reasons that the maintenance-free starved-electrolyte products have made such a strong showing in remote and distributed applications.
Ruggedness
Starved-electrolyte sealed-lead batteries are tough. Not every one is concerned that the battery continue to perform for a short period of time (and not leak) when it is punctured by shrapnel. But the military services do care. This is one reason that they have selected starved-electrolyte batteries for many of their applications. On a more mundane level, consider electric-start walk-behind lawn mowers. This seemingly innocuous application is a torture test for batteries. Batteries are often located in hot, high-vibration environments. Their use can be sporadic, but intense. The charging systems are relatively crude. And, the end-user knows and cares little about proper treatment of the battery. It is a great testimonial to starved-electrolyte sealed-lead batteries’ ruggedness that they are the battery of choice for this demanding application.
APPLICATION EXAMPLES
With the attributes described above, it is little surprise that starved-electrolyte batteries have found uses in a wide array of equipment. Some examples include:
SECTION CONTENTS
The remainder of this section provides information useful in properly selecting the correct starved-electrolyte battery for an application and then designing that battery into the system. For most effective use of sealed-lead cells and batteries, the reader is strongly encouraged to read Section 4 in its entirety. It begins with a discussion of discharge performance in Section 4.1 since this information is vital to selecting the proper battery for the application. Then once the battery is selected, it must be charged correctly so that it will supply the needed discharge performance without adversely affecting its life. Suggestions for tailoring charging to the application are provided in Section 4.2. Since nearly every battery is stored at some point in its life, Section 4.3 explains how to store sealed-lead batteries and cells. Understanding the tradeoffs that affect battery life is the theme of Section 4.4. Section 4.5 provides a variety of applications information on sealed-lead products. Included is a discussion comparing the economic benefits of batteries, information on packaging and location options, operating environment considerations in using sealed-lead batteries, and a brief discussion of typical applications. Since testing is often the only way to understand how a battery will perform in a specific application, Section 4.6 describes some approaches to battery testing and specification. Finally, Section 4.7 covers the safety precautions that apply to sealed-lead products.
NOTE TO THE READER
Small lead-acid batteries for industrial and consumer applications are supplied in a variety of forms. In general, the sealed, starved-electrolyte versions of these batteries are the most advanced and probably the most common. But, because of the diversity of design techniques used to produce these batteries, there are greater variations among manufacturers or even among product lines than typical of sealed nickel-cadmium cells. The information presented in Section 4 and Appendix B has been developed by Gates Energy Products with specific reference to its line of starved-electrolyte sealed-lead batteries. This information is believed to be generally representative of the performance of other manufacturers’ starved-electrolyte sealed-lead batteries. However, all product designers should verify performance information with the battery manufacturer prior to committing to a design.
The material in Section 4 is intended to describe in general terms the performance of starved-electrolyte sealed-lead cells and batteries. In most cases, little quantitative information is provided by the text or figures presented in Section 4. Instead, Appendix B is designed to complement Section 4 by providing up-to-date, quantitative performance data pertinent to current starved-electrolyte sealed-lead battery production from Gates Energy Products. As appropriate, the information in Appendix B may be provided for all production versions or may be specific to one cell or battery size. Both Section 4 and Appendix B focus on the electrical performance of sealed-lead cells and batteries. Physical design data (dimensions, electrical terminations, etc.) for sealed-lead cells and batteries are readily available from the manufacturers.
4.1 Discharge Characteristics
The purpose of including a battery in a product design is to obtain electrical current from it. In using a battery, a product designer normally has two questions or concerns: 1) How long will the battery supply the current needed by the product? and 2) How will the voltage behave over the course of the discharge? This section discusses how the current and voltage supplied by sealed-lead batteries vary in response to a wide range of load-related and environmental conditions.
A significant design advantage of starved-electrolyte cells and batteries is their versatility in discharge performance. One product design provides superior performance in applications ranging from starting engines to providing memory backup for computer equipment. Thus battery users may use the same battery to handle widely varying product load scenarios.
4.1.1 GENERAL
Before getting into the specifics of discharge performance, some general comments on how batteries perform on discharge are pertinent.
4.1.1.1 Discharge Types
In talking about battery capacity and discharge performance, it is sometimes useful to compare a battery to a jar containing molasses. Extracting power from a battery is like turning the jar upside down—you can get a lot out very quickly. But in both cases, there is a significant residue that does not come out in the first rush. To totally deplete either they must be allowed to trickle discharge for many hours. With a battery, it is important to remember that the performance differences between a quick discharge and a long, slow, total discharge may be quite significant.
There are three general classes of discharges for which sealed-lead batteries are typically applied. Each one of them has its own design considerations and each serves substantially different forms of applications. The differentiating parameter is the rate of discharge—whether it is high, medium, or low. Some considerations regarding each category will be presented below.
4.1.1.1.1: High-Rate Discharges Typically high-rate discharges are described as anything above 4C. The primary application of interest here is starting engines where the discharge rate requirement may be quite high (over 10C). The discharges normally last only a few seconds each, although there may be several pulses in a train. Certain appliance applications may also have discharge rates that approach the lower end of the high-rate category.
4.1.1.1.2: Medium-Rate Discharges Stepping down from the high-rate applications, there is a family of applications clustered around the 1C rate. Among the products that often need a battery that is good for a half hour to about two hours are many portable appliances, backup power for alarm and emergency lighting, and uninterruptible power supplies. In many respects, these are the easiest discharges for the battery to handle, neither too high nor too low.
4.1.1.1.3: Low-Rate Discharges Low-rate applications are those with a discharge rate below 0.2C, i.e. applications that require the battery to last more than about five hours. This may be anything from an instrument that is required to operate for an eight-hour shift to microprocessor memory holdup that must provide current for a week or more. These discharges may remove essentially all the capacity and thereby place great strain on a battery.
4.1.1.2 Design for Discharge Performance
Any battery is the result of a multitude of design compromises, many of which may affect its behavior during discharge. To understand how discharge performance varies with changing loads or changes in the surrounding environment, it helps to understand a little about discharge mechanisms. In particular, the discharge process has two components: an early phase and a long-term phase.
The early phase is dominated by surface reactions. There is not time for transport mechanisms to have much impact, so all the activity is concentrated at the interface between the plate active material and the electrolyte. To maximize short-term response, i.e. that needed for high-rate performance, the plate surface area per unit volume should be a maximum. Advanced sealed-lead batteries use thin plates increasing the surface area available for reaction within a given volume. The result is enhanced high-rate performance.
For long-term response, i.e. the response to a deep, slow discharge, surface effects are less important. Here there is time for transport mechanisms to come fully into play. This means all of the active materials, not just the surface layer, may be involved in the reactions. The key parameter in determining deep-discharge performance is the weight of active material per unit volume of battery. Starved-electrolyte sealed-lead batteries obtain superior performance in deep discharge through elimination of excess electrolyte which increases the proportion of the battery’s weight devoted to other active materials. The result is energy densities which give good performance in deep cycle applications.
4.1.2 MEASURES OF DISCHARGE PERFORMANCE
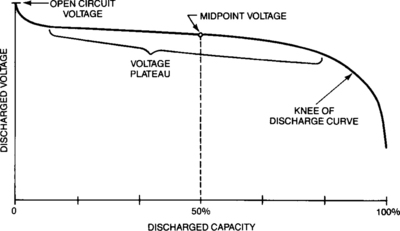
The discharge parameters of concern are cell (or battery) voltage and capacity (the integral of current multiplied by time). The values of these two discharge parameters are functions of a number of application-related factors as described in this section. The general shape of the discharge curve, voltage as a function of capacity (or time if the current is uniform), is shown in Figure 4-1. The discharge voltage of the starved-electrolyte sealed-lead battery typically remains relatively constant until most of its capacity is discharged. It then drops off rather sharply. The area of relatively constant voltage is called the voltage plateau. The flatness and the length of this plateau relative to the length of the discharge are major features of these sealed-lead cells and batteries. The point at which the voltage leaves the plateau and begins to decline rapidly is often identified as the knee of the curve.
The discharge curve, when scaled by considering the effects of all the application variables, provides a complete description of the output of a battery. Differences in design, internal construction, and conditions of actual use of the battery affect one or both of these performance characteristics (voltage or capacity).
The remainder of Section 4.1 will define the discharge curve in terms which will allow the construction of a complete discharge curve (voltage vs. both capacity and run time) for any cell (battery) proposed for an application using variables and parameter values appropriate to that application.
4.1.2.1 Capacity Stabilization
One consideration in evaluating the discharge performance of some sealed-lead cells and batteries is the early rise in capacity. Part of the manufacturing process for all lead cells or batteries is the conversion of the pastes on the electrodes into the active materials needed for successful operation of the cell. This final step in the manufacturing process, called formation, does not normally proceed to completion; some of the paste remains unconverted. The early use of the battery completes the conversion process as the battery is charged in service. The result is growth in battery capacity until the battery stabilizes at a level that may actually be greater than 100 per cent of the nominal capacity. Unless noted, all results presented in Section 4 and Appendix B refer to stabilized values.
4.1.3 BATTERY CAPACITY
The first question that any designer is likely to ask about a battery is “Will it power my product?” This question is usually then refined somewhat: “Will the battery provide adequate current (or adequate power) for the intended length of operation for the product?” Only after these questions about the capacity of the battery have been answered affirmatively, are other concerns (about voltage maintenance, etc.) voiced. Thus, this section first presents information on battery capacity under varying conditions and then moves into more detailed discussions of equivalent circuits, voltage behavior and so on.
The capacity delivered by a cell is the integral of current (electron flow) over time which equates to the gross number of electrons supplied by the cell to the outside circuit. The number of electrons that the cell will supply is a function of both how the cell is used (current flow, charge method, duty cycle) and the environment in which it is used, i.e. operating temperature. This section will refine the various definitions of capacity and then describe the parameters that affect the capacity a cell will deliver. Capacity is generally measured in terms of ampere-hours or some other current-time product. Knowing the behavior of the cell’s voltage under discharge, this capacity translates easily to watt-hours, volt-ampere-minutes or some other measurement of the amount of energy that the cell can deliver to the load.
The energy that may be obtained from a sealed-lead cell is dependent primarily upon the discharge current rate, the temperature of the cell, and the conditions under which the cell was charged. Essentially, the charging conditions determine the amount of energy stored within the cell, while the discharging conditions determine how much of that energy is accessible for discharge. The effects of these parameters will be discussed later in this section.
4.1.3.1 Battery Capacity Definitions and Ratings
Battery or cell capacity simply means an integral of current over a defined period of time.
This equation applies to either charge or discharge, i.e. capacity added or capacity removed from a battery or cell. Although the basic definition is simple, many different forms of capacity are used in the battery industry. The distinctions between them reflect differences in the conditions under which the capacity is measured. Commonly used capacity terms are introduced in Table 4-1 and summarized below.
Table 4-1
Capacity Terminology Definitions
| Standard Conditions | = Laboratory Conditions: charge/rest/discharge rates/voltage/temperature |
| Standard Capacity | = Cell capacity measured under standard conditions. |
| Rated Capacity | = The minimum standard capacity. |
| Actual Capacity | = Capacity of a fully charged cell measured under non-standard conditions except standard end of discharge voltage (EODV). |
| Retained Capacity | = Capacity remaining after a rest period. |
| Available Capacity | = Capacity delivered to a non-standard EODV. |
| Dischargeable Capacity | = Capacity which a cell can deliver before it becomes fully discharged. |
Standard capacity measures the total capacity that a relatively new, but stabilized production cell or battery can store and discharge under a defined standard set of application conditions. It assumes that the cell or battery is fully formed, that it is charged at standard temperature at the specification rate, and that it is discharged at the same standard temperature at a specified standard discharge rate to a standard end-of-discharge voltage (EODV). The standard end-of-discharge voltage is itself subject to variation depending on discharge rate as discussed in Section 4.1.7.
Since cells (or batteries) coming from production may have slight variations in capacity, the value of standard capacity may lie anywhere within the statistical distribution of capacity as manufactured. Figure 4-2 illustrates a typical capacity distribution. Unless otherwise stated, this Handbook uses standard capacities.

When any of the application conditions differ from standard, the capacity of the cell or battery may change. A new term, actual capacity, is used for all nonstandard conditions that alter the amount of capacity which the fully charged new cell or battery is capable of delivering when fully discharged to a standard EODV. Examples of such situations might include subjecting the cell or battery to a cold discharge or a high-rate discharge.
That portion of actual capacity which can be delivered by the fully charged new cell or battery to some nonstandard end-of-discharge voltage is called available capacity. Thus, if the standard EODV is 1.6 volts per cell, the available capacity to an end-of-discharge voltage of 1.8 volts per cell would be less than the actual capacity.
Cells and batteries are rated at standard specified values of discharge rate and other application conditions. Rated capacity (C) for each cell or battery is defined as the minimum standard capacity to be expected from any example of that type when new but fully formed and stabilized. The rated value must also be accompanied by the hour-rate of discharge upon which the rating is based (e.g. 1 hr, 5 hr, 10 hr, 20 hr, etc). The rated capacity for each sealed-lead cell and battery type produced by Gates is indicated in Appendix B.
Rated capacity is always a single specific designated value for each cell or battery model (type, size and design), as contrasted with the statistically distributed values for all other defined capacities. Thus a group of D cells with a rated capacity of 2.5 amp-hours might have standard capacities ranging from 2.5 to 3.0 amp-hrs with an average of 2.65. The Gates process for the manufacture of sealed-lead cells (and batteries) produces a comparatively tight spread in the overall distribution of standard capacity as shown in Figure 4-2.
Figure 4-2 refers to single-cell capacity and NOT multi-cell battery capacity. In any multi-cell battery, the lowest capacity cell in the battery determines its capacity. The distribution of battery capacity, therefore, has the same minimum value as in Figure 4-2 (rated capacity), but its maximum capacity may be somewhat reduced. This reduction depends on the number of cells in the battery and the width (statistical variance) of the capacity distribution of the particular population of cells from which the batteries are actually constructed. If only identical capacity cells were used within each battery, the distribution of battery capacity would be the same as the distribution of cell capacity.
If a battery is stored for a period of time following a full charge, some of its charge will dissipate. The capacity which remains that can be discharged is called retained capacity. Section 4.3 discusses storage and its effect on capacity.
4.1.3.2 Measurement of Fully Charged Capacity
The capacity of a cell, or battery, is normally measured by completely discharging it while integrating the current over the period of the discharge. Variations in the capacity measurement procedure can result in data inconsistencies.
The most common method of measuring capacity is to discharge the battery with a constant-current load. The load circuit adjusts to maintain a constant discharge current as the battery voltage declines. Recording battery voltage versus time results in a discharge curve similar to Figure 4-1. Calculation of discharged battery capacity is thus only a multiplication of the time needed to reach the specified end-of-discharge voltage (EODV) times the current. An added refinement is the simultaneous use of a current integrator or current shunt to ensure that the load is stable and accurate in maintaining the constant current. A variety of packaged loads designed specifically for constant-current discharges are available for capacity measurement.
An older, less common, and less accurate method of measuring capacity is to place a fixed resistance load across the battery terminals and monitor the voltage as a function of time as the battery discharges. With a fixed resistance, the current decreases as the battery voltage declines. A recorder is used to record the voltage drop across the resistor. The discharge recording of resistor voltage drop is translated to current and then manually integrated over time to calculate the discharged capacity. Use of a current integrator in the circuit can speed the capacity measurement. Unfortunately, the discharge current, which influences actual battery capacity, is variable in this procedure. Thus, relating the results to other application conditions can be quite difficult.
Measured battery capacity depends also on the end-of-discharge voltage used in the measurement. For most accurate results in measuring total battery capacity, the voltage used to terminate the discharge should be below the knee of the discharge curve. This simply means that the end of the discharge should occur after the battery has left the flat plateau of the discharge curve and the voltage is falling rapidly.
Higher values of EODV, when used in measurement procedures, may decrease the accuracy of the results. For EODV’s on the voltage plateau, for example, voltage is dropping slowly with time, so small errors in measured voltage may result in significant errors in the time (capacity) to the end of the discharge. Once the battery is off the plateau, the voltage falls very rapidly and the remaining effective capacity is slight so there is little capacity difference between different EODV’s.
4.1.3.3 Capacity as a Function of Discharge Rate
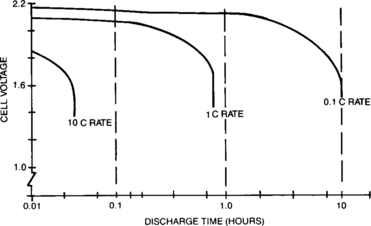
The rate at which current is drawn from a battery affects the amount of energy which can be obtained. At low discharge rates the actual capacity of a battery is greater than at high discharge rates. This relationship is shown in Figure 4-3. See Section 4.1.3.7 for a more detailed discussion of capacity ratings.

The information from Figure 4-3 can be used to create a valuable curve of run time versus discharge rate such as shown in Figure 4-4. This shows the amount of time that a certain size of sealed-lead cell or battery will support a given discharge current at room temperature. The data presented in this chart should be regarded as nominal performance for a fully charged battery that has been stabilized at full capacity. Differing conditions, either relating to the battery or the environment, can affect these nominal values.

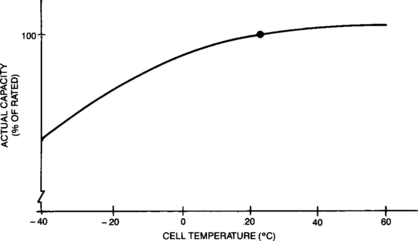
4.1.3.4 Capacity as a Function of Battery Temperature
Starved-electrolyte sealed-lead batteries may be discharged over a wide range of temperatures. They maintain adequate performance in cold environments and may produce actual capacities higher than their standard capacity when used in hot environments. Note that the discharge temperature of concern is that experienced by the active materials within the battery. The time required for a battery to come to thermal equilibrium with its environment may be significant.
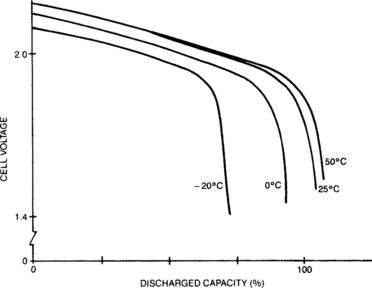
Figure 4-5 indicates the relationship between capacity and cell temperature. Actual capacity is expressed as a percentage of rated capacity as measured at 23°C. Quantitative derating curves for the effects of non-standard discharge temperature are presented in Appendix B.
4.1.3.5 Capacity During Battery Life
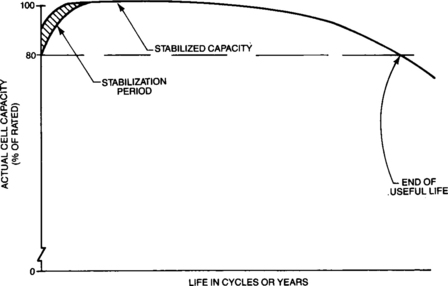
The initial actual capacity of sealed-lead batteries is almost always lower than the battery’s rated or standard capacity. However, during the battery’s early life, the actual capacity increases until it reaches a stabilized value which is usually above the rated capacity. The number of charge-discharge cycles or length of time on float charge required to develop a battery’s capacity depends on the specific regime employed. Alternatively if the battery is on charge at 0.1C, it is usually stabilized after receiving 300 per cent (of rated capacity) overcharge. The process may be accelerated by charging and discharging at low rates.
Under normal operating conditions the battery’s capacity will remain at or near its stabilized value for most of its useful life. Batteries will then begin to suffer some capacity degradation due to their age and the duty to which they have been subjected. This permanent loss usually increases slowly with age until the capacity drops below 80 per cent of its rated capacity, which is often defined as the end of useful battery life. Figure 4-6 shows a typical representation of the capacity variation with cycle life that can be expected from sealed-lead batteries.
Section 4.4 discusses in more depth the amount of time or number of cycles that can be expected prior to end of useful life.
4.1.3.6 Effect of Pulse Discharge on Capacity
In some applications, the battery is not called upon to deliver a current continuously. Rather, energy is drawn from the battery in pulses. By allowing the battery to “rest” between these pulses, the total capacity available from the battery is increased. Figure 4-7 presents typical curves representing the voltage delivered as a function of discharged capacity for pulsed and constant discharges at the same rate. For the pulsed curve, the upper row of dots represents the open-circuit voltage and the lower sawtooth represents the voltages during the periods when the load is connected. The use of discharged capacity as the abscissa eliminates the rest periods and shows only the periods of useful discharge. Because each application is unique, individual testing should be performed to evaluate the relative capacity gain of pulse discharge compared with continuous discharge.
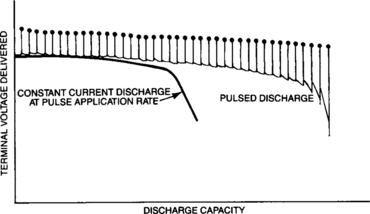
The significant difference between total discharge capacity values for pulsed and for steady current discharge is caused by a phenomenon known as concentration polarization. When current is delivered by the battery, the active material in the plate interacts with the electrolyte to reduce the concentration of the acid in the immediate vicinity of the plate. Since the amount of electrolyte available in the plate pores is less than that required for complete discharge, the delivered capacity at continuous high rate will be limited. However, when time is allowed for the acid to diffuse from the separator back into the pores of the plate, such as during the rest period when pulse discharging, the overall capability to deliver energy is increased.
4.1.3.7 Battery Capacity Ratings vs. Discharge Rate
Battery performance may be rated differently depending on battery type and application. This can be confusing for the designer trying to find a suitable battery for a specific application. Most of the confusion centers around the discharge rates used to specify the capacity of a cell or battery and relates to the fact that the deliverable capacity varies inversely with the discharge rate.
Some batteries are rated at the one-hour rate, some at the five-hour rate, some at the 10-hour rate while many specify capacity at the 20-hour discharge rate.
Table 4-2 shows the nominal capacity of sealed-lead batteries at a variety of different rates. Notice that the batteries at the 20-hour rate have about 8 per cent more capacity than at the 10-hour rate.

If all batteries were rated on the same basis, it would be easier to compare one type against another by just considering the data on the battery label. But even then, the relative performance differences between two battery types at one set of conditions may well be different from their relative performance at another set of conditions. Thus, even though battery ratings are a convenient shorthand, the only reliable way to select a battery is to examine actual performance data for candidate batteries at the desired application conditions.
4.1.4 CELL EQUIVALENT DISCHARGE CIRCUIT
A battery, unlike many electrical energy sources, has a variable source voltage as well as internal losses that impact the voltage available to the external circuit. The Thévenin equivalent-circuit model is a helpful aid in understanding the discharge capabilities of a cell and how these capabilities may vary. Figure 4-8 shows the equivalent-circuit diagram for a sealed-lead cell.
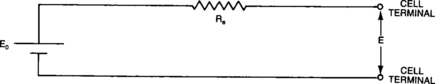
When a load is connected to the cell terminals, current will flow from the cell into the load and the voltage at the cell terminals (E) is the familiar Thévenin circuit formula:
where: E = Cell terminal voltage
Eo = Effective no-load cell voltage
Re = Effective internal resistance
4.1.4.1 Effective No-Load Cell Voltage, E0
The effective no-load voltage (Eo) of a sealed lead cell is a function of the average specific gravity and temperature of the sulfuric acid electrolyte in the cell. When the cell is fully charged, the specific gravity will be at its peak and, correspondingly, the Eo voltage will be at its highest. As the cell discharges, the specific gravity of the electrolyte declines as the acid is gradually converted to water. The no-load voltage of the cell correspondingly decreases as shown in Figure 4-9.

The no-load voltage, Eo, discussed in this section differs from the open-circuit voltage of a cell. The effective no-load voltage discussed here is the Thévenin circuit equivalent voltage which is determined by plotting discharge voltage, at a specific state of charge, against discharge rate and extrapolating to zero rate.
4.1.4.2 Effective Internal Resistance, Re
The effective internal resistance (Re) is a gross value comprised of a number of smaller contributors which appear in the equivalent circuit analysis as resistive elements. These include the resistivity of the plate grids, the lead posts, and the terminals, and the interface contact resistance between these parts. But, the classic resistive elements represent only a portion of the total Re. Another portion comes from the electrochemical system of the cell including resistance to ionic conduction within the electrolyte, the interface of the electrolyte with the active materials of the plates, and the resistivity of the active materials and their interface with the plate grids. All of these contributors, which when added together make up the total Re of the cell, will vary independently as a function of changing conditions. The electrochemical components, for example, are affected dramatically by the specific gravity changes of the electrolyte in the cell. The various parameters affecting the gross Re of the cell are discussed in the following paragraphs. Techniques for measurement of Re are discussed in Section 4.6.
4.1.4.2.1: Re as a Function of State of Charge When the cell is fully charged the electrolyte is at its highest state of concentration (highest specific gravity). As the cell discharges, the sulfate ion concentration decreases. This reduction in available current carriers is seen as higher internal resistance in the Thévenin circuit. Figure 4-10 shows this relationship. Notice that no substantial impact occurs until the cell state of charge falls below 25 per cent. Only a gradual increase in Re occurs from full charge down to 25 per cent state of charge (75 per cent depth of discharge) and then it increases rapidly as capacity approaches zero.

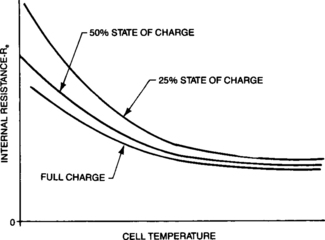
4.1.4.2.2: Re as a Function of Temperature All the resistive elements (both classically resistive and electrochemical) in the cell are affected by cell temperature. The classically resistive elements vary with temperature on an essentially linear basis. The electrochemistry of the cell has a larger impact on the total Re. This relationship is definitely not linear. At high temperatures the conductivity of the electrolyte is quite good and ionic flow is rapid. As the temperature decreases the conductivity decreases. When the electrolyte approaches its freezing point, its conductivity drops rapidly. Since the freezing point of the electrolyte is a function of the specific gravity, the conductivity of the electrolyte not only depends on temperature but also on the cell state of charge. The effect of temperature on the gross Re, combining both classical and electrochemical elements, is shown in Figure 4-11. The effects of states of charge are also shown.
4.1.4.2.3: Re as a Function of Cell Life One important effect on the internal resistance of a cell as the cell ages is the increase in the contact resistance between the active material of the plates and the plate grid. The resulting increase in internal resistance is very slight until late in the cell life and then it increases quite rapidly as shown in Figure 4-12.
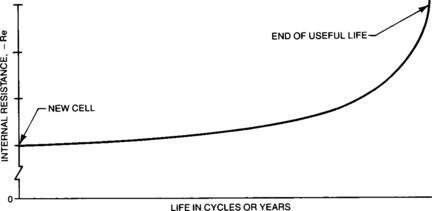
As the cell is used (charged and discharged), the interface between the current collector grid and the active material of the positive plate is slowly degraded by oxidation of the grid. The metallic lead of the positive grid is oxidized to PbO2. Since PbO2 is less conductive than the grid, the electrons must flow through an increasingly inefficient current collector as the cell is used. This oxidation process is discussed in detail in Section 4.4. The interface resistance between the grid and the active material also increases. The result is a growth in resistance as the cell ages.
The construction processes and materials used in advanced sealed-lead cells and batteries retard the oxidation process and extend the time and number of cycles before the internal resistance increases significantly.
4.1.5 BATTERY VOLTAGE - GENERAL OVERVIEW
In most battery applications, the discharge current is approximately constant and the parameter of concern is the behavior of the battery voltage with time. Constant-power and constant-resistance discharges are also important, but are usually well modeled by a constant-current discharge. So, voltage behavior under various forms of constant-current loads will be the focus of the remainder of the section.
The various stages of a typical battery duty cycle, including charge, discharge, and rest, are illustrated in Figure 4-13.

No matter what type of charger is used, it will hold the battery at some artificially high voltage during the charge process. When the battery is fully charged and removed from the charger, the battery voltage will drop to its full-charge open-circuit value. This value will decay only very slightly as the battery self-discharges.
When the battery is placed on discharge, the voltage will normally drop immediately from its open-circuit value to its on-load value. [For high-rate applications (4C and above), the voltage behavior is somewhat different. See the discussion in Section 4.1.6.] The loaded battery voltage will remain on a plateau, declining only slightly, for most of the battery’s useful discharge. When the voltage hits the knee of the curve, the fall to zero volts is extremely rapid. The discharge is normally terminated at this point.
After discharge, if the battery is left at rest in an open circuit condition, the voltage will gradually recover to a level near 2.0 volts depending on the degree of discharge.
4.1.5.1 Mid-point Voltage
A common way of evaluating the discharge characteristics of a cell is to use midpoint voltages. Mid-point voltage, by definition, is the voltage of the cell when it has delivered 50 per cent of its capacity at the given discharge rate. In other words, it is the half-way point for any given discharge rate. The voltage characteristic for many sealed-lead batteries (Figure 4-14) is such that the mid-point voltage is also the approximate average voltage for the plateau of the discharge curve. This makes it a convenient point to estimate average performance in terms of voltage delivery to the load. The mid-point voltage concept will be used extensively throughout this section.

4.1.5.2 Battery Discharge Voltage as a Function of Discharge Rate
The effects of increased discharge rate on the battery voltage are manifested in three ways: depression of the voltage plateau, an increase in the slope of the plateau, and shortening of the length of the plateau. Figure 4-15 shows a family of discharge curves for three different discharge rates as a function of time. As can be seen from those plots, low to medium-rate discharges behave similarly. Although there is some voltage depression with the increase in rate, the primary effect is shortening the discharge time. However, the high-rate (10C) discharge behaves quite differently. For this reason, high-rate discharges are discussed separately in Section 4.1.6.
4.1.5.3 Battery Discharge Voltage as a Function of Battery Temperature
As the temperature of the sealed lead cell changes, both the Eo and the Re of the cell vary, impacting the discharge voltage at the terminals of the cell.
The cell’s Eo varies slightly with temperature due to minor changes in the interface between the active materials and the electrolyte as well as solution activity effects at differing temperatures. At higher temperatures the E0 is slightly higher and at low temperatures the Eo is slightly lower.
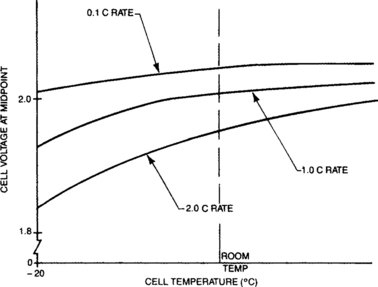
The impact on cell voltage from changes in Re with temperature is normally greater than that from Eo. Re, as discussed earlier, is a combination of many elements in the cell-resistive and electrochemical. The electrochemical parts of the total Re vary quite broadly, particularly at low temperatures. The combined temperature effect on Re was shown in Figure 4-11 to be dramatic. When the temperature effects upon Eo and Re are taken into consideration, the overall effect can be displayed as a family of curves at different discharge rates as shown in Figure 4-16. Note that this characterizes the discharge profile by its mid-point voltage. An alternative approach to visualizing the effect of temperature upon discharge voltage is shown in Figure 4-17.
4.1.6 HIGH-RATE DISCHARGES
The design approach used with many starved-electrolyte sealed-lead batteries make them superlative performers in high-rate applications. This high rate capability has been utilized primarily in engine starting applications and uninterruptible power supplies (UPS). Design of battery systems for high-rate applications is a very specialized field. Some general discussion is provided here, but designers contemplating use of batteries in high-rate applications are encouraged to discuss their needs with battery manufacturers.
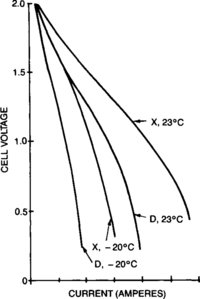
Typically in high-rate applications, the principal concern is maximizing instantaneous power through very high currents while still maintaining an acceptable voltage. While the advanced sealed-lead products are capable of delivering very high-rate current for short periods of time, any continuous discharge must be limited to lower currents to avoid damage to the battery. Figure 4-18 shows the relationship between peak current and its corresponding voltage for two sizes of cell at two temperatures. As can be seen, the current at 1.2 volts per cell (a nominal voltage for a high-rate, engine-start application) is over 30C. These E-I traces can also be translated into plots of instantaneous peak power as shown in Figure 4-19. Appendix B includes both E-I and instantaneous power plots.

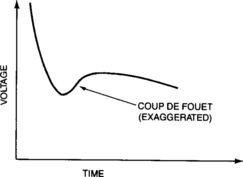
A constant-current discharge at high-rate has a voltage profile that is significantly different in shape when compared to those shown earlier for lower rate discharges. As can be seen in Figure 4-20, the voltage depression is obviously dramatic and the voltage plateau has a very pronounced slope. In addition, there may be a momentary depression of the voltage below the plateau immediately after the load is imposed. This transient, called coup de fouet (whipcrack), is common to all lead-acid batteries discharged at high rates. In most applications, the transient has no effect on the battery system’s performance. The areas of concern are systems that have low-voltage cutouts or that have digital electronics that may be affected by a low-voltage transient. Again, this is an area best addressed in consultation with the battery manufacturer.
4.1.7 DISCHARGE LIMITS
In order to obtain maximum life from sealed-lead cells and batteries, they should be disconnected from the load once they have discharged their full capacity. In fact, once a cell or battery has passed the knee of the discharge curve at the end of the voltage plateau, there is relatively little additional capacity to be extracted from the battery. Disconnecting at that point will minimize the possibility of overdischarge.
In overdischarge, the sulfuric acid electrolyte can be depleted of the sulfate ion and become essentially water. This lack of sulfate ions to act as charge conductors will cause the cell impedance to rise and little current will flow. This may necessitate a longer charge time or alteration of charge voltage before normal charging may resume.
A second potential problem arising from overdischarge can occur because of the increased solubility of lead sulfate as the concentration of the acid decreases. In a severe overdischarge condition when the electrolyte has become water, some of the lead sulfate present at the plate surfaces may go into solution. On recharge, the sulfate ion is converted back to sulfuric acid leaving a precipitate of lead metal (dendrite) in the separator. This may then result in a resistive path between the plates causing battery failure.
Because of possible occurrence of the problems described above, keeping the battery connected to the load or allowing it to self-discharge past the point where the battery capacity is depleted is not recommended.
4.1.7.1 Cell and Battery Discharge Limits
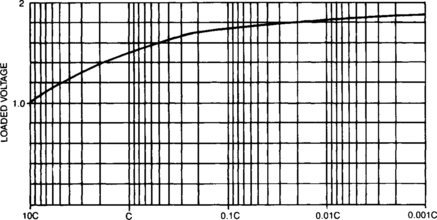
The discharge voltage at which 100 per cent of the usable capacity of the cell has been removed is a function of the discharge rate and is shown in Figure 4-21.
Most battery applications require more than 2 volts, however. This means that cells must be connected in series to make up the required battery voltage. In a series string of cells the battery performance is determined by the behavior of the individual cells. Fortunately, the cells are quite uniform, one to another, in voltage and available capacity. It should be recognized, though, that some variations do exist.
The voltages of the different cells in a given battery are normally very close to each other as the battery is being discharged. The largest impact upon battery voltage, other than an absolute failure, comes from the capacity of the individual cells as the battery is deeply discharged. Figure 4-22 shows how a battery might look as it is deeply discharged. (The battery voltage scale on the left is purposely plotted differently from three times the cell voltage scale on the right to show clearly the deep discharge effect on the battery.)
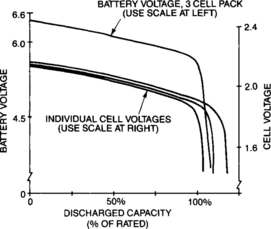
The battery voltage near the end of useful discharge is determined by the lowest capacity cell in the battery. The knee of the discharge characteristic is sharper than that of the individual cells and once the lowest cell is totally expended, the battery voltage drops rapidly.
4.1.7.2 Disconnect Circuits
Leaving the battery connected to a load after discharge should be avoided to enable the battery to provide its full cycle life and charge capabilities. Some form of battery disconnect or kickout circuit is often supplied to remove the battery from the load once the battery capacity is exhausted. After discharge and removal of the load from the battery, the cell voltages will normally increase and stabilize at the open circuit voltage as sketched in Figure 4-13. Because of this phenomenon, some hysteresis must be designed into the battery disconnect circuitry so that the load is not reapplied to the battery under this condition. The disconnect circuit should also be designed so that it does not itself impose a load on the disconnected battery, i.e. the battery is truly open-circuited.
4.1.8 DISCHARGING CELLS AND BATTERIES IN PARALLEL
In general, use of a larger battery, rather than multiple batteries in parallel, is both more reliable and more cost-effective. But, situations still arise where batteries need to be connected in parallel.
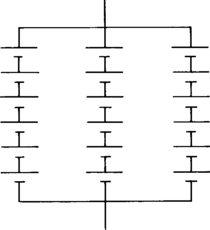
There are two approaches to connecting cells and batteries in parallel. The most common method shown in Figure 4-23 is the simpler. The method shown in Figure 4-24 is more difficult but may provide increased reliability in some applications. The connection in Figure 4-23 has three packs, each consisting of six cells connected in series, with the packs connected in parallel. The connection in Figure 4-24 has six series connections between groups of three cells in parallel. The difference is important only in deep discharge applications. Some of the cells in any given string in Figure 4-23 could be very deeply discharged before the battery voltage cutoff is reached. There is much less chance of cells deeply discharging before cutoff is reached in Figure 4-24. The arrangement in Figure 4-24 also provides a more even distribution of capacity among all cells during charging. As discussed in Section 4.2.9.2, charging such an interconnected string requires careful use of a constant-potential charger.
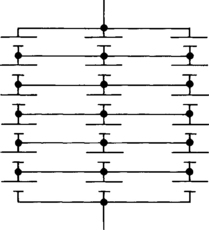
The cell-to-cell paralleling of Figure 4-24 is necessary only when the battery is performing one cycle per day or when the discharge period is less than 30 minutes. As the duty cycle becomes easier, the need for cross strapping becomes less. If the discharge period is two hours or less, the batteries need to be interconnected every 6 to 12 volts. If the discharge duty is longer than two hours, interconnections every 24 or 48 volts are sufficient. In deciding whether to interconnect cells, one advantage of the arrangement shown in Figure 4-23 is the ability to remove a battery string while maintaining backup power. This approach is commonly used in many telecommunications applications to allow testing or replacement of individual strings while retaining some backup capacity.
4.1.9 SUMMARY
The discharge performance of starved-electrolyte sealed-lead cells and batteries is one of their strengths. Taking advantage of this asset requires understanding the influence that use parameters and environmental factors may have on the resulting discharge. The actual capacity that may be obtained from a battery is greatly affected by the discharge rate and the temperature of the battery. The discharge should be allowed to continue long enough to take advantage of the battery’s long voltage plateau on discharge, but the discharge should be terminated before the possibility of overdischarging the battery occurs. Designers using sealed-lead batteries need to be alert to possible overdischarge of the cells, especially when used in batteries comprised of many cells. Precautions such as matching cells by discharge capacity or using special disconnect circuits may be required, particularly in deep-discharge or long-string applications.
4.2 Charging
The purpose of any battery is to provide electrical energy upon demand. When the ability of a primary battery’s chemicals to deliver energy has been expended, it is discarded. With a secondary battery, such as the sealed-lead battery, the chemical reactions involved are reversible. These batteries may be recharged after discharge so they can deliver their rated output many times over the course of their life.
The type and degree of charging used with a secondary battery is usually a critical factor affecting both discharge performance and life. Insufficient charge input will result in reduced discharge capability. Charging the battery without adequate controls or charging the battery for prolonged periods may reduce its life by any one of several processes.
4.2.1 IMPORTANCE OF ADEQUATE CHARGING
All secondary batteries like to be charged fully to give their best performance. Unfortunately, they often can be damaged by being charged too vigorously. When selecting a charging strategy, the need for a full charge must be balanced against the problems associated with overcharging.
In general, experience with sealed-lead cells and batteries indicates that application problems are more likely to be caused by undercharging than by overcharging. Since the starved-electrolyte cell is relatively resistant to damage from overcharge, designers may want to ensure that the batteries are fully charged, even at the expense of some degree of overcharge. Obviously, excessive overcharge, either in magnitude or duration, should still be avoided. Application engineers from the battery manufacturer should be consulted to assist with proper charger design.
4.2.2 SEALED-LEAD CHARGING CHARACTERISTICS
From a simplistic viewpoint, charging a sealed-lead battery is analogous to pumping water back into a water reservoir from which it has been removed. But unlike a water reservoir, the battery is not fully charged when the amount of charge returned is equal to that previously removed. There is always some parasitic generation of gas (both oxygen at the positive plate and hydrogen at the negative plate) which reduces charging efficiency. These rates of gas generation are relatively low at low states of charge, but increase as full charge is approached. When the cell is fully charged, essentially all of the charge current is being applied to the generation and recombination of oxygen inside the cell because all of the usable active materials on the plates have been converted to the charged state. The rate at which oxygen recombines at the negative plate is a complex function of cell design, operating conditions, and the overcharge regime. At low rates of charge, the recombination process is efficient, approaching 100 per cent recombination. For a given type of cell or battery, the oxygen recombination efficiency begins to drop at some level of charge current and it continues to decline as the rate of charge increases. The same comments apply generally to hydrogen generation and release. This means that charge currents must be restricted in order to avoid undesirable gas release by the vent as the cell approaches and ultimately achieves a full state of charge. It should be recognized that, although the theory of recombination electrochemistry implies that oxygen generation at the positive electrode will minimize or preclude hydrogen release from the negative, in actual practice, the two processes occur simultaneously and the rates of both are a function of overcharge level.
Conversion of active material at the positive plate is an oxidation process. At full charge, in addition to generation of oxygen, there is also a secondary tendency to oxidize the current-carrying lead grid onto which the positive-plate active material is pasted. This irreversibly converts the metallic lead conductive grid to less conductive lead dioxide. Excessive overcharge current and elevated temperature speed grid oxidation which progressively diminishes the conducting cross section. The ultimate result is conversion of sufficient grid metal to cause loss of electrical continuity between the positive plate active material and the cell terminal. High-purity lead grids minimize the grid oxidation rate.
A third item which must be considered in sealed-lead battery charging is capacity retention. A battery on open-circuit stand will self-discharge. If used in a standby power application, it is not sufficient to fully charge the battery and then leave it on open circuit. The time between discharges may be months or years. At 25°C a fully charged battery will self-discharge to approximately 50 per cent of its rated capacity after one year. Therefore, it is necessary, in these applications, to provide some manner of sustaining charge, normally through a continuous float or trickle charge.
In summary, there are two major reasons for continuing the charging operation into overcharge and likewise two major reasons for maintaining close control over overcharging. With regard to the need for overcharge, full charge is attained asymptotically. This makes it difficult to determine precisely when the battery is fully charged. The battery is thus overcharged to assure that it reaches full charge. Also, overcharge current is maintained to prevent loss of capacity resulting from self-discharge. Control of overcharge current is required to minimize gas venting and to avoid accelerating oxidation of the positive plate grid.
4.2.2.1 Cell Pressure, Temperature, Voltage, and Current Interrelationships During Charging
The cell’s voltage, current, pressure and temperature are the principal parameters that vary during charging. When those variations are understood, one can then design a charger to effectively and safely charge the cell. The pressure, temperature and voltage profiles are shown in Figure 4-25 for a discharged sealed-lead cell that is charged with a medium charge rate, such as 0.1C constant-current in a 25°C environment.

Figure 4-25 Typical Relationship of Cell Voltage, Pressure, and Temperature During Constant-Current Charging
In Section 2.5.1 the charging chemical reactions were presented. When the cell is at a low state of charge all of the electrical energy input to the cell is converted to chemical energy-producing PbO2 at the positive plate and sponge lead at the negative. During this efficient conversion of the active materials the cell pressure remains low and there is little temperature rise. The voltage rises slowly as the electrolyte is gradually converted from a weak solution to a higher acid concentration. As more electrical energy is pumped into the cell, a gradual change takes place; the positive and negative electrodes can no longer convert all the electrical energy into chemical energy. An increasing amount of charge goes to generate oxygen gas at the positive plate and hydrogen at the negative. This phenomenon is often referred to as gassing. Note that gassing is internal to the cell; if the gas escapes the cell, the process is called venting.
Cell pressure remains low until the cell approaches 80 per cent state of charge and the positive plate begins to generate oxygen. At the same point or shortly thereafter, the negative plate also begins to gas hydrogen. As the cell gradually transitions from relatively low gassing levels to a condition where the majority of the charge current is going into gas generation, venting may begin depending upon the overcharge rate. As time progresses the gassing rate and subsequent venting will approach a steady rate that is characteristic of the particular overcharge conditions employed.
The cell temperature profile is similar to the pressure profile, but lags it in time. The cell temperature increases as oxygen recombines at the negative plate releasing heat. The shape of the internal cell temperature curve and the temperature level achieved is again a function of battery design, ambient conditions, and the overcharge regime.
The relatively abrupt increase in cell voltage seen in Figure 4-25 is due to the negative plate going into overcharge with an attendant increase in the rate of hydrogen generation at the negative. The voltage reaches a peak level and then drops off due to oxygen recombination “pulling down” the potential of the negative plate. The shape of this part of the curve is variable, again depending upon a complex set of design and performance parameters.
When a cell is charged by a constant-voltage charger the temperature and pressure relationships are quite different from the constant-current charging situation. Figure 4-26 shows typical parameters for constant-voltage charging. The big difference inside the cell between constant-current charging and constant-voltage charging is the pressure and temperature in overcharge. The charging current drops off significantly in constant-voltage charging as the cell becomes fully charged. The reduction in charging current means that there is less driving force to generate gas and hence less venting. Since there is less oxygen to reduce at the negative there is less heat generated, resulting in only a very small rise in temperature, or possibly a rise and decline as shown, depending on the charge voltage.

4.2.3 CHARGE ACCEPTANCE
Charge acceptance is the term frequently used to describe the efficiency of charging. If a rechargeable battery were 100 per cent efficient, it would mean that all the energy put into the battery by charging could be retrieved by discharging. But no battery is ideal; no battery is 100 per cent efficient. The charge acceptance of sealed-lead batteries in most situations is quite high, typically greater than 90 per cent. A 90 per cent charge acceptance means that for every amp-hour of charge introduced into the cell, the cell will be able to deliver 0.9 amp-hours to a load. Charge acceptance is affected by a number of factors including cell temperature, charge rate, cell state of charge, the age of the cell and the method of charging. Each of these will be discussed in the following sections.
4.2.3.1 Effect of State of Charge on Charge Acceptance
The state of charge of the cell will dictate to some extent the efficiency with which the cell will accept charge. When the cell is fully discharged, the charge acceptance is immediately quite low. As the cell becomes only slightly charged it accepts current more readily and the charge acceptance jumps quickly, approaching 98 per cent in some situations. The charge acceptance stays at a high level until the cell approaches full charge.
As mentioned earlier when the cell becomes more fully charged, some of the electrical energy goes into generating gas which represents a loss in charge acceptance. When the cell is fully charged, essentially all the charging energy goes to generate gas except for the very small current that makes up for the internal losses which otherwise would be manifested as self-discharge. A generalized curve representing these phenomena is shown in Figure 4-27.

4.2.3.2 Effect of Temperature on Charge Acceptance
As with most chemical reactions, temperature does have a positive effect upon the charging reactions in the sealed-lead cell. Charging at higher temperatures is more efficient than it is at lower temperatures, all other parameters being equal, as shown in Figure 4-28.

The cell temperature impact on charge acceptance is overlaid upon the generalized curve of Figure 4-27 to illustrate the compound effect of cell state of charge and cell temperature. For this representation the other important parameter, charge current, is held constant. Figure 4-28 shows the charge acceptance is still very high at lower temperatures.
4.2.3.3 Effect of Charging Rate on Charge Acceptance
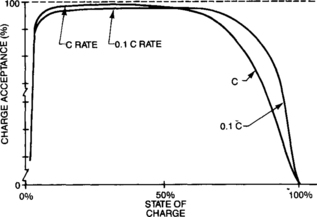
The starved-electrolyte sealed-lead cell charges very efficiently at most charging rates. The cell can accept charge at accelerated rates (up to the C rate) as long as the state of charge is not so high that excessive gassing occurs. And the cell can be charged at low rates with excellent charge acceptance.
Figure 4-29 shows the generalized curve of charge acceptance now further defined by charging rates. When examining these curves, one can see that at high states of charge, low charge rates provide better charge acceptance.
4.2.3.4 Other Factors Affecting Charge Acceptance
When a sealed-lead cell ages, the ability of the cell to accept charge decreases and the capacity available from each charge is reduced. This is partly due to the reduction in the ability of the positive plate to conduct electrons to the external circuit because of the gradual oxidation of the grid. But it is also due to a lack of continuity in the active material of the plates of the cell, particularly the positive plate, which impacts charge acceptance. For this reason, an aged cell will begin gassing sooner in the charge cycle.
In multi-cell batteries another factor may be involved. The charge acceptance of any given cell in the series string may seem reduced if the battery pack is charged with a constant-voltage charger set at a low voltage. Under this condition, one cell in a battery may have a slightly lower charge acceptance than the other cells. When the battery is discharged, this cell will recover its capacity more slowly than the other cells in the pack. It is quite possible that this one cell will not obtain a full charge if the charge time is short before the next discharge. Repetitive rapid cycling of the pack without sufficient recharge will generally cause the low-charge-acceptance cell to become progressively lower in capacity. This problem is often associated with series-parallel applications. In those cases, interconnection between cells as discussed in Section 4.1.8 may reduce the likelihood of cycle-down.
4.2.4 OVERCHARGING
Overcharge is defined as continued charging of a cell after it has become fully charged. When a cell is not yet fully charged, the electrical energy of the charge current is converted to chemical energy in the cell by the charging reactions. But, when all of the available active material has been converted into the charged state, the energy available in the charging current goes to produce gases from the electrolyte in the cell.
In the starved-electrolyte sealed-lead cell at typical charging rates, the bulk of the gases are recombined and there is virtually no venting of gases from the cell.
4.2.4.1 Oxygen Recombination Reaction
As described in Section 2.5.2, when the cell reaches full charge, virtually all of the active material in the positive electrode is charged while the negative electrode, by design, still contains some uncharged active material. This balance of materials results in oxygen being generated at the positive electrode during overcharge prior to generation of hydrogen at the negative. The oxygen that migrates to the negative plate promptly recombines, converting the sponge lead to lead oxide. Since the oxygen recombination reaction is exothermic, heat is liberated as part of the process. The bisulfate form of HSO4 in the sulfuric acid electrolyte then reacts quickly with the lead oxide to form lead sulfate with water as a byproduct. This lead sulfate at the negative plate is then reconverted back to sponge lead and sulfuric acid by the overcharge current. Thus, although oxygen is being generated at the positive plate during overcharge by the breakdown of water, it is being converted, or recombined back to water by the chemical reactions occurring at the negative plate.
Although the recombination process theoretically keeps the negative plate from going into overcharge by continuously forming lead sulfate by reaction of oxygen with the sponge lead, under many operating conditions some hydrogen is generated at the negative in overcharge. In principle this hydrogen can migrate to the positive electrode and chemically recombine back to water by a series of reactions similar to those described for oxygen recombination, but this is not known to occur readily. Instead small amounts of hydrogen escape from the cell under some operating conditions, depending on the level of overcharge.
These reactions continue as long as overcharge current flows. However, little electrolyte is lost because venting is minimal under most circumstances due to the recombination process. The vast majority of the electrical energy in this equilibrium overcharge process is converted to heat energy raising the temperature of the cell. The oxygen recombination capability of the starved-electrolyte cell permits true maintenance-free operation. While the recombination process is highly efficient under most normal charging conditions, small amounts of hydrogen and/or oxygen may be vented from the cell. However, the amounts of these gases are much lower than those discharged by other types of lead batteries being charged under equivalent conditions. There are, of course, situations of high overcharge currents and/or abnormal temperatures that may result in excessive levels of gas venting from the cell. These conditions, if allowed to persist, may permanently damage the cell.
4.2.4.2 Oxidation Effects of Overcharge
One other aspect of overcharge may also be detrimental to the life of the sealed-lead cell. Even though no electrolyte may be lost in the overcharge reactions described above, and even though the inorganic separator is not degraded by the temperature and oxygen created by the overcharge reactions, it is still best to limit overcharge to minimize oxidation of the positive grid.
The positive plate, made up of a metallic lead grid onto which the active material is pressed, undergoes a gradual change during overcharge. The grid metal, when exposed to sulfuric acid and elevated temperature in overcharge, oxidizes forming lead dioxide. This reaction takes place quite slowly because the grid is completely surrounded by active material (PbO2) which tends to isolate or shield the grid from the electrolyte. As the grid is gradually oxidized, the lead cross-section is reduced and the current-carrying capability of the grid is correspondingly reduced because lead dioxide is a relatively poor conductor. Eventually the oxidation may become so severe that the grid ceases to adequately perform the function of conducting electrons to the external circuit. Oxidation of the grid also creates other problems. Lead dioxide occupies a greater volume than the lead it replaces. As the positive grid oxidizes, the positive electrode thus expands. The resulting plate “growth” can result in electrical shorts or physical damage, such as buckling, to the positive plate. The cell also becomes increasingly fragile as the structurally weaker lead dioxide replaces the metallic lead in the grid. The high-purity lead grids found in advanced sealed-lead batteries minimize the oxidation rate thus delaying the onset of these problems.
The oxidation of the lead grid can be delayed, thus extending the life of the cell, by minimizing the amount of overcharge. Both the magnitude and the duration of the overcharge have a direct influence upon the rate and degree of oxidation of the grid.
Again, it should be stressed that the majority of application problems with sealed-lead batteries are attributable to undercharging. Many power supply designers may be willing to accept a slight decrease in cell life as the price for increased assurance of meeting the application requirements.
4.2.4.3 Overcharge Characteristic - The Tafel Curves
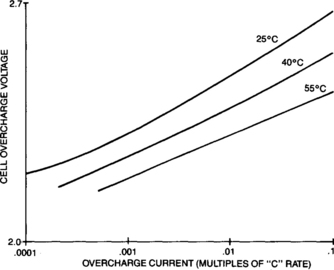
When a cell is in overcharge in a state of equilibrium, the voltage/current relationship is quite predictable. The cell voltage versus overcharge current characteristics, called the Tafel curve, can be used by the charger designer to select the proper constarrt voltage setting for a specific charger/battery application. Typical Tafel curves for sealed-lead cells are shown qualitatively in Figure 4-30 and repeated with the appropriate scales in Appendix B. The overcharge voltage for any given current is quite dependent upon temperature, but as can be seen, it is not a linear relationship. A typical sealed-lead cell will have an overcharge voltage that is inversely related to temperature.
4.2.5 TYPES OF CHARGING
Charging the sealed-lead battery, like charging other secondary batteries, is a matter of replacing the energy depleted during discharge.
Charging may be accomplished by various methods, but the objective — to drive current through the battery in the direction opposite that of discharge — remains the same. Constant-voltage charging is conventionally used for lead-acid batteries and is fully acceptable for the starved-electrolyte sealed-lead battery; however constant-current, taper-current and variations thereof may also be used. Each method has its advantages and disadvantages which will be discussed in the following sections. The choice of charging approach should be determined by its fit with the application’s requirements.
When considering the charger to use, it is necessary to consider the way in which the battery will be discharged, the time available for charge, the temperature extremes the battery will experience, and the number of cells in the battery.
As described in Section 2.2.4, cyclic applications are those where the battery is frequently discharged, removed from the load and subsequently charged. For this discharge profile, typified by portable instrumentation and battery-powered appliances, constant-voltage, constant-current or two-step constant-current chargers may be used. The essential requirement for chargers in this type of duty is the ability to restore full charge quickly.
In float applications, the battery is continually charged, discharging only when the main power has failed. In operations of this type, which include memory back-up, emergency lighting and alarms, uninterruptible power supplies (UPS) and telecommunications systems, a constant-voltage charger normally represents the most effective alternative. The key requirement is to keep overcharge effects at a minimum.
Applications in which the higher cost of a well-regulated constant-voltage or constant-current charger significantly affects the total product cost may require a taper-current charger. Although their low cost is a definite advantage, their lack of voltage regulation can be detrimental to the life of the battery. Taper chargers are often seen in low-cost consumer items, such as rechargeable flashlights.
Charging the sealed-lead battery in remote locations may be accomplished by photovoltaic cells on solar panels supplying energy to charge the battery. In this application a constant-voltage output is preferred to minimize the effects of light intensity and temperature variations.
All of these methods of charging the starved-electrolyte sealed-lead battery are discussed in the following paragraphs.
4.2.6 CONSTANT-VOLTAGE (CONSTANT-POTENTIAL) CHARGING
Constant-voltage charging, often referred to as constant-potential (CP) or float charging is the most common method of charging lead batteries. It has been used successfully for over 50 years with a diversity of lead battery types.
Constant-voltage charging means simply that the charger voltage is held uniform regardless of battery state of charge. The charge current varies depending on the difference between the input voltage and the battery voltage: when the battery is discharged, its voltage is lower and the charge flow is greater; as the battery charges, its voltage increases and the charge current declines. Many advanced forms of sealed-lead batteries do not require a current clamp or other limitation on inrush current thus simplifying charger design.
4.2.6.1 Uses of Constant-Voltage Charging
Constant-voltage chargers are most often used in two very different modes: as a fast charger to restore a high percentage of charge in a short time or as a float charger to minimize the effects of overcharge on batteries having infrequent discharges, i.e. in most standby power applications. In between these two extremes is an area of cycling-type duty where the constant-voltage charger is not as well-suited. These rather contradictory statements can be explained by remembering that supplying electrons is the key to charging batteries. Because sealed-lead batteries have very low internal resistances, they will accept very high currents when fully discharged if not limited by the current-supply capabilities of the voltage source. Initial charge currents as high as 4C are common on large power supplies. Although the current on a constant-voltage charger starts out extremely high, as illustrated in Figure 4-31, it then decays nearly exponentially.

The important parameter is the area under the curve, the integrated product of current supplied over time. Thus, in the early going, with large current flows, a constant-voltage charger may return as much as 70 per cent of the previous discharge in the first 30 minutes. This proves useful in many applications involving multiple discharge scenarios. As the battery charges, its voltage increases quickly, reducing the potential difference that has been driving the current, with a corresponding rapid decay in the charge current. As a result, even though the battery quickly reaches partial charge, obtaining a full charge requires prolonged charging. The length of the charge period may be significantly affected by the choice of charge voltage.
Given this behavior, constant-voltage chargers are frequently found in applications that normally allow extended charging periods to attain full charge. Here the fast charging to a significant fraction of the previous discharge is a significant advantage in accommodating multiple power-loss situations. Exploiting the constant-voltage charger’s fast charging features in a cycling application is difficult, since repeated discharges without the intervening time to asymptotically reach 100 per cent capacity, will result in cycling down of the battery.
4.2.6.1.1: Cycling Down and Charge Time It is often very tempting to trim the charge time for batteries on constant-voltage charge. After all, the battery has quickly regained the vast majority of the capacity used on the previous discharge and charge currents are nearly negligible. This approach may work occasionally, but it is a practice which, if repeated often, will result in diminished battery capacity.
As explained in Section 4.2.7.2, repeated discharges, especially deep discharges, and constant-voltage charges may cause the battery to become imbalanced which can then lead to failure. The problem is that a low-capacity cell, if it is present, is more heavily drained than the remainder of the battery. Consequently, even though the other cells in the battery are charged to capacity and the charge current has diminished significantly, the low-capacity cell still needs more charging. If the time between discharges is long enough, the low cell can charge as well and the battery will approach balance. But, if that time is not allowed and, instead, the battery is discharged again, the low cell will be even more heavily discharged. Thus the problem is compounded. The term cycling down is used to describe this cumulative loss of capacity. The result can quickly become a battery with one or more dead cells. This can be prevented by either adjusting charge voltages or charge times to ensure adequate charging for all cells.
4.2.6.2 Approaches to Constant-Voltage Charging
Described below are typical ways of applying constant-voltage charging to sealed-lead batteries.
4.2.6.2.1: Single-Potential Charging The most common sealed-lead battery charger is the single-potential constant-voltage charger which is set for a specified voltage. These chargers normally include some sort of series regulation or shunt regulation between the charging power source and the battery to hold the voltage across the battery terminals relatively constant.
Even so, in practice, the “constant” voltage is not perfectly constant throughout the range of charging currents, as shown by the dotted line in Figure 4-32. For most applications, the actual charger profile is well approximated by the idealized charger curve shown as the solid line in Figure 4-32. The idealized curve assumes the charger will supply a uniform specified voltage at any current below the current limit and then will supply only that current regardless of voltage.

The charger then must interact with the characteristics of the battery. Figure 4-33 represents a typical battery response to charging at various charge currents as the family of profiles shown as the dotted lines. The solid line represents the behavior of the battery when charged by the idealized constant-potential charger of Figure 4-32. The battery first behaves like it is receiving a constant-current charge at the limiting current until the charging voltage reaches the setpoint voltage of the charger. At that point, the battery charging voltage remains constant as the battery continues to charge, i.e. the battery moves to the right on Figure 4-33, cutting the charge current profiles. As can be seen on the figure, as the battery approaches full charge the currents decline quickly. This trend continues into overcharge until, at some point, the current reaches a level where it just balances the losses within the cell. This stable trickle current will then continue indefinitely.

Since the capacity returned is simply the integration of current over time, it is possible to relate the battery behavior to charge time as shown in Figure 4-34. The dramatic reduction in charge current as the cell approaches 100 per cent of the capacity returned is well illustrated. This decrease in current is reflected in the capacity returned. The capacity returned, which was linear and increasing rapidly as long as the charger was operating current-limited, takes an exceptionally long time to actually reach 100 per cent. Since there are losses in the charging process, return of about 120 per cent of discharged capacity is often recommended.

Figures 4-34 and 4-35 illustrate the dilemma in selecting a charge voltage for constant-potential charging. For faster charging, the voltage should be set higher, but the result is then a larger trickle-charge current which may degrade cell life.

4.2.6.2.2: Dual-Potential Constant-Voltage Charging In some cases a two-step charger may provide better performance than a single potential setting for a constant-voltage charger. The concept is used to avoid the dilemma discussed above. At the beginning of charge a high voltage setting produces a rapid charge, and then, once the battery is fully charged, the voltage is switched to a conservative float voltage to enhance life. Considerable testing with this concept has demonstrated insufficient improvement over the basic single-potential constant-voltage charger to justify the extra complexity in most standby power situations.
4.2.6.3 Charging Parameters
The choice of charging parameters (charge voltage and current limit) requires weighing economics, battery life, and operational considerations. Increased battery temperature, a higher current limit on the charger, or elevated charger voltage setting all serve to decrease battery charge time.
4.2.6.3.1: Float Voltage The float voltage setting has a dramatic impact upon charge time as can be seen in Figure 4-35. Small increases in float voltage significantly reduce the charge time. Unfortunately, the float voltage setting also has a significant impact on battery life. Since higher float voltage settings permit higher overcharge currents to flow from the charger to the battery, small increases in float voltage can substantially decrease battery life.
To achieve the optimum life, it is best to design for an overcharge rate of approximately .001C at room temperature. By using the Tafel curves, Figure 4-30 or Appendix B, the charger designer can set the float voltage to meet these limits for the specific temperature range in the application.
4.2.6.3.2: Current Limits The starved-electrolyte sealed-lead battery is not intrinsically limited in the charge currents it will accept. It is perfectly acceptable to use chargers rated at 20C or more to charge the battery. Practically, greater current-delivery capability in a CP charger normally comes at greater cost. The result is a desire to use relatively small, current-limited chargers, even at the penalty of increased charging time. The impact of various current limits for one typical case are shown in Figure 4-36. A useful rule of thumb for chargers that are limited to less than the 2C rate is to increase the charge time in hours by the reciprocal of the current limit. Thus a charger limited to 0.2C would have 5 hours added to its charge time while a charger with a 0.1C limit would have its charge time increased by 10 hours.

4.2.6.4 Temperature Compensation of Constant-Voltage Charging
A large improvement in the constant-voltage charger can be made through compensating the voltage setting for changes in temperature. In Section 4.2.3.2 the voltage dependence upon temperature in a sealed-lead cell was discussed. The range of variation in voltage with temperature is a few millivolts per degree C depending upon cell temperature and overcharge rate. Designing the charger to vary the float voltage based on the actual battery temperature will produce a more reliable and long-life charger/battery system. This is obviously most important for batteries routinely operated at other than standard room temperature conditions. It is especially consequential for batteries that spend much of their life in electronics enclosures where temperatures can climb substantially above ambient conditions.
The recommended amount of compensation is provided in Appendix B as a function of charge rate and temperature.
4.2.6.5 Tradeoffs in Constant-Voltage Charger Design
In many circumstances, the product designer must balance the trade-offs of faster charge time with higher float voltage settings on one hand versus longer total battery life with lower float voltage settings on the other hand. Some general recommended values are provided in Appendix B. For specific suggestions on the proper charging voltage for a given application, contact the battery manufacturer.
4.2.7 CONSTANT-CURRENT CHARGING
Starved-electrolyte sealed-lead batteries may be charged with a constant-current charger. In many applications, it is the best method of restoring charge relatively quickly without adversely affecting battery life. Constant-current charging works to eliminate any charge imbalance in the battery and is especially effective when several cells or batteries are charged in series.
Constant-current charging in the practical sense means simply that the charger furnishes a relatively uniform current, regardless of the battery state of charge or temperature. These chargers are inexpensive and, when properly designed, are very reliable. Typically, the charger characteristic is designed so that at the operating point only small variations in current can occur throughout the entire charging range of the battery. Figure 4-37 demonstrates this concept with a theoretical charger voltage-current output characteristic. Superimposed upon this charger characteristic is the operating range of a battery during charging. The difference between maximum current and minimum current in this example is 105mA (max) to 75mA (min) or a range of 30mA. This obviously is not constant-current, but it is acceptable for most applications. As a sealed cell is being charged with a constant-current charger, the cell charging voltage takes on a profile with time represented by Figure 4-38. This family of curves has been normalized by the percentage of capacity returned to the cell (rather than charging time) so that the various charge rates can easily be compared. As shown by these curves, the voltage of the cell increases sharply as the full charge state is approached. This increase in voltage is caused by the plates going into overcharge. The voltage increase will occur at lower states of charge when the cell is being charged at higher rates due to reduced charging efficiency at higher charging rates. Note that on the far right side of the figure, the charging voltage stabilizes in overcharge at the levels shown in the Tafel curves, Figure 4-30. The family of curves in Figure 4-38 are idealized in that they assume the cells are fully stabilized. In fact, newly manufactured cells may not have such a high peak voltage value as shown. After these new cells have been exercised by discharge/charge cycling, the voltage peak will increase to its stabilized value.
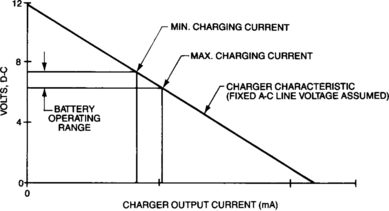

If we now refer back to the charger characteristic in Figure 4-37 which has a nominal charging current of 0.04C and pick off from Figure 4-38 the maximum and minimum voltages of the cell during charge at 25°C, we can predict accurately the actual maximum and minimum charging currents. At other temperatures the charging voltage characteristic will be slightly different than what is shown in Figure 4-38. Rather than plot a whole series of charging voltage characteristics at different temperatures, it is easier to refer back to the Tafel curves (Figure 4-30) to see what happens in overcharge.
It is the overcharging of the sealed-lead battery which is of concern in constant-current charging. Section 4.2.4.2 pointed out that persistent overcharging of a sealed-lead cell increases the oxidation of the positive grid. Therefore, charge limitation becomes a consideration as it relates to battery life when constant-current charging is employed. The next few sub-sections will deal with this issue.
4.2.7.1 Single-Rate Constant-Current Charging
Most constant-current chargers are simple single-rate chargers. They are readily available from charger manufacturers or they can easily be designed into the end product. Single-rate constant-current chargers are frequently chosen for portable cyclic applications such as garden tools, flashlights and portable appliances. The prime advantage of constant-current chargers is their low cost. Single-rate constant-current chargers require no switching or sensing circuits and generally consist of a simple transformer and diode rectifiers.
4.2.7.1.1: Charge Rate Selection The selection of the proper charge rate is a very important consideration. Choice of charge rate is a function of both the product and the application profile.
To help the product designer in this decision, the maximum charge rate capability must be understood. The starved-electrolyte sealed-lead battery is capable of being charged at very high rates as long as the state of charge is low. Charge rates of up to 1C rate are tolerable for fully-discharged batteries. But as the cell approaches full charge, gassing begins and the internal pressure starts to build. At this point the charge rate must be reduced so that venting from excessive gassing is minimized. For single-rate chargers, then, high charge rates (greater than 1C) are not recommended.
At low temperatures there are two concerns that act to limit the maximum charging rate that may be used. First, at low states of charge and very low temperatures the concentration of the electrolyte solution is so low that the freezing point may be reached. The battery should not be charged when the temperature is below the freezing point of the electrolyte. At temperatures just above the freezing point the ionic conduction through the electrolyte is so sluggish that the charge rate should be reduced well below the room temperature rate. The second concern at very low temperatures is at high states of charges as the cell is approaching and going into overcharge. The gases generated must be minimized to hold the internal gas pressure to a reasonably low level. Since charging at low temperatures is less efficient, gassing may start earlier which again suggests lower charge rates are appropriate.
The other end of the spectrum is the minimum charge rate that can be applied to a battery. As pointed out in Section 4.2.3.3, the charge acceptance of the sealed-lead cell is very good at low charge rates. At the .01C rate, for example, the charge acceptance throughout most of the charging period is approximately 90 per cent at 25°C. The advantage of a very low charge rate is extended life, but this advantage is frequently discounted when it is realized that the charge time will exceed 100 hours for a fully discharged battery.
Single-rate constant-current charging is more appropriate for cyclic operation where a battery is often required to attain a full charge overnight or within 24 hours. This suggests a charge rate in the .05C to .1C range. At these charge rates, there will be some venting of gases and positive grid oxidation may diminish life at elevated temperatures and/or extended overcharge times. Normally the user in a cyclic application is instructed to remove the battery from a single-rate constant-current charge within a period of time that is adequate to permit full charge, yet results in minimal grid oxidation.
4.2.7.2 Split-Rate Constant-Current Charging
The concept of split-rate constant-current charging is accepted as one of the best methods of charging sealed-lead batteries. The idea is very simple. For the first part of the charging period, while the battery is in a low state of charge, the charge current will be a medium to high charge rate. At a certain point, usually when the battery is approaching full charge, the charging current is switched back to a very low trickle charge rate. The charger then may be left connected to the battery indefinitely.
4.2.7.2.1: Advantages of Split-Rate Chargers Figure 4-39 illustrates the voltage/current versus time profile for one form of a split-rate constant-current charger based on a combination of voltage and time. Note how the charger switches from the high rate to the low rate when the battery is approximately 110 per cent charged. The choice of switching method and switch point may be affected by the relative priority of minimizing venting (by early switching) versus maintaining good cell balance (by later switching). In some forms of split-rate chargers, during the time when the battery is between 90 per cent and 120 per cent charged, the charger will alternate between the high rate and the low rate, with the amount of time spent in low rate increasing as the battery approaches full charge.
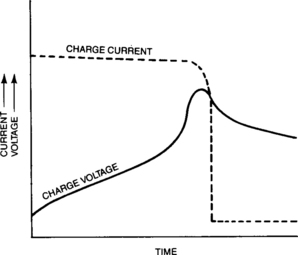
Chargers of this type are extremely useful where the battery charge and discharge pattern cannot be simply described as float or cyclic, but varies between the two applications. Many products, such as portable instrumentation, can benefit from the advantages of split-rate charging. For these uses, the benefits of improved battery performance and life outweigh the increased cost and complexity of the split-rate charger.
The advantages of split-rate constant-current charging are:
• The battery can be charged very rapidly.
• The battery will receive a very limited amount of overcharge because the trickle charge rate is so low that the oxidation effects on the positive plate are minimal.
• The cells in a long series string can be kept reasonably well balanced, one cell to another, throughout the life of the battery.
Each of these advantages is amplified below:
Depending on the expected temperature range of a given application, a high-rate charge current can be selected to fall within the maximum recommended charge rate curves shown in the Appendix B thereby allowing the use of high charge rates during the initial portion of the charge period.
Once the battery reaches a certain point, the charging current is switched from the high rate to a trickle-charge rate. Use of a two-step constant-current charger for a battery in a standby power application ensures that the low rate current is enough to keep the battery charged yet not so high as to create excessive oxidation of the positive grid. In constant-voltage chargers, by contrast, the float current is subject to variations as the battery ages or its temperature fluctuates.
The third advantage of constant-current split-rate charging is better cell balancing than in a constant-voltage charger. If a standby power or float application requires a high voltage, exceeding 40 volts, charging by constant-current means is usually the best method. Consider the example of a 48 volt battery with 24 cells connected in series. Statistically, one or more of the 24 cells will have an inherently lower capacity than the others in the pack. The low-capacity cell may be lower initially, or as the cells age, its capacity may degrade more rapidly that the remainder of the string. As the battery is used in service, after each discharge the low capacity cell becomes lower in relative capacity compared to the rest of the string if the battery is charged with a constant-voltage charger set at a typical float voltage. Assume that there are 23 cells that all have exactly the same capacity and one cell that has a capacity that is 10 per cent lower. And further assume that the battery pack is discharged down to 1.80 volts/cell before charge. The battery voltage at 1.80 volts/cell is 43.2 volts (1.80 × 24 cells). At the point where the entire battery reads 43.2 volts, 23 cells would average approximately 1.87 volts and the low cell would be down to about 0.19 volts. (It is conceivable that the low cell could actually have been driven into reverse.) In any event, the one lower capacity cell has been discharged far more deeply than the other cells in the battery.
Remember from Figure 4-27 that the charge acceptance varies greatly with the cell’s state of charge and that deeply discharged cells are initially not very efficient in accepting charge. So the low cell’s charge acceptance is significantly less than the other 23 cells in the pack. Not only did the low cell start out 10 per cent behind the others in capacity, it also is not being charged as well as the others due to its initial lower charge acceptance. If the charging voltage were set at 2.35 volts per cell in this example, the total battery float voltage would be 56.4 volts. The 23 higher cells would approach the float setting sooner than the low capacity cell even though the low capacity cell needs additional charge input to catch up. For this example, at the float point, where the current has dropped significantly, the 23 high capacity cells might typically be at about 2.36 volts/cell while the one low cell would still be down at 2.12 volts. Only if the battery were allowed to float for many hundreds of hours before the next discharge, would the low capacity cell become fully charged. And, if the next discharge comes before the low cell has caught up, the discrepancies will only amplify. This shows a shortcoming of constant-voltage charging for large multi-cell batteries (more than 20 cells) which can be overcome with a well-designed split-rate constant-current charger. As illustrated in Figure 4-39, the high-rate charging current can, by use of a timer, be continued for a short duration into overcharge to allow all the cells to reach a full charge status before cutting back to the trickle charge rate.
4.2.8 TAPER CHARGING
Taper chargers are frequently used on sealed-lead batteries for portable cyclic applications. The taper charger is an unregulated constant-voltage charger. It is designed so that the battery, at low states of charge, receives a high charge rate; as the battery approaches full charge the charge rate decreases. The charge rate in overcharge is still quite high—too high for a standby power application and for many cyclic duty requirements. Figure 4-40 illustrates a typical charger characteristic.

The output current of a taper charger is usually quite susceptible to variations in AC line voltages. Three conditions are plotted in Figure 4-40: the nominal line voltage, a high line voltage, and a low line voltage condition. Superimposed on the charger characteristic is the overcharge characteristic of the battery which is the Tafel curve (Figure 4-30) replotted on this voltage-current graph.
The nominal overcharge current is shown on this generalized curve at point 2. If the AC line voltage is at its very lowest level, the overcharge current would drop to point 1. If a very high line voltage condition exists, the overcharge current increases to point 3. These variations in overcharge current with AC line conditions are very much the same in principle, but greater than, the variations associated with the unregulated constant-current charger described earlier in Section 4.2.7. The overcharge current, even at point 1, the low AC line condition, is too high to be considered acceptable for long term charging. For this reason the taper charger is generally categorized with constant-current chargers. The discussion presented in Section 4.2.7 on constant-current chargers also applies to taper chargers.
A taper current charger contains a transformer for voltage reduction and a half or full-wave rectifier for converting from AC to DC. The output characteristics are such that as the voltage of the battery increases during charge, the charging current decreases. This effect is achieved by the proper wire size and the turns ratio. The turns ratio from primary to secondary determines the voltage output at no load and the wire size in the secondary determines the current at a given voltage. The transformer is essentially a constant-voltage transformer which depends entirely on the AC line voltage regulation for its output voltage regulation. Because of this method of voltage regulation, any changes in the input line voltage directly affect the output of the charger. Depending on the charger design, the output-to-input voltage change can be more than a direct ratio, e.g., a 10 per cent line voltage change may produce a 13 per cent output voltage change.
There are two major charging requirements which must be met if the main concern is the charge time to 100 per cent nominal capacity for cycling applications. These parameters can be defined as the charge rate available to the cell when the cell is at 2.2 volts and 2.5 volts. As shown in Figure 4-40, 2.2 volts represents the charge voltage at which approximately 50 per cent of the charge has been returned to the cell at nominal charge rates of 0.1C to 0.02C. The 2.5 volt point represents the voltage at which the cell is in overcharge. Given the charge rate at 2.2 volts, the charge time for a taper charger can be defined by:
Charge time = (1.2 × Capacity discharged previously)/(Charge rate @ 2.2V)
It is recommended that the charge rate at 2.5 volts be kept between 0.05C maximum and 0.01C minimum thereby ensuring the battery will be charged at normal rates while keeping the battery from being severely overcharged if the charger is left connected for extended time periods.
4.2.9 SPECIAL CHARGING SITUATIONS
In addition to the “normal” charging processes discussed in the previous sections, there are certain situations where extra care or a different approach to charging is indicated. Some of these are discussed below.
4.2.9.1 High-Voltage Batteries
Charging of high-voltage (over 40 volts) batteries is a concern for two major reasons: personnel safety and charge balancing. Although both items represent areas for concern, they can both be accommodated by the use of appropriate design measures and applications precautions. Batteries with voltages in the 40 to 60 volt range have been used quite successfully in a variety of applications. Batteries with higher voltages have been constructed and used successfully, but both safety issues and application methods require much more attention.
4.2.9.1.1: Personnel Safety Underwriter’s Laboratories recognizes 42 volts as the point at which safety becomes an issue. Charging systems using voltages over this limit should ensure that the charging circuitry is shielded and protected, that batteries are well-insulated, and that personnel access to batteries and energized charging systems is carefully controlled.
4.2.9.1.2: Charge Balancing The problems of cycling-down and charge-imbalance have been discussed previously. These issues become more important as the number of cells in the battery increases. In general, a good solution is two-step constant-current charging to ensure proper charge. However, many batteries in the higher-voltage regime are “float charged” by direct connection to a rectifier power supply and/or are connected in parallel for additional capacity. This eliminates the standard approaches to constant-current charging.
Constant-potential charging can be used instead. If the times between successive discharges are very long (>100 hours), a simple constant-voltage charge may be adequate to bring all cells up to charge. However, certain precautions will improve the odds of maintaining a balanced system. First, the charge voltage per cell should be increased as the number of cells in the battery increases. This enhances the probability of all cells getting an adequate voltage to charge. Figure 4-41 indicates the float voltages suggested for use with increased numbers of cells in the string. From an ideal charging voltage of about 2.30 for a single cell at room temperature, the voltage goes up to the 2.35 V/cell value recognized as standard for 6 or 12-volt batteries. A 48-volt battery would then use a float voltage of 2.38. Since this may leave some cells in the overcharge range while others are undercharged, a better approach is to cut the distance between voltage control points down.

For example a 48 volt battery might have its voltage controlled every 12 or 24 volts. This can be done either by separate charger circuitry or by a resistive voltage divider network. Balancing of long-string CP-charged batteries at regular intervals using a constant current charge is also highly recommended. The float voltage should also be controlled to always maintain a minimum trickle charge current of approximately 0.001C at standard ambient temperature. The advent of economical microprocessor-controlled charging systems has allowed many equipment designers to develop creative approaches to charging of long strings.
4.2.9.2 Series/Parallel Charging
While series strings (batteries) are routinely used to increase voltage, parallel strings to increase capacity are much less common. However, some common uses for sealed-lead batteries such as many telecommunications applications utilize parallel strings to provide the requisite discharge capacity. Charging batteries in parallel requires use of constant-potential charging since constant-current charging may result in uneven distribution of charging current among the batteries. Charging series-parallel batteries requires particular attention. The precautions suggested in Section 4.1.8 regarding interconnection of paralleled strings should be employed.
4.2.9.3 Low-Temperature Charging
In general, charging batteries at moderately low temperatures (−5°C) is relatively straightforward. Either constant-voltage or constant-current may be used although the preference is for a properly temperature-compensated CP charger. Charging at lower temperatures (−20°C) is feasible, but highly inefficient. Again, either constant-voltage or constant-current methods may be used. In either case, high voltages (2.6 volts per cell and up) will be required and venting may occur since more gas may be generated than can be recombined. Often, the result of charging attempts at low temperatures is enough heating within the cell to warm it to a level where charge acceptance is improved.
Charging any battery in ultra-low temperatures is a problematic process. The starved-electrolyte battery, because of its design, survives the cold as well or better than other batteries. It accepts charge in many situations where other batteries will be damaged by charging.
4.2.9.4 Elevated Temperature Charging
Charging at high temperatures may be done using either a constant-current or constant-voltage charger. Charging rates and voltages should be adjusted to minimize overcharge using the Tafel curves from Appendix B. Note that self-discharge rates are increased because of the temperatures and trickle charge currents may have to be increased proportionately to accommodate this.
4.2.10 CHARGING POWER SOURCES
Because of the diversity of applications in which sealed-lead batteries are used, they are charged from a variety of power sources ranging from clean, pure DC to AC with significant transients and/or wide swings in voltage. Because of the ruggedness of the batteries, they can usually tolerate highly variable power inputs, but, quite often, with some impact on the life expectancy. Maximum battery life comes when the power source combines with the charger to present the battery with a clean, uniform, stable DC input. But, in many applications, the device has a design life short enough that great efforts to extend battery life are not justified. In such cases the quality of the power source can be greatly compromised.
4.2.10.1 DC Power Sources
If DC power, provided at the right voltage, is already available, a dedicated charging system is not required. However, great care must be taken to ensure that the voltage available is truly useful for charging. DC systems relying on batteries to replace the primary power often operate at a system voltage closer to the voltage expected from the battery on discharge load than to the voltage necessary to charge the battery.
4.2.10.1.1: Charging from Vehicles The ability of the starved-electrolyte battery to accept high initial currents on a constant-voltage charge allow it to be successfully charged from most automotive electrical systems. In most cases, a 12-volt starved-electrolyte battery can be charged directly through the cigar lighter receptacle without additional charger circuitry. However, there are certain restrictions to this use:
• the vehicle must be running and the alternator feeding the electrical system. The starved-electrolyte battery can not be charged directly from the car battery.
• the battery should not be connected as the vehicle is being started. If connected, the battery may try to discharge back into the vehicle electrical system.
• the alternator must provide at least 13.8 volts. Higher voltages, up to 15 volts, are desirable to speed the charge.
In addition to automotive systems, smaller internal-combustion engines on equipment such as lawn mowers are now using electrical start systems powered by batteries. Economic considerations with these devices often dictates a very crude alternator charging system for the battery. The starved-electrolyte battery has a demonstrated record of surviving the adverse environment encountered in these applications.
4.2.10.2 AC Power Sources
Most sealed-lead batteries are charged from some form of AC power source. The exact source specification may vary drastically in voltage (110, 220, etc.), frequency (60, 50, 400 Hz), and quality of regulation. Basically, the battery is concerned about only two things, the degree of voltage variation and the amount of ripple passed to the battery. Depending on the AC electrical grid, the amount of voltage variation seen may range from negligible to quite substantial. The effects of differing line voltages can have dramatic effects on chargers, especially taper chargers where the line voltage variation may produce unsatisfactory charge voltages.
In addition to the gross voltage variations attributable to the line voltage, most batteries are exposed to some degree of voltage ripple due to imperfect rectification of the AC current. The worst case is obviously a half-wave rectifier where the battery sees the maximum amount of ripple. While the starved-electrolyte battery can tolerate this, it does impact the battery life. At the other extreme, highly filtered sources may essentially reduce the ripple to zero.
The choice of the degree of filtering is usually an economic one, trading filter cost against reduction in battery life.
4.2.10.3 Photovoltaic Sources
In many remote applications, the combination of a battery and photovoltaic charging system are becoming increasingly popular as the source of electrical energy, especially for such items as radio repeaters, weather instrumentation, and navigational aids. The starved-electrolyte battery is particularly well-suited to use with photovoltaic panels because of its high tolerance for overcharge currents. In some cases, the direct output of the solar panel can be used to charge the battery; however, maximum performance and life will be obtained with the use of voltage regulation circuitry.
Photovoltaic cells act basically as constant-voltage sources with highly variable currents that depend on the time of day, weather, etc. With a typical silicon cell capable of delivering about 0.45 volts, cells will have to be connected in series to supply a charge voltage appropriate to charge the battery. The cell area then determines the charge current. Sizing of the collector array is a complex series of tradeoffs depending on location, weather, use scenario, array cost, and required battery life. A blocking diode should be used between the battery and the cell array to prevent the battery from discharging through the cells when the light intensity is low.
4.2.11 SUMMARY
Starved-electrolyte sealed-lead cells and batteries perform best when properly charged. The charger designer is usually walking the line between the potential performance problems associated with undercharge and the threats to battery life from high overcharge currents. Undercharge can result in either the battery’s inability to meet discharge requirements or cumulative “cycling down” that ultimately causes battery failure. High overcharge currents may decrease battery life, either through loss of electrolyte by venting or loss of grid material through oxidation. As indicated in this section, experience indicates that more application problems are caused by undercharging than by overcharging. The high-purity grid used in some advanced sealed-lead batteries helps to minimize the effects of overcharge on grid corrosion.
Starved-electrolyte sealed-lead batteries may be charged by a variety of methods including constant-potential, constant-current, and taper chargers. Constant-potential chargers restore a large fraction of the discharged capacity quickly, but then require longer charging times to fully charge the battery. Constant-current charging at a single current level is best suited for cyclic applications where the battery is not left on charge for long periods. Two-step constant-current chargers are appropriate for most applications. They can use a high-rate current to quickly restore charge and then switch to a lower-rate current in overcharge. Taper chargers, although inexpensive, are, because of their high overcharge currents, suited only to applications not requiring long battery life.
4.3 Storage
Virtually all battery applications involve periods of storage where the battery is left unattended and off charge. These may come in the distribution chain prior to first use or they may be part of the duty cycle of the battery. Various forms of batteries have different limits on the amount of storage they will tolerate and require significantly different approaches to the storage process. Careful definition of a storage procedure that matches the needs of the application with the behavior of the battery will do much to ensure the ultimate success of a battery application.
Storage concerns typically fall into two classes. For some applications, the only major interest is in the length of time the battery can survive unattended without damage. For other uses, the battery must not only survive the storage period, but also retain some capacity after storage. Batteries differ significantly in how they perform in these two regards.
Sealed-lead batteries, because of their low self-discharge rates, can, once charged, be stored for long periods of time while retaining useful capacity. In this regard, they are better than either nickel-cadmium or other lead batteries. This may be important for applications where immediate use after storage is an advantage. However, sealed-lead batteries do not tolerate storage in the discharged state like nickel-cadmium batteries. Therefore special attention to length of storage and preparation for storage is advisable. Suggestions for storage of sealed-lead batteries are provided in the following sections.
4.3.1 SELF-DISCHARGE
Any charged battery, either primary or rechargeable, tends to lose charge over time. This capacity loss is referred to as self-discharge. Other terms used concerning self-discharge are stand loss or retained capacity which is the capacity remaining after self-discharge. In primary batteries the self-discharge rate is slow, often measured in years. In secondary batteries, the rate of capacity loss is normally higher than in primaries, but the loss is usually less important because the batteries can be charged before use.
Self-discharge in lead batteries occurs for two reasons: extraneous reactions occurring within the cell and the inherent instability of Pb and PbO2 in the presence of highly concentrated electrolyte. These factors result in the conversion of the cell’s active materials (PbO2 at the positive plate and sponge lead at the negative) into PbSO4. This effectively discharges the cell. The rate of conversion, like all chemical reactions, is temperature dependent. Thus higher temperatures greatly increase the self-discharge of a lead battery.
4.3.2 STATE-OF-CHARGE INDICATION
The ability to directly read a battery’s state of charge is an extremely helpful tool in planning for storage. In flooded-lead batteries, the traditional measurement of the state of charge is the specific gravity of the electrolyte. Because of the nature of starved-electrolyte cells and batteries, it is not possible to measure electrolyte gravity. Instead, the open-circuit voltage (OCV) of the cell or battery is the primary indicator of state of charge. As seen in Figure 4-42, the relationship between state of charge and open-circuit voltage is linear over a small, but usable range of voltages. Experience indicates that, when measured properly and interpreted correctly, the open-circuit voltage is an excellent predictor of remaining battery capacity.
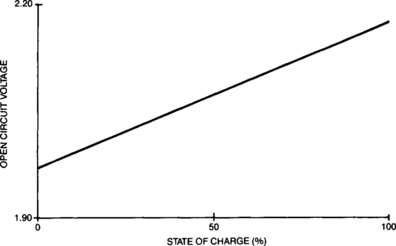
Accurate assessment of battery capacity through OCV requires that the battery have rested from its last charge or discharge. The curve of Figure 4-42 is shown in quantitative form in Appendix B. That curve is accurate within ±10 per cent of the battery capacity if the battery has not been charged or discharged for at least 24 hours.
4.3.3 CAPACITY RETENTION DURING STORAGE
For those applications where performance after storage is a major consideration, the important parameter is capacity loss during storage. The decay in OCV with time can be correlated with the curve of Figure 4-42 to produce the capacity loss with time curves of Figure 4-43. Since the discharge reactions are temperature-dependent, capacity loss is greatly accelerated with increases in storage temperature.

Note that these curves were generated for a fully-formed and fully-charged battery. Cells and batteries from some manufacturers are normally shipped at or above an 80 per cent state of charge and become fully formed only after being used. Therefore, the capacity loss in storage prior to first use will be greater than that shown by these curves. Some manufacturers of battery-operated products may want to “boost-charge” their batteries before shipment to take full advantage of the long storage characteristic of the starved-electrolyte battery.
4.3.4 CHARGE RETENTION DURING STORAGE
Although capacity loss may be important, the curves of Figure 4-43 substantially understate the maximum amount of time that a sealed-lead battery can survive in storage. This is because there is a “gray area” in the self-discharge of sealed-lead batteries where the battery has no useful capacity, but no damage to battery has occurred.
The key to successful storage of sealed-lead batteries is maintaining a minimum level of charge in the cell or battery. As long as the open-circuit voltage remains above this cutoff, the battery does not experience any irreversible changes that affect capacity or life. However sealed-lead batteries should not normally be allowed to self-discharge below 1.8 volts per cell in storage. This value of OCV is significantly lower than the 1.98 volts that represents effectively zero available discharge capacity in the battery.
Figure 4-44 shows storage time remaining versus OCV. As can be seen from comparing Figure 4-42 and 4-44, the battery still has about 60 per cent of its storage life left when it has effectively no useful capacity left. Some manufacturers recommend that, when feasible, batteries in storage receive boost charges at the time they reach the zero-capacity point. This may reduce the need for the capacity-recovery techniques discussed in Section 4.3.5.2.

4.3.4.1 Effect of Temperature on Charge Retention
Since the self-discharge reactions are temperature-dependent, the temperature at which a battery is stored will greatly affect the time it can be stored and remain viable. The variation of storage life for a fully charged sealed-lead battery is illustrated in Figure 4-45. At room temperature a fully formed and fully charged battery may last nearly three years before it needs recharging. However, the allowable storage life decreases about 50 per cent for every 10 degrees Celsius that the temperature increases. Of course the reverse effect will benefit batteries stored below room temperature.

4.3.5 STORAGE CONDITIONS
In general, storage of sealed-lead batteries is fairly straightforward. A major caveat is that the batteries must be stored in the open-circuit condition. Long periods of storage at even extremely low drain rates may result in permanent damage. When possible, batteries should be stored in a cool and dry environment. They may be stored in any position; there is no need for the batteries to be stored upright. Good inventory practice of using batteries on a first-in, first-out basis will help assure that batteries are used before they have a chance to self-discharge significantly. To maximize the length of time a battery or a battery-containing product may be stored, it should be fully charged at the beginning. Batteries that will be stored for extended periods should undergo regular OCV checks and receive boost charges, either as required or on a regular schedule, such as annually, determined by storage temperature.
4.3.5.1 Storage Limits
Since storage temperature greatly affects the speed of the self-discharge reactions, it is the primary determinant of the time a battery may be stored. As indicated earlier, if the goal is to retain some functional capacity, Figure 4-43 indicates the rate at which capacity decays at various temperatures. If, however, the intent is just to avoid permanent damage to the product in storage, Figure 4-45 shows that storage times at all typical temperatures are relatively lengthy.
If cells or batteries are going into long-term storage, an initial charge prior to storage is recommended. A schedule for periodic charges should be developed based on that initial charge date.
4.3.5.2 Recovery After Storage
In most normal manufacturing situations, the batteries will go into use well before their OCV drops to 1.98 volts per cell (the zero capacity point).
If cells or batteries have been stored for extended periods which have resulted in their OCV’s being significantly below 1.98 volts per cell, although greater than 1.8 volts per cell, the special conditioning described below is recommended prior to use. As cells sit in storage and self-discharge, the active materials convert to lead sulfate (PbSO4) just as they do in other discharges. But, in self-discharge, the lead sulfate forms as larger crystals that have the effect of insulating the particles of the active material, either from each other or from the grid. This result, which is known as sulfation, is normally reversible, but may require a special conditioning procedure prior to use of the battery.
Since sulfation increases the resistance of the cell, the most effective approach to reversing it is to use a low-rate (typically 0.05C) constant-current charge with a supply capable of high charging voltages (![]() 5 volts per cell). Even though the charger may not be able to force the set-point current through the battery, it normally will be able to force a small current through. As that current works on the lead sulfate crystals, they gradually convert back to active material and the impedance of the cell goes down. Ultimately, the sulfate crystals are broken down and the battery impedance drops to normal levels. Continued charging then returns the cell to its original fully charged state. Figure 4-46 shows typical behavior for a sulfated D-cell. The initial conditioning charge may take as long as 48 hours to break down the sulfation. It is often followed by a standard discharge (0.1C) and a charge to ensure the process is completed.
5 volts per cell). Even though the charger may not be able to force the set-point current through the battery, it normally will be able to force a small current through. As that current works on the lead sulfate crystals, they gradually convert back to active material and the impedance of the cell goes down. Ultimately, the sulfate crystals are broken down and the battery impedance drops to normal levels. Continued charging then returns the cell to its original fully charged state. Figure 4-46 shows typical behavior for a sulfated D-cell. The initial conditioning charge may take as long as 48 hours to break down the sulfation. It is often followed by a standard discharge (0.1C) and a charge to ensure the process is completed.

4.3.6 SUMMARY
Starved-electrolyte sealed-lead cells and batteries possess excellent storage characteristics. Their low self-discharge rates provide superior capacity retention, permitting many products to retain an initial operating capability despite extended storage. To get best results on storage, batteries should be charged prior to storage, stored at room temperature or below, and charged prior to becoming deeply discharged.
4.4 Battery Life
Starved-electrolyte sealed-lead cells and batteries are designed to provide a trouble-free rechargeable source of electrical power that, in most applications, has a life of many cycles or years of operation.
The useful life of any battery is determined by a combination of the actual discharging and charging history experienced, as well as details of the battery’s design and construction. There are a variety of events that can result in a battery failing, either from the effects of age or because of some form of premature failure.
Premature failures may come from some manufacturing defects or from application problems. Careful attention to the manufacturing process and its rigorous outgoing quality control standards produces cells and batteries with an excellent record in their freedom from manufacturing defects. Other sections of this Handbook provide guidance on charging, discharging, and application features that, if followed, will minimize premature failures due to application-related causes. So this discussion will be confined to the effects of the aging process on battery life.
Understanding how and why a battery ages is important to product designers since there are a variety of tradeoffs that a designer may make to prolong battery life. Specifically, battery life may be significantly prolonged by the choice of charger and by the use of low-voltage disconnect circuits, but both may add unacceptable penalties in terms of cost and complexity.
4.4.1 APPLICATION DISTINCTIONS
Battery life is, first of all, a function of the type of application: float or cyclic. The critical parameter used to evaluate battery life is even different for the two applications. For float applications where the battery remains ready for service but is rarely used, the parameter of interest is calendar life: “How many years is this battery going to survive?” But, calendar time is normally less important in cyclic applications than the number of cycles. Here the question is: “How many times can I discharge and charge this battery?” The difference between float and cyclic applications was discussed in Section 2. The distinctions between the two types of applications are often more subtle than they first appear. In particular, cyclic versus float is often considered synonymous with portable versus stationary. This can be deceptive. In general, anything that is hard-wired to the electrical grid is extremely likely to be a float application. But other applications are not so clear cut. Household appliances and portable lights are often considered to be cyclic applications, but their typical duty cycles may show long periods on charge coupled with relatively shallow discharges. This implies that they should be considered as float duty for purposes of life analysis, but must be considered as cyclic from the point of view of recharging. The distinctions between float and cyclic applications will be carried through most of the discussions in this section.
4.4.1.1 End-of-Life Definition
In general, sealed-lead cells and batteries behave as indicated in Figure 4-47. At the time the cells or batteries are shipped, they are at 80 per cent state of charge or better. In use, either cycling or on float charge, they improve in capacity. After a few cycles, they have reached their rated capacity. With continued use, their capacities normally continue to gradually improve until they stabilize at or somewhat above 100 per cent of their rated capacity. The batteries then begin a very gradual decline in capacity. This decline usually continues through the end-of-life point (defined as 80 per cent of rated capacity) and on downward.

The choice of the appropriate end-of-life criterion is a subjective judgment. Some designers choose to define the end of battery life when the capacity is 50 per cent of its rated value. While this does give a longer life projection, it does so with some adverse effects on many battery applications.
For most applications, the parameter that really counts is the end-of-life capacity. Selection of the appropriate battery size must be done based on supplying the load at the end of the battery’s life. If the end of battery life is defined as 50 per cent of rated capacity, the battery size required will be double that indicated by use of the rated capacity. If the end of life is specified as 80 per cent of rated capacity, the over-sizing necessary will only be 25 per cent. If the rate of capacity loss per cycle were to be constant between 80 per cent and 50 per cent of rated capacity, the extra battery size would be compensated by an equal increase in battery lifetime. But, since the rate of capacity loss increases between 80 per cent and 50 per cent, the extra capacity does not buy the user an equivalent increase in battery lifetime. Also by designing to a 50 per cent end-of-life criteria, the product is spending a substantial fraction of its life depending on an older battery that is vulnerable to increased failures from mechanical problems.
4.4.2 AGING MECHANISMS
To appreciate battery life projections and their supporting rationale, it is useful to know something about the various aging mechanisms that affect sealed-lead batteries as they are used. In general, aging involves the positive plate, either changes in the performance of the active material (changes in plate morphology) or changes that affect the positive grid (grid oxidation).
4.4.2.1 Plate Morphology
As a battery is used, a fundamental change in the structure of the active material on the positive plate occurs. Initially, the PbO2 is in its β crystalline form which is highly active electrochemically. As the cell is charged and discharged many times, there is a gradual loss of surface area and some of the βPbO2 is converted to an amorphous structure which is electrochemically less active. The progress of this conversion accounts for the bulk of the capacity degradation noticed as the plate ages through cycling.
4.4.2.2 Grid Oxidation
The other major culprit in cell aging is the oxidation of the lead metal in the positive grid to PbO2. This process is primarily a function of the degree of overcharge (amount of current and length of time) experienced by the cell. The oxidation mechanism was discussed in conjunction with overcharging in Section 4.2. The effects on cell life are either mechanical (as discussed below) or electrical. The electrical effect is attributable to the substantially lower electrical conductivity of PbO2 when compared with the metallic lead in the grid. As the conductive cross-section of the grid is reduced, the cell resistance increases, diminishing both the current delivery on discharge and the cell’s ability to accept charge on a constant-voltage charge. This gradual loss of capacity must be weighed against the catastrophic failure caused by inadequate or improper charging.
4.4.2.3 Mechanical Deterioration
Mechanical deterioration of the cell is largely confined to the changes in the positive plate due to oxidation of the grid. Since PbO2 occupies a volume about 20 per cent greater than metallic lead, as the positive plate oxidizes, it “grows.”
This growth degrades the interface between the plate active material and the current-carrying grid. In conventional lead-acid batteries, the result is shedding of the positive active material where the active material falls off the plate and collects in the bottom of the cell. With the starved-electrolyte cell, the intimate contact between the plate and the separator lessens, but does not eliminate, degradation of the interface with grid oxidation.
Just as the grid grows out, it also grows up vertically. If clearances are too tight, this may result in the positive plate growing into contact with the negative plate terminations resulting in an internal short. Or, if the positive plate is restrained too tightly, it may actually buckle which normally also results in a short.
Lead dioxide (PbO2) has little structural integrity. The ruggedness of many starved-electrolyte batteries comes from the design of the positive plate that uses the separator to compress the PbO2 active material against the grid which supplies the mechanical strength. As the grid is itself converted to PbO2, the plate support becomes increasingly fragile. Thus, as the battery ages, it becomes more vulnerable to failure due to mechanical damage. Typically this manifests itself as loss of electrical continuity for part or all of the plate as the grid fractures due to mechanical shock or vibration.
Mechanical failures of sealed-lead batteries other than those attributable to grid oxidation are exceptionally rare when the batteries are used in normal environments. Fatigue failures of the current-conducting structures may occur in prolonged and/or intense vibration exposures. Contact the battery manufacturer for additional information on applications in nonstandard environments.
4.4.3 FLOAT LIFE
The life of the starved-electrolyte battery when used in a float application is one of its major strengths. Because of its ability to recombine the gases evolved during charge and overcharge, it will survive unattended far longer than other lead-acid battery types.
4.4.3.1 Life Definition
In float applications, the primary concern regarding life is calendar time, specifically the amount of time spent on overcharge. Most standby power systems are rarely exercised to the point of one deep discharge as often as once a month. Over a ten-year life, this amounts to 120 discharges. As we will see in the cycle-life section, this is well within most batteries’ normal cycle life. As a result, concerns over plate morphological changes are usually subordinated to minimizing the rate of grid oxidation while maintaining adequate charging. The different parameters that affect grid oxidation and their effect on float life are discussed below.
4.4.3.2 Factors Affecting Float Life
Although there are a variety of factors that may affect the life of the battery in a float application, they all focus on minimizing the overcharge current which in turn minimizes the grid oxidation.
4.4.3.2.1: Charge Current/Voltage Given that the key to long battery life is minimizing the overcharge current, how is this best accomplished? A reliable approach to charging a battery is the use of a two-step constant-current charger. This ensures a full charge to the battery before switching to a trickle-charge rate that barely replaces the self-discharge losses. This restores the battery to full charge relatively quickly and reduces the problems of cell imbalance. The only concern with this type of charger is that failure of the switching mechanism could leave the battery exposed to the full charge current during extended overcharge. For this reason, use of some form of thermal fuse to remove the charge current if the battery becomes overheated is strongly recommended.
Although the two-step constant-current charger may be the ideal from many charging standpoints, it is less common than constant-voltage chargers in float applications. There are two principal reasons for this: 1) constant-voltage chargers are simple, inexpensive, and reliable, and 2) many float applications involve series-parallel battery strings where constant-current charging is not possible. With constant-voltage chargers, the key determinant of battery life is the charge voltage. To maximize battery life, the charge voltage should be set to produce an overcharge current just greater than the battery self-discharge rate. The Tafel curves, Figure 4-30 and Appendix B, suggest that, at room temperature, a charge voltage of approximately 2.30 volts per cell will provide the minimum amount of charge current. In practice, slightly higher voltages, about 2.35 volts per cell, are recommended to compensate for intercell variations in charge acceptance within battery strings.
It is possible to see the sensitivity of life to charge voltage by examining Figure 4-48. Changing cell voltages from 2.3 to 2.4 volts per cell (a change of about 4 per cent) significantly reduces the projected life at room temperature. The method used to project the data shown in Figure 4-48 is discussed in Section 4.6.

4.4.3.2.2: Battery Temperature Since the grid oxidation reaction is temperature dependent, increasing the temperature will increase the deterioration process. This occurs no matter what charge current is flowing; however, since the increase in temperature also has the effect of increasing the overcharge current at a given voltage, the result is an intensified effect. The combined effect is seen in Figure 4-48 to result in a greater than 50 per cent decrease in life for every 10°C increase in temperature. This decrease in life may be reduced substantially if the charger is properly compensated.
Obviously the increased temperature’s detrimental effect on life is a strong argument for isolating the battery well away from heat-generating electronic components whenever possible.
4.4.3.2.3: Discharge Parameters Depth of discharge and the time between discharges are not typically major concerns in float duty. Especially for grid-connected applications, it would be extremely rare for a battery to experience a deep discharge (80 to 100 per cent depth of discharge) as regularly as once a month. This type of duty is not likely to impact the life of the battery. The one exception to this would occur if the float voltage were set so low that the battery could not get fully charged and balanced between discharges. Even this is unlikely to be a major concern in grid-connected systems. However, voltage disconnects are still recommended.
4.4.4 CYCLE LIFE
Life in a cyclic application—one where the time between discharges is of the same order as the charge time—is a significantly different situation than in a float application. The definition of life changes, the failure mechanisms are altered, and the important variables in determining the battery’s life are different. Even though the conditions may be different, starved-electrolyte sealed-lead cells and batteries continue to provide superior performance.
4.4.4.1 Life Definition
In a cyclic application, the important variable is not usually calendar time, but number of cycles at a given depth of discharge. While the concerns about overcharge and resulting grid corrosion may still be pertinent, there is an additional factor—changes in the positive plate structure—that must also be considered.
4.4.4.2 Factors Affecting Life
The variables affecting life in a cyclic environment are not nearly as simple as those occurring under float conditions. With a float application, the dominant concern was overcharge current control. Here that is just one of a variety of concerns. In a cyclic application, performance during discharge and charge affects life as much or more than overcharge.
4.4.4.2.1: Depth of Discharge Far and away, the dominant variable affecting cycle life is the depth of discharge experienced by the battery. The deeper the discharge, the shorter the life. As can be seen in Figure 4-49, the effect of depth of discharge is nonlinear. By decreasing the depth of discharge, the lifetime (number of cycles) can be significantly increased. Battery life for very shallow discharges may approach that seen for float service.
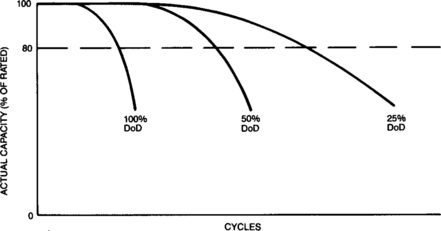
The nonlinearity of cycle life with depth of discharge is the basis for the common suggestion to oversize batteries to extend their life in cyclic applications.
4.4.4.2.2: Cycle Time Cycle time is next to depth of discharge in importance in affecting battery life simply because it determines the latitude that the application designer has in designing charging circuitry. Not just the time between discharges is important, but also whether the cycle is repetitive or sporadic. Even though the battery in a miner’s cap lamp and an oscilloscope may be designed to the same duty cycle, the charging scheme to maximize life may be very different. In both cases the batteries may be required to function on an eight-hour discharge and a 16-hour recharge cycle. But, in the miner’s cap lamp, that cycle will be repeated essentially every day. Use of the oscilloscope may be far more sporadic, i.e. heavy use for a couple of days and then sitting on charge for a week and then partial use for several days, etc. Different charging schemes may be necessary to gain maximum life in each application.
Figure 4-50 shows that cycle time increases may increase the life of the battery just because the charge time increases. It also illustrates the importance of understanding the application, since selection of the optimum voltage for a 16-hour charge (2.45 volts per cell) may decrease life significantly if the duty cycle actually results in a 28-hour charge. Conversely the voltage choice for a 28-hour charge (2.40 volts per cell) would significantly reduce cycle life if the duty cycle turns out to result in 16-hour charges instead.
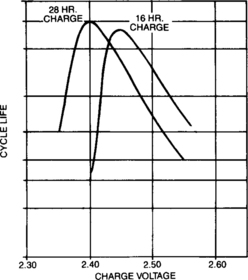
4.4.4.2.3: Charging Parameters Unlike float applications where virtually the only concern is overcharge, cyclic applications must also worry about getting enough charge back into the battery. Many designers, faced with incompatibility between quick charge and long life, select the two-step constant-current charger as a good method to handle cyclic applications. This will supply the desired quick charge while accommodating extended periods on charge. Constant-current chargers are also not affected by cycle-down problems.
Constant-voltage (CP) chargers may also be used, albeit with some caution, for cyclic applications. As discussed previously, selecting the voltage for CP chargers must consider the problem of “cycling down” in applications that do not offer opportunities for extended charging to balance cells. This means that charge voltages should be set somewhat higher than in a float application. This reasoning is reinforced by examination of Figure 4-50 where the impact on cycle life of selecting a voltage lower than optimum can be seen to be much greater than that of an equivalently higher than optimum voltage. As a starting point, some manufacturers recommend a cyclic charger voltage of 2.45 volts per cell for typical applications.
4.4.4.2.4: Battery Temperature Battery temperature is as detrimental to cycle life as it is for float life. The problem can be reduced significantly by appropriate temperature compensation of the charge voltage. Contact the battery manufacturer for assistance in selecting a temperature compensation approach for a cyclic charger.
4.4.5 TRADEOFFS
There are a variety of things that may be done to extend the life of sealed-lead batteries. In developing the design of a battery and charger combination, there may be certain design properties that can be traded off to enhance other desirable product features. Some tradeoffs that may be considered include the following:
4.4.5.1 Reliability vs. Life
In many applications it is less important to get absolutely the last drop of life out of a battery than it is to be assured that the battery will perform correctly when needed. This assurance may be gained in a variety of ways. The battery may be retired early, before grid oxidation has proceeded to the point where the battery may fail catastrophically. The battery can be oversized to reduce the depth of discharge. Charge voltages can be set higher than optimum for long life so that proper charge may be ensured thus avoiding failure by cycle down.
4.4.5.2 Charger Cost vs. Life-Cycle Savings
It is possible to trade expenditures for chargers against savings in extended battery life. For instance, two-step constant-current chargers can do much to extend the useful life of both cyclic and float applications. Whether the incremental cost of a two-step charger is justified can be determined only from the details of the specific application.
4.4.5.3 Product Life vs. Battery Life
Battery and charger designers sometimes get so involved in attempting to develop an optimum solution for long battery life, that the life cycle of the product is overlooked. There is little point in designing a battery to last for eight years if the product is only expected to last three.
4.4.6 SUMMARY
By understanding the causes of battery aging, it is possible to design battery and charger combinations that will deliver a long life, whether it is to be used in a float or cyclic application. Many applications are neither truly cyclic nor truly float. In such cases, the conservative approach — to consider the application to be cyclic and ensure that the battery is adequately charged — is normally recommended. For float applications, the approaches to long life are twofold: 1) minimize overcharge currents by controlling charge voltage, and 2) keep the battery away from high temperatures. For cyclic applications, the problem is somewhat more complex because the battery also needs to receive adequate charge during each cycle. A two-step constant-current charger often represents a good approach to charging batteries in cyclic duty. Of course, the above caveats about controlling charge voltage and battery temperature still apply to cyclic applications. A major key to designing battery applications that work effectively is to tailor battery life to the product’s needs.
4.5 Application Information
Starved-electrolyte sealed-lead batteries and cells have been used in a variety of products ranging from children’s toys to scientific experiments on the Space Shuttle. The key to their selection for such a variety of applications is their unmatched combination of economy, ruggedness, and performance. Earlier sections have provided significant detail on the attributes of the product. This section discusses some of application features permitted by these attributes. It also presents a quick summary of typical applications.
4.5.1 ECONOMIC CONSIDERATIONS
Batteries are a product whose selection is driven much of the time purely by economics. There are often several batteries that will work in a given application. In most situations, the least expensive battery, when all costs are included, is the best choice. Including all of the costs is the key to making the best selection. For example, initial cost is obviously a major factor. But if the less expensive battery lasts only half as long and requires extensive machine downtime to replace, is it a better choice? The answer to questions like this can be determined only by understanding the economics of these batteries as they are applied to a specific use pattern, operating environment and application requirement. Understanding the economic benefits of any given battery for a specific application requires examining the characteristics and features of the battery and evaluating the degree to which these attributes match the needs of the application. The following sections will consider some of the economic considerations in cyclic duty and standby power applications.
4.5.1.1 Economic Features of Cyclic Applications
Because starved-electrolyte sealed-lead batteries can be charged and discharged many times, they are frequently selected for cyclic duty applications.
It is tempting to think of the cost of a battery in terms of its procurement cost only. The procurement cost is often evaluated in terms of cost per watt-hour by dividing the purchase price by the watt-hour rating. Different batteries can be evaluated in terms of dollars or cents per watt-hour. But this simple ratio neglects other important factors including two rather important considerations: actual deliverable energy and battery life. It often will result in selection of a battery that has a higher life-cycle cost.
The actual deliverable energy depends largely upon discharge rate and battery temperature and may differ significantly from the rated conditions. (Sections 4.1 discusses these conditions in greater detail). If the drain rate is quite high or if the battery temperature is quite low in the specific application, the actual deliverable capacity may be dramatically reduced from the rated amp-hours. Starved-electrolyte batteries deliver a high percentage of their rated capacity over a wide range of conditions. The derating needed by starved-electrolyte batteries in low-temperature use is less than other batteries, providing a significant economic advantage for these applications. Hence, the cost per watt-hour for the starved-electrolyte battery (or any other battery) should be evaluated on the basis of actual deliverable energy in the specific application rather than simply using the battery’s nominal rating.
The operating life in terms of number of discharge/charge cycles is also an important element to consider. Rechargeable batteries of the same rated capacity when cycled on the same load may provide widely different numbers of acceptable discharge/charge cycles. This makes the cost per watt-hour less relevant. Battery cost for cyclic applications is more properly evaluated as the cost per actual cycle.
To be exact, the costs used for comparison should include much more than the initial costs of the batteries. They should also factor in the costs of the charging system needed by each battery and the costs associated with battery failure including the cost of replacing the battery and any cost to the system (product lost, recreating records, mission failure, etc.) when the battery fails. Since many of these costs occur later in time, standard economic approaches such as discounted cash flow may be used to make all costs comparable.
To summarize, for cyclic duty applications, it is important to compare the costs of different batteries in the actual application. In addition to the initial cost, this comparison should consider the actual deliverable capacities of the batteries at the discharge rate and battery temperature of the specific application; use the projected life of the battery under these conditions to develop a cost per cycle; and ensure that the cost per cycle includes all relevant costs. In many cyclic applications, especially those where reliability is important, starved-electrolyte sealed-lead batteries are an economical choice even though they may not have the lowest purchase price.
4.5.1.2 Standby Power Applications
In standby power applications the battery is called upon to discharge only during abnormal situations. When a power outage does occur, the battery must dependably respond to provide the needed power during the emergency. Hence, the reliability of the battery is a very important consideration. As in the discussion for cyclic duty applications, a battery can be evaluated in terms of dollars and cents per watt-hour. Again, it is important to understand and evaluate the battery upon its characteristics in the specific application. The actual deliverable energy under application conditions, not the rated performance, is the critical consideration. It is also important that all evaluations consider the battery performance at the end of life as well as when new. As batteries age, their performance degrades even though the demands on them do not. Therefore all batteries have to be oversized based on initial capacity to ensure that they meet the end-of-life performance requirements. As the degree of performance degradation with age varies widely with batteries, the amount of oversizing required and, thus, the initial battery cost also may vary greatly.
Most standby applications do not see many discharges, so calendar time rather than number of cycles is the important measure of battery life. Operating life in terms of years of service in a float condition impacts the economics of the battery selection. Standby battery costs are normally evaluated in terms of dollars and cents per year of service rather than per cycle as was the case with cyclic applications.
In addition to the initial cost of the batteries, there are a range of other costs that should be factored into the cost comparison as well. The cost of the charger, if required, should be included. The costs of battery failure need to be carefully considered. There are the obvious expenses of the service call and cost of the new battery to replace a failed or expended battery. In addition, there is the cost impact on the overall system of having the battery fail to perform when needed. This is especially important in standby applications where the battery is often backing up a critical piece of equipment. Evaluating the cost of battery failure may be tricky, but it often overshadows other cost components. Again, many of these costs occur at different times so they should be adjusted to reflect their timing using discounted cash flow or the equivalent.
Because the costs of failure are often much greater in a standby application, battery reliability is even more important than in many cyclic applications. Because of their better reliability performance when compared to traditional lead-acid batteries, starved-electrolyte cells and batteries have consistently proven themselves to be the low-cost performer in many situations.
4.5.2 CHOICE OF SINGLE-CELL VERSUS MONOBLOC BATTERIES
There are two approaches to starved-electrolyte sealed-lead battery construction: combinations of 2-volt single cells or integral batteries (or monoblocs) which package the cells as a unit in a common container and with intercell connections made internally. Either form is available in a variety of capacities. In many applications, the designer has the choice of using either a single-cell or a monobloc battery. Both batteries may have essentially identical electrical performance and, in fact, may use many of the same internal components. But the differences in packaging of the two product lines suggest different uses. Single-cell batteries are often recommended for applications sensitive to packaging configuration or applications requiring a nonstandard voltage. Most battery sizes are readily available in 6 and 12-volt versions. Other voltages, such as 4, 8, and 24, are sometimes supplied for specialty applications. Integral batteries typically offer better space utilization than an equivalent single-cell battery.
4.5.3 PHYSICAL CONSIDERATIONS
In the process of developing the design for a product using a battery, consideration must be given to where and how the battery is mounted, the packaging required to meet the application, what provisions for charging the battery should be made and other physical considerations such as temperature or vibration which might affect battery life or performance. This paragraph discusses the physical considerations of applying sealed-lead batteries to the end product.
4.5.3.1 Battery Packaging
The designer has a choice of a variety of ways of packaging the single-cell battery to meet the requirements of the application. Some of the considerations in determining the proper packaging are:
The following discussion provides only a brief introduction to battery packaging. Additional information on packaging options is also available from battery manufacturers.
4.5.3.1.1: Battery Form Factor and Configurations The form factor of a battery depends upon the size and shape of the individual modules and the number of modules in the battery. Batteries comprised of single cells can be assembled into the greatest variety of different configurations. However, even monobloc batteries may be assembled into side by side, end to end, and top to top configurations.
4.5.3.1.2: Cases Most monobloc batteries and many single-cell applications do not use any form of case. With single-cell applications, the design must eliminate the possibility of short-circuiting between the terminals. Battery packs for multi-cell batteries can be furnished with a number of different casing materials and configurations. The case material may be a simple heat-shrinkable plastic sleeve, a rigid plastic tube, a vacuum-formed plastic case or an injection-molded plastic case. In some applications, the battery case may be an integral part of the device.
4.5.3.1.3: Interconnections and Terminations A wide variety of battery interconnections and terminations is available.
Intercell connections on single-cell batteries are normally made with welded metal strips. For special assemblies, the intercell connections may be soldered wire of the appropriate size. In high-vibration applications, braided-strap intercell connectors are sometimes used.
Battery terminations may range from the bare spade terminals through soldered wire leads to polarized connectors. The major concerns here are reliability, economy, assurance of proper polarity, and elimination of short circuits.
4.5.3.2 Mounting the Battery
When determining where and how to mount a sealed-lead battery, the application designer can take advantage of its battery’s ruggedness and sealed, no-maintenance construction. Mounting constraints, such as keeping the battery upright, away from valuable equipment, and accessible for routine maintenance or replacement, are largely eliminated.
The mounting flexibility of the sealed-lead battery is illustrated by two examples:
• Both aircraft and computer manufacturers integrate starved-electrolyte sealed-lead batteries with other electronic equipment.
• Starved-electrolyte sealed-lead batteries often find application in electric-start walk-behind lawn mowers. This environment combines much of the worst of heat, vibration, and nonstandard mounting positions.
The following sections will describe how best to utilize the flexibility of the sealed-lead battery.
4.5.3.2.1: Where to Mount the Battery The battery may normally be mounted where it is most useful in the product. This involves several considerations. If the product is portable and the battery is relatively heavy, it may be desirable to mount the battery so its weight is evenly distributed for easy handling. In applications where the battery is required to deliver high bursts of power to the load, locating the battery as close to the load as possible will minimize line losses.
Despite the best efforts of the battery manufacturer and the application designer, batteries are often subjected to life-threatening abuse by the end-user. It may make sense to have the battery readily accessible for replacement.
If possible, the battery should be mounted as far away as possible from heat generating components. As pointed out earlier, the higher the average battery temperature, the shorter the battery life. The designer should make every attempt to mount the battery in the coolest spot and/or provide ventilation of some sort whenever temperatures above ambient may be encountered.
4.5.3.2.2: How to Mount the Battery After having located the battery, the designer must then select a method of attaching it securely. Several considerations, such as shock, vibration, temperature, maintainability, access, type of enclosure, weight, etc. affect the choice of attachment method. A relatively immobile battery may simply be located on its own base within the application without special mounting. Other batteries, due to location and external forces, may require special bolts through the case into the mount. Some may be located in a separate pocket or brackets supplied on the product as is the case in many power tools. In any event, the mounting must be compatible with the battery configuration, weight and external forces. In all situations the mounting method must be such that it will not damage the battery or electrical connection.
4.5.3.2.3: Safety in Mounting the Battery Safety in using sealed-lead batteries is discussed in detail in Section 4.7. The information there should be carefully reviewed prior to designing any battery application. Some specific safety considerations in mounting sealed-lead batteries are discussed below. Sealed cells and batteries will vent when the gas pressure within rises due to normal overcharge, accidental misuse, abuse or possible charger failure. Even though battery venting is relatively minimal, all enclosures in which sealed-lead batteries are mounted must be designed so that vented gases will not be retained. If the gases which may be vented from the battery are confined within an external container, there is a possibility of an explosion. Simple venting holes in the outer housing eliminate this concern. In addition, the battery must not be mounted in such a way that it might operate submerged in water. The battery potential is sufficient to electrolyze dirty or salty water thereby forming hydrogen gas at the external positive terminal.
The short circuit current of these batteries is very high which can cause severe bums. The battery should be mounted so that an accidental short circuit cannot occur.
Finally, the battery should be mounted to minimize the possibility of physical damage.
4.5.3.2.4: Heat Transfer in Mounting the Battery Batteries on charge or overcharge generate heat. This is normally not a problem as the heat is rapidly dissipated. However, mounting a battery to minimize cell temperature build-up may be a concern in certain severe applications, particularly when the cells are insulated or enclosed. For battery applications that require operation under one of the following conditions, heat transfer in mounting should receive special attention.
A simple test can be conducted by burying a thermocouple in the battery pack and measuring the temperature rise on both charge and discharge. As discussed in Section 4.4, high temperatures will eventually lead to battery failure. Hence, if the temperature rise in the application can be reduced by ventilation or “heat-sinking”, the overall battery life will be extended. Many packaging engineers use a large heavy-duty metal strap to clamp the battery to the equipment; the strap also serves to conduct heat away from the battery to the equipment chassis.
4.5.4 OPERATING ENVIRONMENT CONSIDERATIONS
Once the battery has been mounted in the equipment, it may be exposed to an environment that can have a drastic effect on the battery’s life and performance. The major environmental factors that need to concern designers using batteries are discussed below.
4.5.4.1 Operating Temperatures
Batteries operate best in moderate temperature conditions. Extreme operating temperatures are generally detrimental to the sealed-lead battery system, causing either degradation of performance (cold temperatures) or reduction of operating life (high temperatures). While, in certain applications, sufficient performance may be obtained outside these limits, a maximum operating range of −40°C to +60°C is typically recommended.
Operation of these battery systems at high temperature accelerates the nonreversible degradation of performance. As discussed previously, proper temperature compensation of chargers will minimize this degradation. High temperatures also increase self-discharge rates thereby decreasing the time the battery can be stored before a charge is necessary.
Operation toward the low end of the recommended temperature range results in a predictable loss of available capacity, but there is no danger of physical damage to charged sealed-lead batteries from low temperatures. Thus fully charged sealed-lead batteries may be stored without problem at temperatures down to −65°C.
4.5.4.2 Relative Humidity
Sealed-lead batteries may be operated in all humidity ranges normally suitable for electrical and electronic components. When operated continuously at 95 per cent relative humidity or higher, the terminals, interconnecting straps and steel cases (as applicable) may show modest cosmetic rusting. The sealed-lead cells and batteries have successfully passed the humidity and salt-spray tests of M1L-STD-810.
4.5.4.3 Vacuum or Pressure
Being sealed, starved-electrolyte batteries may be used in either a vacuum or positive-pressure environment. The resealable safety vent operates on differential pressure so that it adjusts to whatever external pressure exists.
4.5.4.4 Corrosive Atmosphere
Sealed-lead batteries are constructed so that they will resist corrosion in most environments found in commercial applications. In very severe corrosive environments it is possible for the metal parts to corrode, but in most commercial applications this is not generally a problem. Contact the battery manufacturer for assistance if the ambient environment is expected to be extremely corrosive.
4.5.4.5 Shock and Vibration
While sealed-lead batteries offer excellent overall vibration resistance, exposure to prolonged and/or intense vibration may cause premature failure. Most standard product lines are designed to withstand the shock and vibration encountered in routine shipments via common carriers as well as that encountered in most commercial applications. The survival of sealed-lead batteries in walk-behind lawn mowers demonstrates a vibration resistance not found in other lead-acid batteries. There are a few design measures that can be used to reduce the vulnerability of sealed-lead cells and batteries to vibration damage. Two types of vibration-induced failures are seen most often: shearing of the plate tabs and current collectors within the cell or failure of the cell terminals external to the cell.
The internal failure mode is most pronounced when the battery is vibrated in the “vertical” direction. In such situations, the pack containing the plates and separator may start moving relative to the cell container. This movement, if it persists, normally results in fatigue failure of the parts that carry the current from the positive plate to the positive terminal. If the battery can be oriented so it experiences vibration in the “horizontal” rather than “vertical” direction, its vibration resistance is normally increased.
External failure of the terminals is predominately seen with batteries of single cells although batteries of multiple monoblocs may also experience the same difficulty. The problem arises when two cells or monoblocs that are rigidly interconnected begin to move relative to each other under the influence of the vibration. This will normally cause fatigue failure of the terminal or the interconnection. Two methods may be used to reduce or eliminate these failures. One approach is to eliminate cell-to-cell movement within a battery case by either gluing the cells to the case or using an interference fit to hold the cells in the case. A second approach is to provide a flexible interconnect between cells which allows movement between cells without fatigue failure of the electrical linkage. If soldered stranded-wire intercell connections are used in a vibration application, they must be sufficiently long to allow adequate flexibility after the wire has been tinned.
4.5.5 TRANSPORTING STARVED-ELECTROLYTE SEALED-LEAD CELLS AND BATTERIES
The unique construction of starved-electrolyte sealed-lead cells and batteries makes them exceptionally easy to transport. With their starved-electrolyte design, they are not subject to the electrolyte spills and corrosion that cause concern with other lead batteries. This advantage has been recognized by various regulatory bodies. Both the U.S. Department of Transportation and the International Air Transport Association have accepted some forms of starved-electrolyte batteries such as those from Gates for shipment as dry batteries. This means that they may be shipped by air in normal packaging without special handling or precautions. Contact the battery manufacturer for supporting documentation.
4.5.6 FUNCTIONAL APPLICATIONS FOR SEALED-LEAD BATTERIES
Sealed-lead batteries are being used in many different applications, most of which can be segmented into four functional types:
4.5.6.1 Standby Battery Power
One excellent application for starved-electrolyte sealed-lead batteries is in systems which require backup or standby power. As electrical and electronic systems continue to replace human and mechanical systems, everyone is increasingly dependent on the continuity of electrical power. The increased importance of electrical service during power outages and momentary interruptions is leading many equipment designers to provide backup power. This backup may be built into the device or it may be an external unit such as an uninterruptible power supply. In addition, some devices are designed to operate only during the period of a power outage, to provide safety for people in situations which might cause alarm or danger as a result of the power interruption. These situations also require a reliable battery, ready to serve upon instantaneous call.
There are three ways a sealed-lead battery can be used in standby power applications:
The major use of batteries in standby applications is to maintain vital functions despite the loss of power from the grid. An excellent example is the telephone system which uses an array of batteries and engine-generator sets to provide phone service even when the grid power is unavailable. Sealed-lead batteries are used in a variety of telephone installations for backup power. Their size, reliability, ruggedness, and no-maintenance features make them especially well adapted for distributed applications such as switching systems and line concentrators. Sealed-lead batteries are also used in a multitude of other products such as security alarms, computers, and medical equipment that must continue to work during an interruption in grid power. Sealed-lead batteries are especially well-suited for backup that is integral to the product. Because they are clean and maintenance-free, they can be embedded in the unit rather than having to be separated in their own area.
Even though integral backup is becoming more common, many applications choose to use a separate external power system instead. These uninterruptible or switched power systems are increasingly choosing starved-electrolyte sealed-lead batteries because of their reliability and long life.
A good example of the case where the battery initiates a function once the power interruption occurs is battery-powered emergency lighting. Normally the light is off and the charger is keeping the battery fully charged. Once the line power fails, the battery is used to power the light.
In other situations, the basic equipment function is not sufficiently vital to be kept going when the power goes off, but there is a shutdown procedure that should be accomplished to minimize problems with the system. A classic example is seen with many computer systems where records need to be transferred from volatile memory to nonvolatile memory before the system shuts down and the information is lost.
As microprocessors become integral elements of things as simple as toys and household appliances, the importance of limited battery backup increases. Many of these devices use volatile memory to retain instructions or data. They need backup power to retain their memory even when the power is shut off.
Starved-electrolyte sealed-lead batteries are the choice for many designers of equipment requiring standby power because of their very long life, reliability, and simple charging in float applications. The flexibility in mounting these batteries is a significant feature where space is at a premium.
4.5.6.2 Engine Starting
Starved-electrolyte sealed-lead batteries have very low internal resistance which permits very large peaks of power for short periods. One application for short, but very high, power delivery is in gasoline engine starting. One application in particular, electric-start walk-behind lawn mowers, is considered by many to be one of the roughest tests of a battery that exists today. Practically everything is wrong. The battery is often mounted where it is exposed to high temperatures from the engine and high vibration from the blade. The charging system is rudimentary. Duty cycles may combine long periods of disuse with periods of many discharges in a brief amount of time. Starved-electrolyte sealed-lead batteries have been acclaimed as the best batteries available for this application.
4.5.6.3 Portable Power
Sealed-lead batteries are often used as the primary power source for portable consumer appliances, tools, lights, and toys.
Duty cycles for many of these items are close to float service. Consumers may use their portable vacuum or rechargeable light once a week and leave it on charge the rest of the time. This type of service is well-suited to constant-voltage float charging using the sealed-lead battery. Strength in charging combined with high current deliveries and acceptable power densities have made sealed-lead cells and batteries economical choices for many portable power applications.
4.5.6.4 Alternate Power Sources
In addition to the portable power applications discussed above, sealed-lead batteries are frequently used as an alternate power source to the normal AC line power. These applications are also portable but are normally powered from the AC line through a built-in DC power supply. When the portable feature is desired, the AC line cord is unplugged and the unit is immediately portable. The battery is normally charged from the built-in DC power supply when the unit is plugged in and is usually fully charged, ready to go, when the line cord is unplugged. The sealed lead battery is ideal for these applications because it can be charged continuously using a properly designed constant-voltage charger with little or no reduction in overall life. And because the charge retention of these batteries is excellent, the battery holds its power during long periods of “off” time when the device is not being operated.
A good example of an alternate battery power source application is the portable television set. The battery equipped portable television set is normally operated from AC line power. Whenever the set is plugged into the line, it operates from line power while the battery is charged and maintained at full charge. If someone wishes to operate the TV away from the convenient wall outlet, the battery is ready to do the job. After the use, the battery is automatically recharged once the set is plugged back in the AC power receptacle and is quickly ready for its next outing.
A second example of an alternate battery power source application is in portable instrumentation, such as voltmeters and oscilloscopes. Again, the instrument normally runs from the AC line, but is ready to be removed to a remote location in a fully charged condition.
4.5.7 SUMMARY
Starved-electrolyte sealed-lead cells and batteries are the practical answer to battery needs for a diversity of applications. Because of their longer life they can provide low life-cycle costs. They also provide a degree of flexibility in both location and acceptable environments that allows creative product design. Starved-electrolyte sealed batteries are available in both integral (monobloc) and single-cell versions. Standard factory-assembled batteries offer a variety of options in battery shape, size, case enclosure, and electrical terminations. In addition to the standard designs, single-cell batteries can also be assembled into special designs to meet the needs of specific applications. Because sealed-lead cells are clean and rugged, mounting, location, and environmental constraints on their use are minimized. As a result of their performance benefits, starved-electrolyte sealed-lead cells and batteries are used in standby power, engine starting, portable power, and alternate power applications.
4.6 Battery Testing
The keys to success in designing applications that use batteries are knowing:
• the performance characteristics associated with various batteries,
• understanding how these characteristics will be expressed in the applications’s operating environment, and
Most designers find that application-related testing is an essential part of the design process. To maximize the return from testing efforts, testing should be carefully planned and should build upon the information available from other sources (such as this Handbook and consultation with the battery manufacturer). This section provides some suggestions on when battery testing may be advisable and on ways to get the most from the testing.
Battery testing is normally performed for two major purposes:
1) battery characterization — studying how the battery is likely to perform under representative conditions and conducting head-to-head comparisons of different candidate batteries. The results are data that the designer can use in selecting and specifying the battery and designing the supporting equipment.
2) product verification testing — ongoing testing that allows verification of battery quality as part of the manufacturing process.
4.6.1 CHARACTERIZATION TEST PROCEDURES
Battery characterization tests provide information on battery performance for a specific application. These tests may range from the very simple (a one-shot trial to confirm a specific data point) to the very complex (an elaborate test matrix designed to obtain statistical data that will allow optimization of the battery to the application). Unfortunately, there are few generally accepted test procedures or protocols. Each prospective battery user has to develop test procedures that are justified by the design margins in the product.
It is important in gaining maximum usefulness from these tests that the application parameters be well understood. Such particulars as motor loads, duty cycles, frequency of use, etc. should be carefully defined prior to testing to ensure that the tests are relevant to the actual product as it will be used.
For cyclic applications, the battery characteristics of interest normally consist of the following items, listed in generally descending order of priority:
• discharge performance — can the battery meet the electrical requirements for the specified length of time at the lowest temperatures expected for the application?
• charge acceptance — will the battery recover quickly enough to meet the required use profile? How will that recovery be affected by a continuing series of charge/discharge cycles?
• cycle life — how many charge/discharge cycles can the battery reasonably be expected to survive?
• deep discharge — can the unit gracefully survive being completely discharged before recharge?
• Storage life — how long can the product be in the distribution chain and still retain functionality?
• Retesting — determination of the battery’s effective internal resistance allows prediction of the battery’s voltage under various current loads.
• mechanical/environmental behavior — will the battery operate properly in the location and orientation proposed for it? Will it survive the mechanical abuse that the unit might experience?
For float applications, the battery characteristics of interest are much the same. Some of the concerns in the cyclic list reflect the fact that these are often portable applications. These issues are not normally as important for float applications and are often replaced with questions about cell balancing and overcharge currents. Testing for float applications normally involves some of the following items, listed in generally descending order of priority:
• discharge performance — can the battery carry the load for the specified length of time at the lowest temperatures specified?
• charge acceptance — will the battery recover quickly enough to meet the required multiple outage scenario, especially at low temperatures? Is the charging adequate to maintain battery balance? What are the overcharge currents, especially in any elevated temperature scenarios?
• float life — how long will the battery survive in this application under the proposed overcharge currents?
• Re testing — determination of the battery’s effective internal resistance allows prediction of the battery’s voltage under various current loads.
• mechanical/environmental behavior — will the battery operate properly in the location and orientation proposed for it?
4.6.1.1 Preparation for Testing
No matter what characterization testing will be performed, the first step is to develop a properly prepared and conditioned sample of batteries. For various reasons, batteries may arrive for test at different states of charge. Therefore it is important that batteries be prepared for testing by cycling them until their actual capacities are stabilized at a value equal to or greater than the rated capacity.
4.6.1.2 Discharge and Charge Acceptance Tests
Often the first set of tests to be performed are those that confirm the successful operation of the battery under nominal conditions, i.e. with the battery new, but stabilized; charged in the optimum manner; and at room temperature. If the battery can not meet the load requirements under favorable conditions, there is no point in continuing. Assuming those tests are favorable, battery operation should be confirmed at the temperature extremes for which the product is expected to operate.
Once the basic ability of the battery to accommodate the load has been determined, then the charge acceptance of the battery can be tested. It is essential that the ability of the proposed charging system to charge the battery within the expected application profile be closely examined. This is where careful testing and feedback to those developing the application requirements will pay substantial benefits to the designer. The result can be substantial cost savings and/or performance improvements through a better understanding of battery behavior.
4.6.1.3 Life Tests
As might be expected, the type of life test employed depends on the type of duty the battery will see.
4.6.1.3.1: Float Life Battery life for a float application is normally determined by the battery’s ability to survive on a constant charge. The major influences on float life are temperature-dependent electrochemical reactions. Therefore, testing at elevated temperatures can, theoretically, be used to project life at normal conditions through the Arrhenius equation. The approach used in the battery industry has been summarized by E. Willihnganz. As indicated in Figure 4-51, testing at 60°C can condense a normal float life of 8 to 10 years to approximately 6 months. Typical tests involve use of well-regulated ovens containing battery samples being charged at the room-temperature float voltage. At monthly intervals, the samples are removed, cooled to room temperature, and given discharge tests.

Use of this form of accelerated testing should be very limited and extrapolation of the resulting data to room temperature applications done very cautiously. The failure mechanisms that limit the life of sealed-lead batteries are not the same at all temperatures. The failure mechanisms at 60 or 70°C are not necessarily the same ones seen at room temperature; in fact, they are often quite different. Accelerated life testing, if used at all, should be limited to providing qualitative information regarding battery performance. Only extended testing under actual conditions will provide definitive information on battery life in a float application.
4.6.1.3.2: Cycle Life Battery life for a cyclic application is normally determined by the number of charge and discharge cycles that the battery can withstand. Unfortunately, testing for cycle life is difficult to perform and the results may be hard to interpret. It can be both expensive and time-consuming. As a result, proposals for cycle testing should be carefully scrutinized prior to committing to the testing.
Normally cycle testing is performed on some form of automated tester that will repeatedly cycle the battery through a nominal charge/discharge cycle. Failure occurs when the battery will not meet the required discharge time. The temptation, of course, is to adopt an abbreviated duty cycle to accelerate the testing. It is extremely difficult to do this and keep the test meaningful. The pacing item is normally the charging time. If the charge time is decreased and the discharge is not decreased, the ratio of charge to discharge is jeopardized and the results may not be meaningful. If the discharge time is also decreased, another problem arises. As shown in Figure 4-52, cycle life is a very nonlinear function of the depth of discharge so that using results at one depth of discharge to predict performance on another discharge is very shaky. Because the test apparatus is expensive, the number of samples that can be cycle tested is usually limited. The result may be the estimation of cycle life by the questionable extrapolation of inadequate quantities of test data. Accelerated cycle testing may be useful to rank or compare the performance of different groups of batteries, but as a tool to predict useful life, it is usually questionable. Only if the proposed cycle can be exactly repeated is cycle testing useful as a prediction of battery cycle life.

4.6.1.4 Storage Life
Tests for capacity retention in storage can be conducted using elevated temperature tests similar to those used to estimate float life. Since the pertinent self-discharge reactions in the battery follow the Arrenhius equation, storage time as a function of temperature is of the form shown in Figure 4-53. Thus, by testing batteries for self-discharge at 65°C, three years storage at room temperature can be duplicated in about two months.

4.6.1.5 Overdischarge Recovery
For those applications where economics preclude using a disconnect circuit, the battery may be vulnerable to overdischarge by inadvertently being left connected to the load. In this situation, tests that indicate battery performance under deep discharge conditions may be useful. These tests typically involve leaving the battery to discharge through a resistor for an extended period and then requiring the battery to meet a certain discharge standard after one or two charge/discharge cycles. While such tests are instructive, the designer should understand that deep discharge of this magnitude is an abusive condition for many common batteries. He or she should not expect the battery to survive repeated or prolonged deep discharges of this type without adverse effects.
4.6.1.6 Effective Internal Resistance, Re, Testing
Numerous measurement methods have been used for determining effective internal resistance of a cell. The value measured on a given cell depends on the method chosen. It is therefore important that, in any comparison of Re values or in any communication about Re values, the measurement method be fully defined.
Methods presently in use include AC milliohm meters (1000 Hz), mid-point voltage comparisons at various constant current discharge rates, and the two-current method. The second and third methods yield approximately equal measured values, while the first method results in a very low measured value. The two-current method is endorsed by many manufacturers and battery users because it results in what is felt to be the most useful value and because the measurement can be made very rapidly. The Re value is used to predict the expected voltage delivery as a function of a constant discharge current. See Section 4.1.4.
The method recommended by many manufacturers is similar to that given in Paragraph 9.4 of ANSI Standard C18.2-1984: Specifications for Sealed Rechargeable Nickel-Cadmium Cylindrical Bare Cells. It was selected because it provides a realistic measured value while promoting standardization within the industry.
The test is conducted by discharging the battery at a high rate and then switching to a substantially lower rate. The voltage at the battery terminals and the current is measured immediately before switching and again after the voltage has stabilized after switching. The effective internal resistance is then calculated as:
Re = –ΔV/ΔI = (VL – VH)/(IH – IL)
Designers interested in conducting Re measurements should either refer to the ANS1 publication or contact the battery manufacturer for specific recommendations on the testing protocol.
4.6.1.7 Mechanical and Environmental Tests
Batteries used in most commercial applications typically have few formal environmental or mechanical requirements imposed. Those requirements that are imposed are often tests to ensure that the batteries can survive normal shipping and customer use. Sealed-lead batteries, both single-cell and monobloc, are rugged enough that these tests are rarely a problem.
4.6.2 PRODUCT VERIFICATION TESTS
The characterization testing provides a picture of how the battery should perform. The role of product verification testing is to indicate that the batteries will actually perform as they should.
The simplest product verification test is a combination of a visual inspection for obvious problems plus an open circuit voltage measurement. For most lead batteries, the open circuit voltage (OCV) is a good indication of the battery’s general health. Many manufacturers have established standards for the OCV as a function of time since charge. Gross deviations from these standards or wide swings in OCV within a lot of batteries may suggest possible battery problems. In such cases a more thorough screening using capacity sampling is indicated.
Capacity sampling is a better, although more expensive, indication than the OCV of the status of a battery lot. Here, a select sample of each battery lot is discharged for residual capacity, charged, discharged again, and given a final charge. The first discharge indicates possible problems in storage while the second discharge can alert the manufacturer to potential battery quality problems.
Table 4-3 indicates recommended product verification tests and acceptance levels.

4.6.3 TESTING LOGISTICS
The equipment needed for battery testing is generally typical of that found in any electrical lab. Availability of power supplies for charge often turns out to be the limiting factor for battery testing. Loads for discharge testing may be either resistors or power supplies used as loads. However, specialized units are available that provide either constant current or constant power discharges adjustable over relatively wide ranges. These programmable electronic loads are fairly economical and do much to improve data quality and increase the speed of data collection.
If cycle testing is to be pursued on a regular basis, an automatic tester is required. These can range from a relatively simple relay-controlled collection of timers and switches to sophisticated switching and monitoring units. For many cyclic applications, either manual cycling or a simple timer/relay-controlled cycle tester may be all that is justified by the resources available, the schedule, or by the sporadic need for repetitive testing. Computerized cycle testing units are mainly appropriate to high-volume product characterization applications.
Scheduling a battery test program can be very challenging and a different experience from most other types of electrical tests. This is due to the long test times often involved. Frequently one test a day is the fastest possible pace. Manpower requirements for this type of testing are often comprised of long periods of inactivity combined with periods of very intense activity.
4.6.4 TESTING PRECAUTIONS
In testing batteries, common sense should prevail. Batteries can bite if abused or misused. The safety precautions discussed in Section 4.7 should be followed in any testing.
4.6.5 BATTERY TROUBLESHOOTING
There may be occasions where a cell or battery is suspect. In such cases, Gates has found the standard evaluation procedure shown in flow chart form in Figure 4-54 to be useful. This troubleshooting procedure will normally distinguish between batteries suffering from a temporary failure due to the way they have been utilized and batteries that have permanently failed.
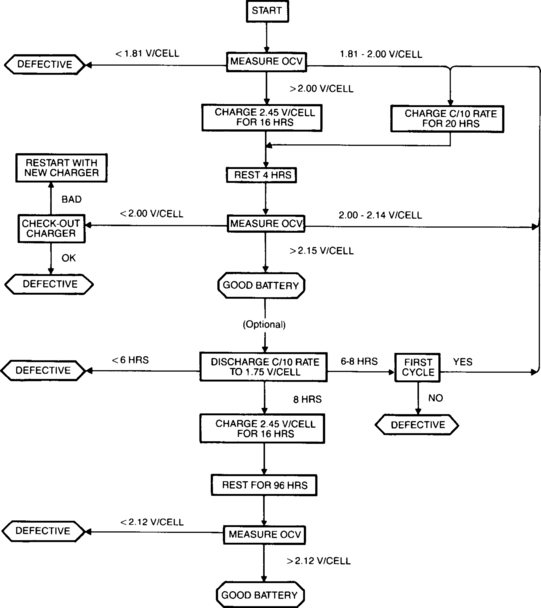
The permanent failures can then be evaluated to determine the application parameters that may have resulted in their failure.
4.6.6 SUMMARY
Proper application of a battery can substantially increase the effectiveness of the entire system. This often requires knowing specifics of the battery’s performance that can only be obtained by testing. Working closely with the battery manufacturer to develop a testing approach can make use of the manufacturer’s substantial background and experience to minimize the test effort needed.
If testing is necessary, the key message is to plan ahead. Battery testing is not especially tricky or difficult, but it is time-consuming. The careful and patient designer can get much useful information from battery testing without excessive costs.
It is especially important to carefully examine the interaction between the application profile (charge and discharge) and the actual charging system intended for the product. Although information on battery life is highly desirable, it is also difficult to obtain. Accelerated testing methods are often used to project both float and cyclic life, but interpretation of the results from such tests can be extremely tricky.
4.7 Safety
Starved-electrolyte sealed-lead cells and batteries have compiled an excellent safety record. Over one hundred million cells and batteries have been produced for use in a diversity of both consumer and industrial products. When properly applied, these cells are a valuable, safe source of electrical energy. However, like any other battery type, sealed-lead batteries present possible hazards if mistreated or misapplied. The following sections discuss the various areas of concern and suggest ways of reducing or eliminating possible problems.
There are a number of very important CAUTIONS which should be clearly understood by all who use these batteries, including the OEM, those in the marketing distribution channels and the end user. These CAUTIONS are:
• These cells contain toxic materials.
• Use approved charging methods only.
Appropriate caution labels should be placed upon batteries and battery-operated devices.
4.7.1 CELL CONTENTS
Sealed-lead batteries rely on the interaction between sulfuric acid and various lead compounds to provide electrical energy. These active materials are retained within the plastic cell jar and plastic lid which normally prevent any contact with the cell contents once the batteries leave the factory. However, the cell active materials are toxic and corrosive. Exposure to them should be avoided.
Starved-electrolyte systems operate with the majority of the electrolyte either contained in the plate or adsorbed on the fibers of the separator. There is little free electrolyte to leak if the cell jar is damaged. However, the electrolyte is sulfuric acid in concentrations strong enough to cause serious bums. In case of cell rupture, leaking electrolyte, or other problem that results in SKIN OR EYE EXPOSURE TO THE ELECTROLYTE:
In cases of contact with skin, consult a physician if burning or redness persist If eye exposure occurs, FLUSH WITH WATER FOR 15 MINUTES and consult physician.
4.7.2 SHORTING PRECAUTIONS
Because of its low internal resistance, the sealed-lead cell can provide exceptionally high currents. Normally this is considered a design virtue, but it also means that they can provide dangerous currents when the batteries are inadvertently shorted. Burns to personnel, fires, equipment damage, and battery damage may all occur if cells or batteries are allowed to short. Since sealed-lead batteries are normally maintained in a charged state, even during shipment and storage, care must be taken throughout the battery’s life to prevent shorting.
Solutions to this potential problem generally include some combination of battery design and good housekeeping practices.
Several steps can be taken with multi-cell or monobloc batteries to eliminate the possibility of damaging shorts. These precautions include (1) physical design of the battery package to minimize the possibility of simultaneous contact with both terminals; (2) using a current-limiting device such as a fuse or resistor as part of the battery package; (3) terminating the battery with a polarized female connector, and; (4) if necessary, diode protecting the charging leads so that the battery can not discharge through them if they are shorted.
With both cells and batteries, consistent use of insulators to cover battery terminals will prevent problems with shorts.
4.7.2.1 Handling Cells and Batteries
Since the terminals of the sealed-lead battery are often upright and exposed, short circuits are best prevented by use of good housekeeping practices as summarized below:
• Whenever possible, keep at least one terminal insulated with a removable cap.
• When working around cells or batteries, always remove rings, watches with metal bands, necklaces or other jewelry which might accidentally complete the circuit.
• Never place a cell or battery in a drawer, trash can, or other receptacle in such a way that it might tip over and short circuit against the walls or that it might short circuit through other metallic contents.
• Do not use uninsulated tools when working with cells or batteries.
• When wiring cells or batteries, beware of the strong affinity of the loose end of the wire for the opposite terminal to the one being wired.
• Never lay any conducting metal part on top of a cell or battery, or place the battery terminals in contact with a metal surface.
• Never place a cell in a pocket containing metal objects such as keys, coins, etc.
4.7.2.2 Shipping and Storage
Millions of cells and batteries, properly packed, have traveled millions of miles without incident. However, improperly packed cells or batteries when exposed to the vibration of long-distance truck transportation can short and possibly even ignite the packing materials with unpleasant consequences. The keys to proper shipment are simple:
• Where possible insulate the tabs to prevent contact.
• Use proper packaging materials. Lead cells and batteries are heavy and deserve the protection of adequate strength boxes. Advice on box specifications is usually available from the battery manufacturer.
• Package the product so it cannot move around or tip over. Use styrofoam “popcorn” packaging materials with great care with batteries. Since batteries, because of their weight, tend to “swim” around in the packaging, use of popcorn is advised only for individually protected batteries.
• If stacking cells vertically, remember that cell bottoms are metal and of sufficient diameter to provide an excellent shorting path for the terminals of the cell below. Insulation between layers of cells must resist breaking down under the stress of transportation.
• Boxes of lead cells and batteries are surprisingly heavy for their size. Avoid over-stacking boxes of cells or batteries so that the packaging of the lower tier is damaged. Make sure that the freight company does not overload packaging by stacking other cargo over batteries.
If shipping quantities of cells or batteries, consulting in advance with the battery manufacturer on packaging design and shipping procedures can help ensure that the product is received intact.
4.7.3 VENTING PRECAUTIONS
Although sealed cells and batteries vent significantly less gas than other forms of lead-acid battery, the gases vented will contain oxygen and/or hydrogen. The vented gases normally diffuse rapidly into the atmosphere; however the mixture of hydrogen and oxygen can be highly explosive if inadequately diluted. Even though venting rates are low during normal charging, BATTERY ENCLOSURES SHOULD BE DESIGNED WITH ADEQUATE VENTILATION to prevent an accumulation of explosive gases. DO NOT CHARGE ANY LEAD-ACID BATTERY, INCLUDING SEALED-LEAD CELLS AND BATTERIES, IN A GAS-TIGHT CONTAINER.
A second consideration is the potential failure of the charger. If the charger fails, causing higher than recommended charging rates, substantial volumes of hydrogen and oxygen will be vented from the battery which must not be allowed to accumulate.
These cells should never be totally encased in a potting compound, as this prevents the proper operation of the venting mechanism and can lead to dangerous pressure build-up.
4.7.4 OVERCHARGE PROTECTION
Certain forms of chargers, especially two-step constant-current, can fail in a manner that causes the battery to see a substantial level of overcharge. This may result in substantial venting from the cell, overheating, and, ultimately, failure of the cells. A thermal fuse mounted so it can sense the batteries being overheated is strongly recommended as part of either the battery or the charger circuitry.
4.7.5 DISPOSING OF BATTERIES
Sealed-lead batteries, because they contain lead compounds, have been classified as a hazardous waste that may require special handling depending on applicable federal, state, and local regulations. Organizations needing disposal information should contact their battery manufacturer for advice on the procedures to be followed.
In disposing of sealed-lead batteries, the following precautions should be observed:
• Dispose of these batteries after first discharging them or insulating the terminals to prevent accidental shorting.
• Do not incinerate or expose to fire or high heat, as the cell may burst and spray acid over a large area.
• Disposal of sealed-lead batteries should always conform to applicable regulations.
4.7.6 SUMMARY
Starved-electrolyte sealed-lead cells and batteries, when properly applied, are safe and effective power sources. Proper application includes observing the appropriate precautions: The battery should not be confined in a gas-tight environment. The battery should be protected if charger failure could lead to excessive currents. Since sealed-lead cells and batteries may produce high currents if shorted, proper precautions against shorting should be used in packing, shipping, handling, applying, and disposing of the product. The cells contain toxic and corrosive materials; exposure to the cell contents should be avoided. Disposal of sealed-lead cells and batteries should be in full compliance with applicable federal, state, and local regulations.