
Sealed Nickel-Cadmium Cell and Battery Product Line Data
This Appendix provides specific data on the Gates sealed nickel-cadmium product line to complement the more general information on sealed nickel-cadmium cells provided within the body of the Handbook. Because Gates is continually changing and improving its product to reflect customer needs, the data presented in this Appendix may not reflect existing production. Consulting with Gates sales engineering and technical marketing personnel early in the design process will provide access to current performance data. Gates personnel can also help meet special needs or resolve application problems.
CELL PRODUCT LINE OVERVIEW
Gates sealed nickel-cadmium cells are produced in the following general classes:
| Cell Series Designation | Description |
| G | VALUMAX™—Cells designed for typical applications. Capable of recharge at rates up to C/3 and continuous use (discharge, charge, and overcharge) in temperatures up to 50°C. |
| GF | VALUMAX Fast Charge—Cells for use in fast-charge applications (with charge termination controls). Capable of recharge at rates up to 1.2C and continuous use (discharge, charge, and overcharge) in temperatures up to 50°C. |
| GX | GEMAX™—Gates maximum power product designed for high capacity and high discharge rate applications. Capable of recharge at rates up to C/3 and continuous use (discharge, charge, and overcharge) in temperatures up to 50°C. |
| GXF | GEMAX Fast Charge—Cells that combine the discharge benefits of the GEMAX product with accelerated charge (using a charge-termination charger) features. |
| GH | Goldtop®—Cells for use in high temperature applications. Capable of recharge at rates up to C/3 and continuous use (discharge, charge, and overcharge) in temperatures up to 70°C. |
| GXH | GEMAX Goldtop—Products possessing the high-performance of the GEMAX family, but capable of use in environments up to 70°C. |
| GHC | Goldtop Plus—Cells that offer extended life at high temperature while providing high-temperature charge acceptance and capacity delivery. |
| GM | MP2 Memory Preservation Goldtop Cells—Cells designed for applications such as computer memory backup where extended hightemperature life and survival under loaded storage are significant benefits. |
Table A-1 provides a quick summary of the performance features of the various cell classes.

ORGANIZATION OF THE APPENDIX
The remainder of the appendix is organized as follows:
Table A-1 Product Selection Guide
A general review of the different classes of cells that are available from Gates to meet special operating requirements.
Figure A-1 Cell Capacity Selector Guide

A nomogram which allows quick preliminary assessment of the cell size that will best satisfy a specific uniform drain rate and discharge time requirement.
TYPICAL DISCHARGE PERFORMANCE CURVES
These curves provide voltage profiles for room-temperature discharges at representative drain rates. A family of curves is provided for each class of cells:
| Figure A-2 | Discharge Performance for VALUMAX™ (G Series) Cells |
| Figure A-3 | Discharge Performance for VALUMAX Fast Charge (GF Series) Cells |
| Figure A-4 | Discharge Performance for ULTRAMAX™ (GL Series) Cells |
| Figure A-5 | Discharge Performance for ULTRAMAX Fast Charge Cells |
| Figure A-6 | Discharge Performance for GEMAX™ (GX Series) Cells |
| Figure A-7 | Discharge Performance for Goldtop® (GH Series) Cells |
| Figure A-8 | Discharge Performance for MP2 Memory Preservation Goldtop (GM) Cells |
SCALING THE DISCHARGE CURVE
The process of developing a discharge curve for a specific application was described in Section 3.1.4. This involves adjusting the rated capacity by application of derating factors based on discharge conditions to obtain actual capacity. The derating curves for capacity are provided here:
| Figure A-9 | Effect of Cell Charge Temperature on Actual Capacity |
| Figure A-10 | Effect of Cell Discharge Temperature on Actual Capacity |
| Figure A-11 | Effect of Discharge Rate on Actual Capacity |
Section 3.1.4 also describes the process for estimating the midpoint voltage for the discharge by derating it based on cell temperature effects on cell resistance and midpoint voltage. The curves necessary to obtain these derating factors are:
| Figure A-12 | Effect of Cell Discharge Temperature on Resistance |
| Figure A-13 | Effect of Cell Discharge Temperature on Midpoint Voltage |
Once the actual capacity and the midpoint voltage have been calculated, the standard discharge curve for the specific discharge conditions may be generated using the curve shape of:
| Figure A-14 | Sealed Nickel-Cadmium Cell Universal Discharge Curve |
OTHER CELL PERFORMANCE DATA
In addition to the discharge information discussed above, there are a variety of additional curves that are useful in designing with sealed nickel-cadmium cells. Two particularly important general curves are:
| Figure A-15 | Cell Voltage vs. Overcharge Current (Tafel Curve) |
| Figure A-16 | Retained Capacity |
Useful charge acceptance characteristics are provided by:
| Figure A-17 | Effect of Temperature on Charge Acceptance |
| Figure A-18 | Effect of Charge Rate on Charge Acceptance |
| Figure A-19 | Effect of Temperature on Capacity |
| Figure A-20 | Time to Return Capacity at Different Temperatures |
Cell response characteristics, specifically the behavior of voltage, temperature, and pressure as the cell charges, are useful in designing charging schemes:
| Figure A-21 | Charge Response Profiles |
Use of Selector Guide

Figure A-2 Discharge Performance for VALUMAX™ (G Series) Cells (Reference: Section 3.1.3 of text)
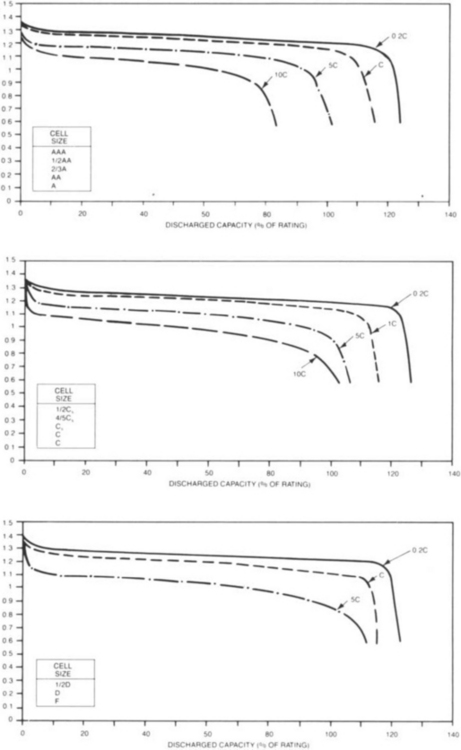
Figure A-3 Discharge Performance for VALUMAX Fast Charge (GF Series) Cells (Reference: Section 3.1.3 of text)

Figure A-4 Discharge Performance for ULTRAMAX™ (GL Series) Cells (Reference: Section 3.1.3 of text)

Figure A-5 Discharge Performance for ULTRAMAX Fast Charge (GLF Series) Cells (Reference: Section 3.1.3 of text)
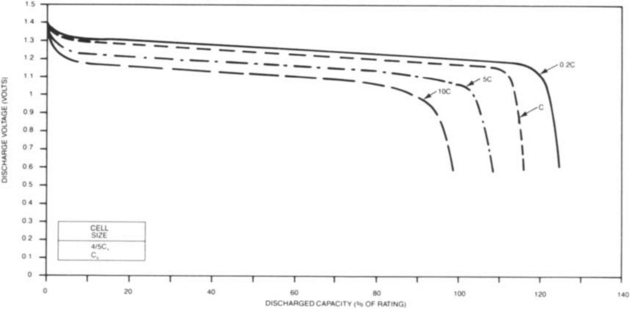
Figure A-6 Discharge Performance for GEMAX™ (GX Series) and GEMAX Fast Charge (GXF Series) Cells (Reference: Section 3.1.3 of text)
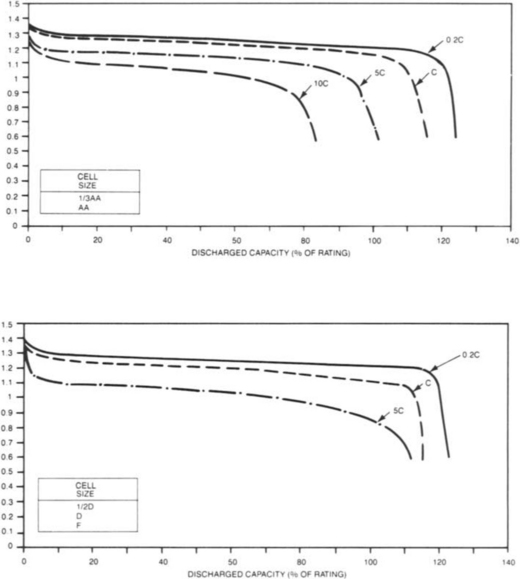
Figure A-7 Discharge Performance for Goldtop® (GH Series) Cells (Reference: Section 3.1.3 of text)
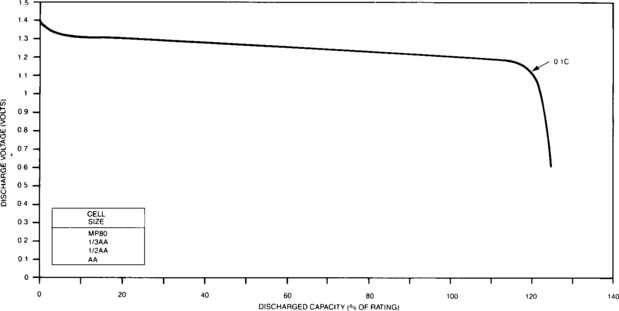
Figure A-8 Discharge Performance for MP2 Memory Preservation (GM) Cells (Reference: Section 3.1.3 of text)

Figure A-9 Effect of Cell Charge Temperature on Actual Capacity (Reference: Section 3.2.2.1 of text)
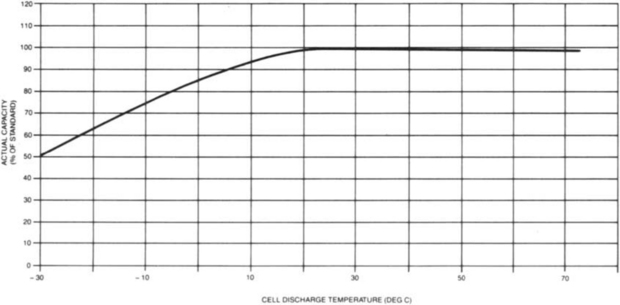
Figure A-10 Effect of Cell Discharge Temperature on Actual Capacity (Reference: Section 3.1.3.3.3 of text)
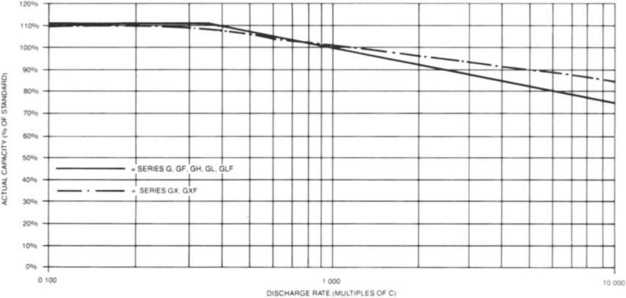
Figure A-11 Effect of Discharge Rate on Actual Capacity (Reference: Section 3.1.3.3.3 of text)

Figure A-12 Effect of Cell Discharge Temperature on Resistance (Reference: Section 3.1.2.3.1 of text)
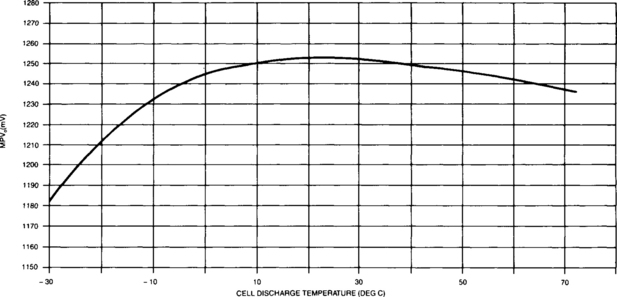
Figure A-13 Effect of Cell Discharge Temperature on Midpoint Voltage (Reference: Section 3.1.2.4.1 of text)
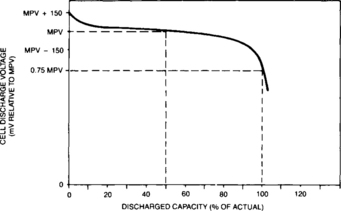
Figure A-14 Sealed Nickel-Cadmium Cell Universal Discharge Curve (Reference: Section 3.1.4 of text)
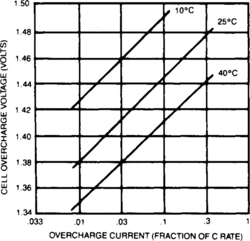
Figure A-15 Cell Voltage vs. Overcharge Current (Tafel Curve) (Reference: Section 3.2.4.1 of text)

Figure A-16 Retained Capacity (Reference: Section 3.1.3.4 of text)

Figure A-17 Effect of Temperature on Charge Acceptance (Reference: Section 3.2.2.1 of text)

Figure A-18 Effect of Charge Rate of Charge Acceptance (Reference: Section 3.2.2.2 of text)

Figure A-19 Effect of Temperature on Capacity (Reference: Section 3.2.2.1 of text)

Figure A-20 Time to Return Capacity at Different Temperatures (Reference: Section 3.2.2.1 of text)

Figure A-21 Charge Response Profiles (Reference: Section 3.2.3 of text)
1. Locate the room-temperature discharge current for your application on horizontal axis.
2. Choose the desired run time on the vertical axis.
3. The intersection of the run time and the discharge current defines the necessary capacity. The required capacity is indicated by the nearest diagonal line that is above and to the right of this intersection. This line is identified by the model number which provides a reference for the cell specifications.
4. Any cell that is above or to the right of the intersection will meet the cell discharge requirement at room temperature. If the application requires a cell with special characteristics such as operation at high temperature, refer to the cell specification.
Example: The application requires a discharge current of 300 mA for 5 hours.
Solution: The run time and discharge current intersect on the capacity line marked “G-1500CS.” This model number indicates a Cs diameter cell from Gates standard product line would meet the minimum capacity required for this application. Other cell options are indicated on the chart (anything above and to the right).
Note: This chart uses nominal room-temperature parameters. Careful attention must be paid to various derating factors such as charge temperature, discharge temperature, etc. which may cause the cell to deliver less capacity. If this occurs, a larger cell may be required. The derating parameters indicated in Figures A-9 through A-11 may be useful in assessing this effect. Consult Gates Energy Products for additional assistance in determining the appropriate cell size and design for specific applications.