
Relationship marketing: integrating |
INTRODUCTION
Marketing is concerned with the exchange relationship between the organisation and its customers and, as we briefly discussed in Chapter 1, quality and customer service are key linkages in this relationship. The sub-title of the first edition of this book was Bringing quality, customer service and marketing together. But, ten years on – and with notable exceptions – many companies are still struggling to co-ordinate and control quality and service activities.
This chapter deals with the need for continuous collaboration in the firm and with marketing's role in aligning quality, customer service and marketing activity into a single market-oriented purpose. In other words, we argue that companies should adopt a relationship marketing approach towards aligning market intelligence into internal processes and the resources these processes need to function effectively.
Companies can no longer chart a path to the future based on marketing's traditional understanding of customers’ needs, and on meeting those needs by controlling a limited range of critical activities that are marketing's direct responsibility. This traditional model assumed that if all key decision-makers within the firm played their part, this would lead to cross-functional co-ordination.
To be fair, cross-functional decisions are far from simple. Marketing operates in a complex multifaceted domain where it competes with legitimate demands from other areas of the business. Because marketing can not control everything, marketing resources tend to be allocated to those activities that it can control, while decisions may be taken in other areas of the business that affect marketing too. This makes it very difficult for the marketing department to translate its marketing strategy into effective action.
Paradoxically, many companies lost their deeply-shared knowledge of quality management techniques after ISO quality assurance became an entry requirement for business in the 1990s. Quality management is concerned with continuously improving quality, whereas quality assurance is essentially a quality audit that does not require continuous improvement. Everyone in the company needs to understand that customer service is the sum of all interactive contacts that create perceived customer value, or any improvements in relationship development will be compromised by the cost of lost customers.
Marketing's neglect of quality and customer service
Companies may usefully base some of their customer-acquisition strategies, such as allocating resources for buyer behaviour research, media communications, promotions, packaging and so on, on the traditional 4Ps of marketing – product, price, promotion and place – that we discussed in Chapter 1. But strategies for keeping customers involve delivering value that is largely outside the traditional scope of marketing resources decisions. This presents a critical intellectual and political challenge, because the quality of the external relationships a company forges largely depends on the quality of relationships within its internal environment.
The traditional marketing process of matching an organisation's external and internal environments and developing and protecting customer relationships largely neglects quality improvement and customer service activities. Moreover, as we outlined in Chapter 3, important exchange relationships extend beyond the customer domain to include other external constituents, including suppliers, new employees and sources of influence and referral, such as government agencies, loyal customers and so on. In other words, we need to recognise a complex pattern of dynamic relationships between the internal – or employee – market and a wider range of external markets.
In Chapter 1 we introduced the principle of aligning customer service, quality and marketing. If we accept that marketing has to extend its activities beyond the 4Ps orientation into the critical domains of customer service and quality management, the challenge becomes how to align these activities more closely with marketing (see Figure 5.1). This figure shows the integration between marketing, customer service and quality that companies must explore to achieve total customer satisfaction and long-term relationships. In the past organisations have treated these three areas as separate and unrelated.
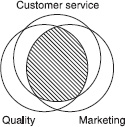
FIGURE 5.1 Integrating quality, customer service and marketing
At its simplest, customer service can be defined as:
![]() The ongoing process of managing the buyer/seller interface to ensure continued customer satisfaction.
The ongoing process of managing the buyer/seller interface to ensure continued customer satisfaction.
Customer satisfaction is critical in maintaining relationships, which is why we emphasise it so strongly in this book.
Customer service is often seen as ‘customer care’, but this is a limited and partial perspective. As well as technical outcomes there are interactive aspects to the service experience that contribute to customers’ perceptions of the service quality and to their satisfaction. Many companies that have invested in ‘service excellence’ programmes have failed to see a real return on their investment because they did not make the necessary changes to the processes that affect the customer.
Customer service is not a departmental responsibility.
Customer service is not a departmental responsibility. The ways in which service is delivered and maintained cut across functional boundaries and require a deep understanding of what drives customer satisfaction.
Because customer requirements and characteristics differ, a company's service processes must be flexible enough to allow a degree of tailoring. They must also be interactive so that the business can respond quickly to changing customer requirements.
Marketers often ignore the ‘part-time marketers’, working at the boundaries, whose job is to provide service to customers.1 These front-line service people need appropriate skills and reliable operational back-up. This means companies need to align their internal processes with external customer requirements. They cannot just rely on good market information. Cursory investigations of firms’ critical service processes usually reveal that many have no clear ownership patterns. In other words, a so-called ‘end to end’ process is often disrupted at departmental borders. A business may need a ‘process alliance’ manager to collaborate across functional borders and improve the process by redesigning it, managing it continuously as a complete cycle of activity. Without marketing input and pan-company collaboration in identifying the critical processes, customer service is unlikely to result in continued customer satisfaction.
The role of quality
Quality as a management concept is concerned with matching a company's offer to customers’ requirements and expectations. Effective quality management requires quality thinking and know-how to be aligned across all departments. This quality approach needs to extend beyond the organisation to embrace the total relationship the firm has with its customers and suppliers on a continuous basis.
The traditional production concept of ‘conformance to specifications’ (sometimes referred to as ‘internal quality’) has been superseded by concepts of quality defined by customers – or ‘customer perceived quality’. But because the manufacturing and operations functions have largely led the advances in quality management thinking and practice, the emphasis is on systems and processes, performance reliability and continuous improvement.
The gurus of quality – Deming,2 Imai,3 Juran4 and Oakland5 – certainly came from production and operations disciplines. But without collaborative marketing involvement, quality will never achieve its goals and will fall short of customer defined requirements.
Best practice in quality management has moved from relying on final inspection of products to assessing whether critical internal processes are well controlled and capable of matching customers’ requirements and expectations. In manufacturing industries, for example, the emphasis has changed from inspecting production outputs to monitoring the variation in routine work activities and making adjustments in real time while goods are still being processed. This new approach allows companies to reduce drastically the variation in output quality and to eliminate waste, leading to more reliable products for customers. Also, by examining just how the various processes link together, firms can reduce cycle time (a factor that is often overlooked in service industries) by improving their overall responsiveness to customer requirements, which again cuts out waste.
Quality management has spread across all industries as a reasoned and disciplined approach to continuously improving work processes, and across all functions within companies as a way of meeting customer requirements at ‘least cost’. But quality assurance (ISO accreditation) alone does not guarantee that customers receive quality. Quality may take a variety of forms, depending on individual customers’ perceptions and depending on the time. It is clearly marketing's responsibility to monitor and interpret customers’ perceptions of quality, but the marketing discipline has tended to sweep the concept of company-wide collaboration in quality management under the carpet.
The problem is that while the overarching goal of quality management is to meet customer requirements consistently, this is only tenuously linked to customer expectations and the changing dynamics of value exchange. As Gummesson has pointed out, quality has helped to integrate production and marketing orientations.6 But marketing practitioners and academics have been largely reluctant to recognise the quality movement's achievements in helping to implement marketing concepts. In many organisations, marketers still see quality as primarily the responsibility of manufacturing or engineering, and in such firms marketing managers are neither involved in quality, nor provide it with rigorous market research.
Where effort is duplicated and misaligned, marketing management is seen as saying one thing while apparently doing another. Staff may well read such ‘mixed messages’ as evidence that the organisation has no central guiding strategies, when this may be far from the truth. Organisational defensive routines thrive in such conditions and may seriously block communications.
Bringing marketing, customer service and quality together
Organisations can no longer confine quality management, customer service and marketing inputs to creating and delivering customer value, to discrete departments such as marketing, manufacturing, logistics or complaint handling. Clearly, the customer's experience is the result of cross-functional processes. For example, customers often regard call centre operations as creating ‘distance’ rather than ‘intimacy’ because of their call-waiting messages and their prescriptive range of solutions to a multi-dimensional range of customer service issues and complaints. Companies need to view marketing, customer service and quality inputs as the customer sees them – as part of a seamless offering. This does not mean that we need a marketing ‘takeover’ to put things right – indeed, that might create just another singularly sub-optimal solution. But it does mean that pan-company collaboration and dialogue is essential, so that the organisation can consider and integrate the inputs from different specialist functions. This is the only way to improve customer service and quality, and it represents an opportunity to develop internal (employee) relationships within the organisation.
Customer service plays a critical connecting role in the pre-sale, sale and post-sale interactive phases of value exchanges. If the ‘sale’ is seen as the outcome of the interaction, customer service is the relationship development part. Businesses that shift the marketing emphasis towards relationships may find that, in the course of customer service interactions, there emerge opportunities for working together with customers to ‘co-create’ value. In other words, the supplier and the customer can create unique value, either through mutually improved benefits or reduced costs.
Traditionally, the literature on customer service is only concerned with the interaction between suppliers and their customers. But customer service plays a role in all the relationship markets we talked about in Chapter 3. Members of alliance/supply markets, referral markets, internal markets, recruitment markets and influence markets all represent opportunities for the business to interactively co-create value. We shall return to the potential for co-creating value in Chapter 6.
Relationship marketing involves creating bonds with members in different markets through exchanging value, where the quality of what is exchanged and the service that delivers it conform to – or even exceed – what has been promised. Quality is both the act of differentiating the offering and the way the receiver evaluates it. Quality is the receiver's perception of the offering's uniqueness and value. It is also the means by which the firm sustains its position over time among competing offerings. This notion of total quality, achieved through service, reliability and continuous improvement, reconciles marketing promises and perceived performance. Traditionally, marketing has focused on customer acquisition. Retaining customers involves delivering value through fulfilling promises. Efforts within the firm to integrate quality, customer service and marketing competencies should aim to keep valuable customers as well as win them.
The concept of interaction is essential in relationship marketing in the sense that value is created and shared through interaction. Interaction starts with any action that generates a response. This may sound simple, but it provides the basis from which to examine the value delivery process that brings quality, customer service and marketing together.
Services marketers are familiar with guiding, influencing and designing the context and nature of regular customer interactions to achieve superior quality control and enhance value for the customer. For example, interaction is the basis for the so-called ‘moments of truth’ between customers and suppliers, for the role of customers as co-producers of services, for the role of a firm's customer service people, and, most importantly, for the way all these connect with the firm's internal support systems.7
In services industries customer value is created, delivered and consumed simultaneously, provided it is backed up with adequate internal service support. As a consequence, in service companies the value creation process partly parallels the value delivery process. In manufacturing and distribution, on the other hand, one follows the other, end to end. Of course, the delivery process may be a composite of many processes, as in the case of multiple distribution channels.
Every firm is potentially a service firm
Every firm is potentially a ‘service’ firm.
Every firm is potentially a ‘service’ firm. Many manufacturers now consider service to be the dominant part of their competitive advantage. Every company, through a mix of functional utility, service, support of various kinds, information and advice, and ongoing ‘services’, can now design and manage its own unique set of solutions to meet customer requirements. Dell Computer, for example, assembles the computer in ‘quick response’ soon after the customer orders it. This kind of service capability is reshaping the market for computers.
To take the shift to a service emphasis one step further, consider the emerging ‘service experience’ industry. We can understand Disneyland in traditional terms, but interactive TV may open up unexpected service-driven pathways. Also, as the Internet continues to develop it will certainly open up new and more interactive ways of keeping in contact with customers. Businesses therefore need to take a flexible approach to potential new marketing opportunities.
The traditional image of ‘service’ is that it is ‘performed’ by individuals. But this is a limiting perspective. Do bank automatic telling machines deliver a product or a service? In the world of fast foods, is the ‘McDonald's experience’ a product or a service? And does it matter? All classifications are partially flawed because what is meant by ‘service’ depends on time, tangibility and tasks. For example, production is a time-based work activity that builds up an accumulation of value that we traditionally call a ‘product’. These values are either consumed more or less immediately, or, if not, amortised by the customer over the lifetime of the product. Where the customer amortises the value, what they get or hope to get from the product is ‘serviceability’. Service in this sense occurs after the point of sale. So rigid distinctions drawn between ‘products’ and ‘services’ are somewhat arbitrary.
But we can bypass these distinctions by orientating relationship marketing around the customer, because then our prime concern is the ongoing relationship in which products and services are fused.
The customer value chain and the customer activity cycle
The customer value chain8 is an intellectual framework for thinking through what a customer actually does with a product or service. In other words, the supplier's offering is the input into the customer value chain, while the links in the chain represent customers’ activity patterns. These links control or modify the way the customer uses the supplier's output. Putting this into a services context, a bank account may serve a variety of functions. It might be a device to pay bills, an investment for a ‘rainy day’ or a day-to-day savings account, according to how particular customers manage their money and what their priorities are. Marketing needs to identify what the customer is trying to do with the firm's service offering before it reaches any conclusions about how to improve it.9 It would be even better for the firm to match its offer with customers’ goals and aspirations, which would mean determining what the customer is trying to achieve.
The sustainable value a supplier can create for a customer reflects how closely it can align its own value chain with the customer's value chain. The way a firm interacts with its customers and suppliers and how it co-ordinates the value delivery activities within its own value chain are critical (see Figure 5.2).
A company could use the ‘customer activity cycle’ framework proposed by Vandermerwe to make its customer's value chain more explicit.10 The customer activity cycle divides customers’ activities into three overlapping phases: pre-purchase, purchase and post-purchase. Companies can then use the framework to identify the sequential activities of the customer – providing they have a profound understanding of the nature of customers and the differences between customer segments.
Managers should then try to understand, through research and observation, each critical activity point in the cycle and map these in a circular process diagram. Customer activity cycles can be designed for either a company or an individual, so they are appropriate in both b2b and b2c markets. Companies’ objective in doing this analysis should be to understand the activity cycle of key existing and potential customer segments so that they can identify points in that cycle where there is most opportunity to create additional value for the customer or reduce their costs.
Managers should challenge internal organisational activities that do not add value or reduce costs for customers. In other words, internal customers and internal suppliers create and deliver value, as do external customers and suppliers. Making these internal links and ties more transparent makes it easier to review and manage them. This is the starting point for exercising some customer-oriented design control over the value delivery sequence.
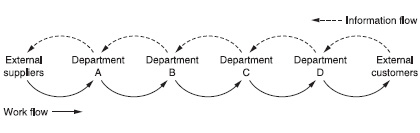
FIGURE 5.2 Alignment of value delivery activities
Cross-functional work flows
If organisations do not manage work flows and processes laterally across their own value chain, costs will mount and quality will fall all along the various strands of the chain, from each internal supplier to the next internal customer, through to the end customer. When one department's output does not match another department's input needs, there will be an internal quality gap.
Quality problems tend to arise between departments rather than within them.
Internal quality problems tend to arise between departments rather than within them. Businesses that over-manage and over-control various job roles within functions find, paradoxically, that they reduce the potential value-adding effect of exchanges between divisions. In other words, optimising parts of the chain, without regard for the whole chain of effects, results in sub-optimising the whole value delivery sequence. As such, companies will find themselves saddled with the extra cost of all these mismatched internal activities, including the cost of delays and ‘fire fighting’, on top of the cost of achieving value for external customers (see Figure 5.3).
Managers need to be alert to these critical cross-functional organisational linkages and attempt (collaboratively) to remove any blockages, if they are to reduce the cost of achieving customer perceived value. One way of addressing these issues is to look at the internal variables of job design (who does what), environmental setting (where it is done), and process flow (how it is done), as well as dealing with any people issues. We go on to discuss how companies can improve these four key variables towards the end of this chapter.
De Bono11 has used the phrase ‘designing a way forward from a field of parallel possibilities’ to describe an approach to seeking solutions to problems that require new thinking. Businesses could apply this idea to recognising any barriers to cross-functional work flow that relate to the four variables mentioned above, understanding that there is no one solution nor ideal pattern, but many. In this way they could control delivery costs but not at the expense of customer value.
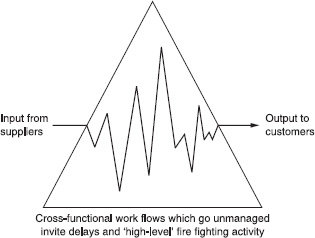
FIGURE 5.3 Cross-functional quality mismatch
Redesigning internal processes, even with the help of excellent market information about customer wants and expectations, continues to challenge many companies. It is easy to lose the customer ‘voice’ and make a final offering that falls short of customer requirements.
How do you begin to redesign internal processes? Every work activity is part of a process and every process links to other processes through a series of inputs and outputs. One possible starting point is to take an area that market research or customer complaints has identified as a critical customer concern, and then trace a sequence of connected activities ‘upstream’ back to their original sources of input. Some of these processes may appear to be totally unco-ordinated and uncontrolled, or appear to be outside the control of the firm, or to belong to a particular department or division within it. That is all the more reason to include them in any examination.
The rationale for this kind of investigation is that all work activities eventually connect ‘downstream’ through the value chain to the end customer. It is important to determine whether these activities are adding value to the customer, or merely adding cost to the company, and any investigation of the value delivery process needs to differentiate between the two. Companies should begin by using a technique called ‘flow-charting’ or blueprinting’. They might also use another diagnostic tool – the so-called ‘fishbone’, also called an ‘Ishikawa diagram’ after its Japanese inventor Dr Kaoru Ishikawa – to explore opportunities to improve quality. We will describe these quality management tools later in this chapter.
Redesigning service support systems
Logistics are normally associated with the movement of physical materials and products. But logistics are equally important value-delivering mechanisms in a service context. For example, they are crucial to the way support systems for financial services, call centres, Internet interfaces or hotel checkout procedures are designed.
When designing or redesigning service support systems the objective is to achieve a cost-effective yet consistent output that meets customer requirements. But organisations will only achieve that objective by looking in detail at each stage of the value delivery process, and at the interfaces between those stages.
Organisations whose service support systems are haphazard and poorly managed are likely to experience a high level of service failures. One reason for this loss of quality is that no one person in the chain is responsible for its overall performance – indeed managers are rarely aware of the total chain of cause and effect. Also, in loosely co-ordinated support systems, output tends to be very inconsistent. For the benefit of the mathematically inclined, if a service support system has ten stages and if a failure or mistake occurs at each stage on one in a hundred occasions, then 11 per cent of the final output will be affected [that is, 1 – (1 – 0.01)10]. Also, a business may find that errors in, say, the order-entry stage, which may appear insignificant, can trigger errors in the accounts department or other areas. A major challenge for most companies is to overcome the fragmented nature of their service support systems in order to ensure a consistent quality output.
It is no coincidence that the companies most frequently cited as service leaders – McDonald's, Disney and Dell Computer, for example – pay careful attention to the way they design and manage their delivery systems and have installed integrated processes and procedures to ensure consistent outputs.
Flow-charting the service support system
An organisation could start the process of designing and improving its service support system by diagnostically analysing it with quality tools and then modelling it to improve operating performance – in much the same way that manufacturing systems can be diagnostically analysed and modelled.
A flow chart provides the basic starting point. A flow chart essentially analyses the systems of any end-to-end work process and maps out the linked activities. Shostack12 first introduced the technique into the marketing literature and called it ‘service blueprinting’. But we will use the more generic term ‘flow-charting’, as it seems better to describe what is involved. The essential steps are as follows:
![]() First, record all the links and steps in the process sequence so that you can clearly and objectively see the end-to-end connections.
First, record all the links and steps in the process sequence so that you can clearly and objectively see the end-to-end connections.
![]() Next, identify the ‘fail points’ – that is, any areas that seem likely to fail or are unreliable. At first this is a matter of intuition and judgement, but you often discover data to support your hunches – once you know where to look for it.
Next, identify the ‘fail points’ – that is, any areas that seem likely to fail or are unreliable. At first this is a matter of intuition and judgement, but you often discover data to support your hunches – once you know where to look for it.
![]() Then set ‘execution standards’ or target values for service performance at critical points in the process. These execution standards need to allow for some performance tolerances. Higher standards and target values usually imply higher service costs, but the whole point of the flow-charting exercise is both to improve service quality and to reduce costs.
Then set ‘execution standards’ or target values for service performance at critical points in the process. These execution standards need to allow for some performance tolerances. Higher standards and target values usually imply higher service costs, but the whole point of the flow-charting exercise is both to improve service quality and to reduce costs.
![]() Finally, identify where and when in the process tangible evidence of the service becomes available or is offered to the customer. These are the ‘encounter points’ in the process – that is, the points where customers and suppliers interact. We examine these encounter points in more detail later in the chapter.
Finally, identify where and when in the process tangible evidence of the service becomes available or is offered to the customer. These are the ‘encounter points’ in the process – that is, the points where customers and suppliers interact. We examine these encounter points in more detail later in the chapter.
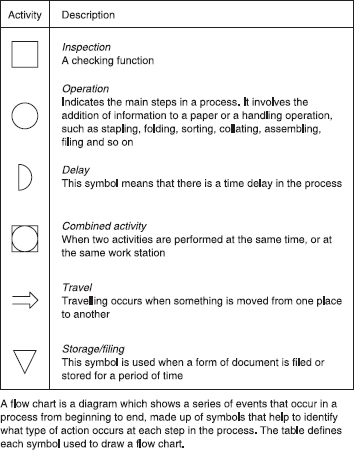
Building up a flow chart requires a basic tool kit that uses a set of symbols for describing key steps in any work process (see Figure 5.4). The flow chart is a picture of the interaction between people, materials, equipment, information, methods and environment within a particular process that connects to some customer encounter point.
Mapping out these interactions reveals areas in any of the process linkages where time and resources are being wasted. Once the links are committed to paper in this way it often becomes obvious how various activities can be simplified, and the supplier and customer's time and resources saved.
An example (see Figures 5.5 and 5.6) shows the ‘before’ and ‘after’ flow-charting of a process for giving cash advances on credit cards at a retail bank. In the ‘before’ example, bank tellers had to choose one of five procedures according to the type of card and the amount of cash they were allowed to hand out in any one transaction. Cash advances outside the teller's discretion needed to be authorised over the telephone by the credit card service centre. Flow-charting this process showed immediately just how complex it was and why tellers had such difficulty in ‘carrying out laid-down procedures’. The procedures were inherently prone to mistakes. More important, the bank had to pay a service fee for the authorisation call to the credit card centre. Furthermore, delays for authorisation were common, which increased the call time, reduced the teller's ability to deal with the transaction efficiently and caused queues to build up in the bank.
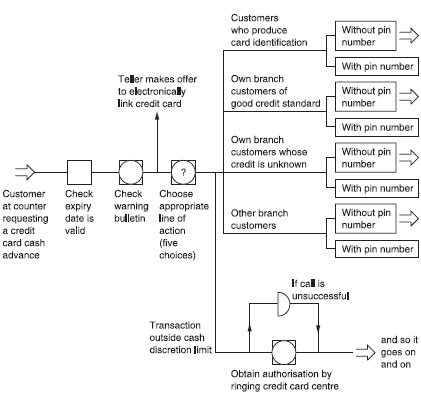
FIGURE 5.5 Credit card cash withdrawals – before
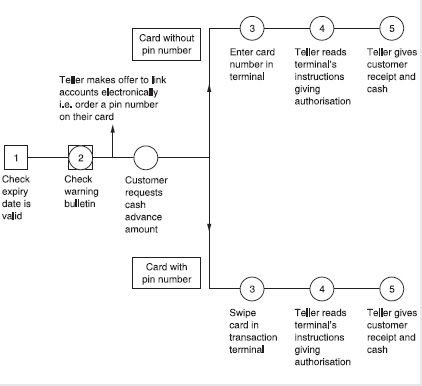
Once the company had signalled the problem of connecting with the credit card centre to its data processing department, the solution proved to be quite simple. A short programme rewrite enabled the tellers’ electronic terminals to be connected online to the credit card customer database. The teller could then obtain authorisation at their workstation without incurring costly phone calls or delays. The department won approval to make the changes quickly because the flow chart highlighted the problem and the solution far more vividly than a departmental report would have done. The bank saved almost £1 million in call costs in the first year – not to mention the time savings and flow-on efficiencies.
The details of this case vignette may seem unreal. Surely the need for an electronic link was obvious? But the need was not obvious because the service support sequence crossed over many departmental borders, and so people within those individual departments thought their own procedures were logical. Clearly, the whole sequence was less effective than the sum of the parts. Only when the company charted cross-functional work flow for the first time did it make the broader connection between the customers’ waiting time, the tellers’ wasted time and the hidden costs ‘upstream’.
Flow-charting can be even more effective if it includes time data. This data might show, for example, how long each stage in a process takes, how long a customer has to wait (dead time), how long they spend participating (active time) or how long they spend ‘non-participating’ (unused capacity). Research and development teams and manufacturing management have used flow design and control methods for years. But these tools often lack market intelligence on customers’ experience at the service encounter point, and this is where marketing's input is critical.
Service quality diagnostics – the fishbone diagram
The impact of quality management in manufacturing industry is well documented. But, as we argued earlier in this chapter, the concept of quality goes far beyond the product itself to embrace the entire relationship between the organisation and its suppliers and customers. Many of the concepts and techniques of quality management that work in the factory can also dramatically improve the quality of the service delivery system.
Diagnosing a firm's critical service issues is best done by the people involved in the work processes being reviewed. So a first step might be to organise a series of task forces that cut across departmental lines and include people involved in the ‘lines of flow’ reflected in the service flow charts.
The fishbone diagram is another diagnostic tool that companies can use to improve service delivery systems. The fishbone is a way of structuring a particular work process by representing all the probable cause-and-effect relationships in a simple but non-linear diagram. The ‘effect’ is really the problem in the process being studied and is represented by the forward end of the central backbone of the ‘fish’. The various fish bones are used as a way of structuring thoughts about the causes of the problem and each main ‘bone’ represents a particular category of probable causes.
Once people realise the diagnostic potential of the fishbone diagram they begin looking at the causal elements in greater detail and finding probable subsidiary factors that need to be investigated. These are written in as ‘tiny bones’ connected to main causal elements. The example given in Figure 5.7 shows how a fishbone diagram can be used to diagnose the cause of flight departure delays at an airport.
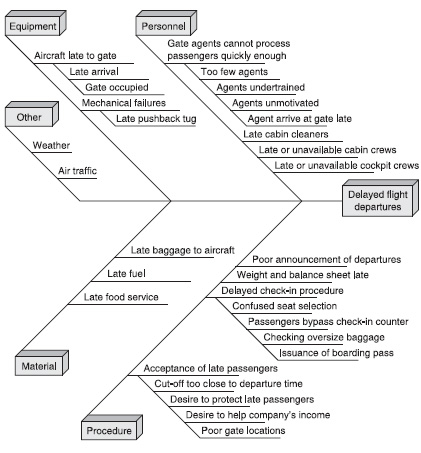
FIGURE 5.7 Causes of flight departure delays
Source: Reprinted by permission of Elsevier Science from ‘New Tools for Achieving Service Quality’, by Wyckoff, D., The Cornell Hotel and Restaurant Administration Quarterly, November, 78–91, Copyright 1984 by Cornell University.13
Once a firm has mapped out a particular problem in this way (and we emphasise again that this is an intuitive and creative approach), it can investigate any particular factor that seems promising.
The next stage involves shifting the emphasis from analysing problems to generating solutions. This time, the company enters the most likely solution at the head of the fishbone as the ‘effect’ being studied. Then the ‘what if’ dialogue begins again until the ‘bones’ of the diagram become a set of categorised factors which potentially represent part of the solution. But the cause-and-effect relationships identified on the fishbone diagram are only hypothetical, and companies should conduct follow-up research to back up their hunches. There are as many uses for the fishbone in marketing applications as there are on the factory floor.
The relationship marketing benefit of using such quality management tools is their collaborative approach to improving service support systems and the wider range of value delivery sequences. It is through using common methods like these, adapted to suit specific organisational needs, that employees learn to speak a common language and cross-functional quality barriers start to fall away.
Service quality management
Service tends to be produced and consumed at the same time and place.
We will now set out some conceptual approaches and practical guidelines that companies can adopt to monitor and manage their quality performance. As we indicated earlier in the chapter, one challenge peculiar to service offerings is that service tends to be produced and consumed at the same time and place –that is, within the service interaction. As in theatre,14 each service performance unfolds as it goes along. There will be a common script, various actors and behind-the-scenes people. The audience (like customers) must play their role otherwise there will be no theatre, and they will sometimes be called upon to participate directly, to become part of the act and its outcomes.
Grönroos has developed a service quality model7 where interactive real-time service encounters between buyers and sellers generate for customers what he calls ‘functional’ (or process) quality – that is, the quality of their interactive experience with the supplier. What remains after an interaction sequence is what Grönroos terms ‘technical’ (or outcome) quality. This model highlights the importance of service quality in relationship marketing. The aim is to sustain relationships with valuable customers, not only by delivering on promises made during the sale, but by focusing on the quality of the customer's interactive experience with the supplier before and after the sale.
Mapping ‘moments of truth’
The ‘encounters’ between buyers and suppliers are sometimes described as ‘critical incidents’ or ‘moments of truth’.15 Moments of truth, of course, might turn out to be potential ‘fail points’ for the supplier if things go wrong. But identifying and managing the encounter points is critical if businesses are going to achieve consistent service quality.
Each encounter point is an opportunity for the service provider to demonstrate the quality of its service – be that good or bad. It is also an opportunity to listen to what the customer is trying to do and gauge what is needed. Some airlines have successfully used this approach. Confident in the quality of their service, some have even sought to increase the number of moments of truth in any service interaction in the belief that this would enhance the customers’ overall perception of their service quality. But simply increasing the number of encounter points is a futile exercise. If those extra service interactions do not offer the customer perceived value, they are a waste of time and resources. The sparse but competitive in-flight service offered by low-cost airlines such as easyJet and Southwest Airlines suggests that, while customer requirements come first, there are value segments of customers who will require and respond to different offerings.
Using the customer activity cycle framework that we referred to earlier in this chapter, companies need to identify the most common points of contact between themselves and their customers during the pre-sale, sale, and post-sale cycles of service. They can then use these to explore opportunities to improve the customer experience.
Mapping out the encounter points or ‘moments of truth’ within the various episodes of a typical customer interaction cycle may reveal defects in the way the sequence is organised and which of the encounter points are critical, and why.
A suitable mapping framework (with encounter points to be filled in) is shown in Figure 5.8. Mapping out the cycles of service for key customers or value segments represents an opportunity to align effort between suppliers and their customers.16 The ‘right’ way is the way that best reflects what customers are trying to do with the firm's offer and how they value it.
In this sense it is the customer who sets the quality standard for performance – though we would normally refer to it as ‘meeting customer expectations’. So how customer expectations are dealt with becomes an important issue. That might seem obvious, but in relationship marketing any gaps between what is promised – either implicitly or explicitly – and what is delivered will undermine customers’ trust in the supplier, and this in turn affects the quality of the relationship and its future.
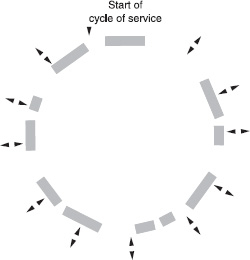
FIGURE 5.8 Mapping ‘moments of truth’ in the cycle of service
Monitoring and measuring service quality
We recommend that companies adopt a step-by-step customer feedback and monitoring system so that they can improve and adapt their value delivery process and service support systems in a customer-oriented fashion.
Customer satisfaction is a popular measure of service quality, but it is normally so broad that it is useless for anything other than decorative executive wall charts. This kind of measure will, at best, show how you are doing, but not why. Controversies abound as to the best measures of customer satisfaction and service quality,17 so we propose a pathway that will allow firms to avoid most of the problems most of the time.
To us, monitoring service quality means doing regular customer service tracking studies and identifying both emerging and critical service issues. This should be supported by staff attitude surveys (or employee ‘climate monitors’ as they are sometimes called), ‘risk point’ feedback systems and routine reviews of internal service quality performance standards. A broad range of monitors and measures like this will capture what customers value and in what context. For example, the package of service quality research monitors highlighted in Figure 5.9 would suit a branch-based service provider or a franchise operation.
Measuring is one thing but doing something about the results is another. Seldom can one person or department within an organisation uniquely ‘fix’ a particular service problem. Using interdepartmental review teams is the best way to deal with chronic problems. This means that each periodic cycle of research should prompt a review of the internal processes involved and any cross-functional bottlenecks that may be causing poor or variable performance.
Brief details of various kinds of service quality monitors follow:
1. Customer service tracking studies
Service measurement techniques must stay close to the customer's reality, and reflect their needs, wants, expectations and goals as closely as possible. The first task is to develop a list of service attributes or critical service issues. Customers know what they like but they might not always express it. Also, what is critically important may change over time. As a consequence, any list of service attributes should be regarded as provisional, a working hypothesis. It can always be revised and improved. Identifying what customers want should, of course, be done through dialogue with them. This dialogue can be informal or formal. The way a company might identify and review service attributes using qualitative research methods is set out in the box below.
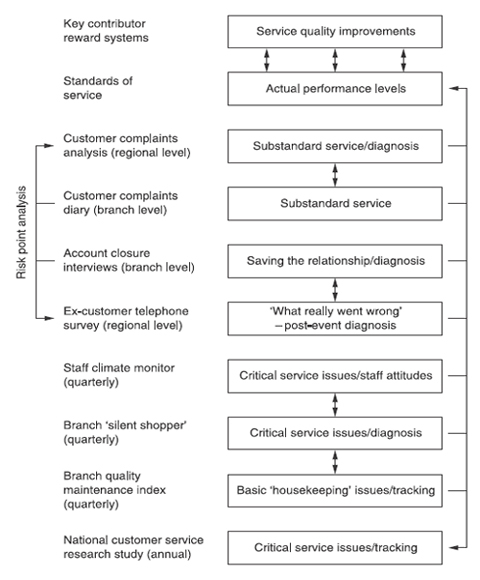
FIGURE 5.9 Monitoring service quality
Identifying the critical service issues
The first step in research of this type is to identify the influences on customers’ buying decisions, or, in the case of consumer markets, the common decision-making patterns within a particular value segment of consumers.
Once it has identified these basics, a company can initiate a small-scale qualitative research programme based on personal interviews with a representative sample of customers. The purpose of these interviews is to elicit, in the customers’ language, first, how important they rate service compared with other value elements such as price and product quality, and second, how important they rate individual components of customer service, and why. As a result, the company will be able to identify a number of specific customer service attributes, as we outlined in Chapter 2.
The company can then use this kind of qualitative data to develop internal quality benchmarks for internal standard setting, or they can use quantitative work (customer surveys) to measure the importance to the customer of various attributes as well as actual service performance. The key point here is that the attributes being measured in survey work must be relevant to customers, which means that they must be periodically checked and restated, again through qualitative research. Not all service attributes will be equally important to customers, or segments of customers. The relative importance of each attribute is likely to change over time, and sometimes quite suddenly should customers reorder their priorities. But companies should negotiate service standards individually with key customers, as generalised standards may not adequately reflect their requirements.
Wherever possible, depending on the size and scope of market opportunities, companies should routinely monitor the performance of their service attributes and measure them quantitatively using a survey questionnaire. Because customer requirements are a moving target, the company will need to conduct periodic surveys – hence the term ‘tracking studies’. We outlined a methodology for identifying the relative importance to customers of particular service attributes, and for monitoring the firm's performance on those attributes, in Chapter 2. An organisation can use exactly the same methods for customer service tracking studies, extending the survey, if that is practicable, to include the customers of one or more key competitors.
Many companies fail to recognise that frequently there are substantial differences between the importance that different customers accord to different service performance attributes. Consequently, they miss opportunities to identify segment needs and develop the kind of service segmentation strategies that we discussed in Chapter 2.
Companies often gain the most important insights from customers during dialogue at the qualitative research stage. Moreover, qualitative research enables firms to develop their own specific set of service attributes, customised by their own customers. No proprietary list of service quality attributes can be more relevant than a list of service attributes based on the specific requirements of a firm's own customers.
2. Service environment/branch quality maintenance index
Companies often take for granted the ambience and practical utility of the interface with customers – the store or branch environment, for instance. But this is an area where careful design and ‘good housekeeping’ is essential. A company should measure the specifics of its own service environment against a checklist of items, such as adequacy of outside parking, convenience of entry points, adequacy of lighting, functional layout, general cleanliness and so on. Some service providers conceptualise their interior ‘service-scape’ into a number of ‘service activity zones’ where the ambience or facilities differ from one service zone to the other. The physical service environment needs to be routinely assessed to establish whether it can support the firm's service objectives and whether it is being maintained in good order. The same audit principles apply equally to Internet based service-scapes, where the computer screen is a window to the service provider's virtual bookshop (as in the case of amazon.com), computer warehouse (dell.com) or whatever the case may be.
3. Silent shopper
The ‘silent shopper’ is a survey monitor that attempts to replicate the shopping experiences of the typical customer. Skilled market researchers act as surrogate customers and sample and report on their shopping experience. When they are also genuine customers of the firm, that makes their admittedly subjective reports more authentic. The purpose of this monitor is to diagnose what it feels like to be a customer and what service improvements the business might be overlooking.
4. Staff climate monitor
Measuring employees’ views of customer service and defects can be revealing, especially when there is a gap between their perceptions and customer perceptions of service quality. Companies can conduct an internal ‘climate’ study as a counterpoint to external customer service research. As well as canvassing staff views on customer service, the survey could also assess the impact of the firm's service philosophy on things like staff motivation, while at the same time discovering areas of more general concern.
5. ‘Risk point’ analysis
The firm can put in place various forms of analysis to monitor ‘risk points’ and ‘fail points’ in the way customer service is delivered. These analyses might include account closure follow-up, customer complaint analysis, customer exit interviews and so on, as we suggest in Figure 5.9.
Many organisations handle very carefully customers who complain, but some go even further, monitoring the key categories of complaints statistically and diagnosing the causes in order to take corrective action.
The ‘Pareto Law’, which we referred to in Chapter 2, can be helpful here. We usually find that around 80 per cent of complaints refer to a common 20 per cent of issues. Similarly 80 per cent of malfunctions or failures are due to 20 per cent of root causes. By monitoring systems and processes continuously companies can ensure they identify and manage these critical points.
6. Review of service standards
‘Production-oriented’ companies tend to set up internal service standards without the benefit of market research and market intelligence. This short cut is best avoided because it presumes that managers know what customers want, which is unlikely – unless they have asked them.
When a company obtains service performance feedback from a range of sources, as mentioned above, then it can use customer issues, such as ‘next day delivery’, to establish internal service standards that relate to key internal processes, like ‘order cycle time’. Every time it reviews the external service performance data, it can, if necessary, recalibrate internal quality targets (or metrics) in the light of actual market performance. It may also need to redefine service standards to take account of any new customer service issues.
Service quality gaps
So far as service quality is concerned ‘perceptions are reality’.
Service quality is a function of customer perceptions and the firm's resources and activities. It is normally defined as the match between what customers expect and what they experience (or perceived performance).18 Any mismatch between these two is a ‘quality gap’. In effect, quality is whatever the customer says it is. So far as service quality is concerned ‘perceptions are reality’. But past experiences and actual needs, word-of-mouth information, advertising and promotion all mediate the acceptability of the offering by influencing customer expectations.
There are two problem areas in service quality. First, you have to interpret ‘expectations’ as customers’ desired level of service, not what they expect will happen. Otherwise, the implication would be that when consumers expect bad service and receive it they would be happy with that, which is clearly absurd. Some companies, however, seem to operate this way. But it provides an unstable foundation on which to build relationships. Second, despite a certain level of desire, customers may be willing to accept less, as an ‘adequate’ level of service, either under all circumstances or at particular times, within a ‘zone of tolerance’ that lies between what they desire and what is adequate.19
The zone-of-tolerance concept leads to some necessary introspection about just how stable apparently loyal and committed relationships actually are. Because of past investments customers have made in the relationship – in terms of time, resource and so on – they may be willing to put up with minor and sometimes major irritations. The zone of tolerance acts as a buffer and all is well over time – except that their dissatisfaction may go unnoticed and unreported. What is more, customers can reach a threshold where their dissatisfactions outweigh the past investment they have made in the relationship. In such cases, the outcome of the next service episode becomes critical and any minor negative incidents can propel the customer outside the zone of tolerance – and the supplier unexpectedly loses a customer.
Any quality gap is a mix of facts and judgements, so each party is always ignorant to some extent of the other's changing intentions and expectations. In business-to-business contexts, expectations are best ‘negotiated’ between the parties involved through interaction, dialogue and agreement. Under these circumstances, service quality is measured in terms of the extent to which the customer perceives the supplier's performance meets or exceeds what have been agreed as appropriate levels of service. We will discuss the potential of dialogue in deepening value creation between partners in Chapter 6.
Service quality research by Parasuraman and his colleagues20 has led to the development of a ‘gap model’ that shows five kinds of ‘quality gaps’ or potential breaks in the relationship linkages that lead to quality shortfalls. A popular service quality measurement instrument known as SERVQUAL was developed from the gap model. Parasuraman et al. have suggested that a number of basic service quality dimensions can be generalised across markets as a standard form of measurement. These are reliability, responsiveness, assurance, empathy and tangibles.
Though SERVQUAL's value as an all-purpose measure has been criticised in recent years,21 the original gap model (see Figure 5.10) is insightful and remains a practical framework to use in service quality management.
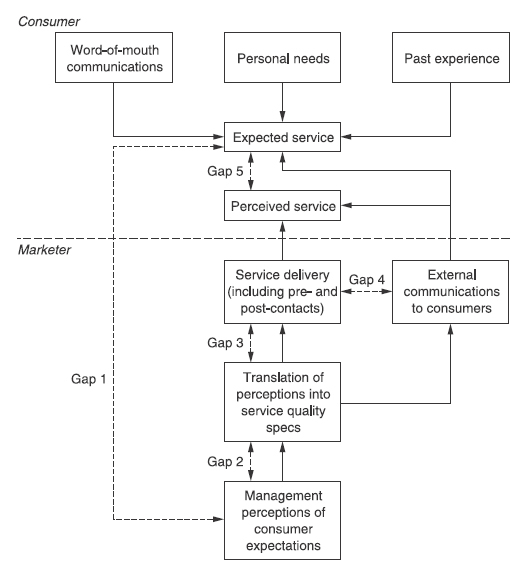
FIGURE 5.10 Conceptual model of service quality
Source: Reprinted with permission from Journal of Marketing published by the American Marketing Association, Parasuraman, A., Zeithaml V. A. and Berry L. L., ‘A Conceptual Model of Service Quality and its Implications for Future Research’, 1985, Fall, 49, 41–50.
The service gaps are as follows:
![]() Gap 1 is not knowing what customers expect
Gap 1 is not knowing what customers expect
![]() Gap 2 is not selecting the right service designs and standards
Gap 2 is not selecting the right service designs and standards
![]() Gap is not delivering up-to-service standards
Gap is not delivering up-to-service standards
![]() Gap 4 is not matching performance to promises.
Gap 4 is not matching performance to promises.
These four gaps lead to a fifth gap which is an aggregate of gaps 1–4.
![]() Gap 5 is the gap between customer expectations and customer perceived performance.
Gap 5 is the gap between customer expectations and customer perceived performance.
In other words, gaps 1–4 are service gaps that account for gap 5.
A simple metric for gap 5 would be:
![]()
Using this formula, anything less than 100 per cent is deemed to be less than ideal service. Therefore the service quality challenge is simple – to bring perceived performance and customer expectations into line.
Figure 5.11 represents a situation where expectations and perceived performance do not coincide. The organisation can respond in two possible ways, neither of which excludes the other.
The first response is to explore why perceived performance is low. For example, actual performance could be low across a range of critical issues. Alternatively, customers’ perceptions may have been influenced by negative experiences or unreliability in one particular aspect of performance. For instance, they may have had difficulty in getting satisfactory responses to telephone queries, even though the product is always delivered on time. Either way, there is work to be done within the firm in terms of gaps 1–4.
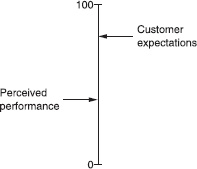
FIGURE 5.11 Performance-expectation mismatch
Service levels should be ‘negotiated’ or agreed in advance.
The second response is to explore whether the firm has properly understood customer expectations. In other words, have customers built expectations that are out of line with the firm's ability to perform? Advertising may create expectations that the firm finds hard to deliver on, for example. Likewise, in order to close a sale, salespeople sometimes make promises regarding delivery that a company is just not able to keep. Alternatively, some customers may just expect a higher level of service than the company has planned to deliver. In that case, the firm might be trying to satisfy too many segments of consumer interest with one solution. Service levels should be ‘negotiated’ or agreed in advance whenever possible to reduce the scope for misunderstandings later. Again, there is work to be done within the firm in terms of gaps 1–4.
Management stands little chance of working systematically to close gaps 1–4 if it does not understand customer perceived quality determinants and routinely measure them as part of a range of monitoring systems, as we discussed earlier. This task should be guided by the service needs of different value segments that it should already have identified, as we discussed in Chapter 2.
Benchmarking
Companies should also assess perceptions of service performance against some appropriate industry benchmark. That benchmark could be the market performance of key competitors or the internal capability, in any given area, of non-competitors. Indeed, it is unwise to measure your performance only against competitors, as this can lead to the kind of complacency expressed in the statement ‘we are no worse than anyone else’. Benchmarking should attempt to provide a relative measure of best practice that is relevant to the marketplace in which a firm competes. A checklist of key areas for benchmarking is shown in Figure 5.12.
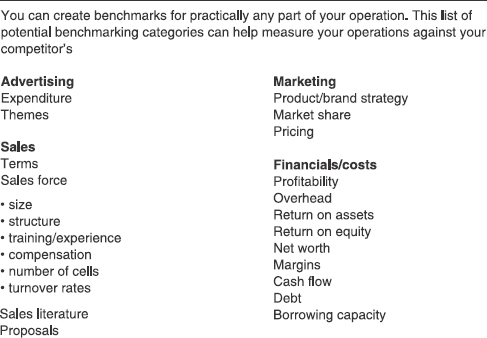
FIGURE 5.12 Benchmarking checklist
Source: Based on Strategic Intelligence Checklist, Fuld & Co. Inc., Cambridge, Ma.
The Japanese term dantotsu, which means the attempt to become the ‘best of the best’, aptly summarises the idea of benchmarking. Benchmarking involves continuously assessing the company's products, services and practices against the standards of companies that are identified as industry leaders, and it results in continuous improvement in products and processes.
Camp22 has identified a number of benefits a company derives from benchmarking. These include:
![]() The ‘best practice’ from any industry can be creatively adapted and incorporated into the activities and processes of the firm.
The ‘best practice’ from any industry can be creatively adapted and incorporated into the activities and processes of the firm.
![]() Benchmarking can provide stimulation and motivation to the professionals whose creativity is required to perform and implement benchmark findings.
Benchmarking can provide stimulation and motivation to the professionals whose creativity is required to perform and implement benchmark findings.
![]() Benchmarking breaks down ingrained reluctance to change. It has been found that people are more receptive to new ideas and their creative adoption when those ideas did not necessarily originate from their own industry.
Benchmarking breaks down ingrained reluctance to change. It has been found that people are more receptive to new ideas and their creative adoption when those ideas did not necessarily originate from their own industry.
![]() Benchmarking may also identify a technological breakthrough that would not have been recognised, and thus not applied, in a company's own industry for some time to come.
Benchmarking may also identify a technological breakthrough that would not have been recognised, and thus not applied, in a company's own industry for some time to come.
One of the earliest firms to formulate benchmarking as a market-sensing process was Xerox Corporation. It first started benchmarking in its manufacturing activity and, following successes there, top management directed that all cost centres and business units should benchmark their activities. Employees were deeply involved in the benchmarking process.
But over the past twenty years benchmarking has expanded from purely focusing on competitors to embracing a wider but selective focus on top-performing companies regardless of their industry sector. Non-competitive benchmarking is now recognised as a good way of leveraging improvements to any internal aspect of a company's operations. It involves outperforming rather than matching the efforts of the benchmarked company. Clearly, gaining information on non-competitors and their internal systems and processes is going to be easier than it would from competitors, especially as benchmarking partnerships can generate two-way exchanges of knowledge.
The value chain concept that we discussed earlier can be especially useful in benchmarking studies. Businesses can identify areas for improvement by systematically comparing processes within each element of their value chain with those of competitors. Such systematic comparisons can highlight areas where they can secure gains. For example, a firm might discover that competitors are subcontracting activities to third parties more cheaply than they could do them themselves.
Managing service variability
Companies have to manage variability in the way service is delivered.
Companies have to manage variability in the way service is delivered, as it certainly will not correct itself. Very often no one really knows why a routine procedure was established the way it was, why jobs are organised the way they are, or why the physical work environment was designed the way it was. Nor does it occur to people that things could be done another way. They simply assume, for example, that if a quality problem were easy to fix, it would have been fixed already. But companies often find that what, at first, seems impossible to change can actually be changed, once the assumptions about the nature and purpose of the underlying cross-functional process are made visible.
The quality ‘gap model’, already discussed (see Figure 5.10), provides a useful starting point for reviewing the service system overall and attending to quality gaps. This is also the way to begin investigating any unwarranted service variability. But critical quality issues tend to be interrelated and modifying sections of a service system without identifying the ‘root causes’ of problems runs the risk of unknowingly creating bottlenecks elsewhere. One useful approach is to consider any service system as having four structural levels, as represented in Figure 5.13. Using this diagnostic model as a guide, businesses can consider whether to remove constraints in the service environment (service-scape), process flow (sequential activity links), job design (who does what), or in employee training (skills and empowerment).
This kind of analysis opens up service design and redesign possibilities. Again, because each structural level is part of the total value delivery where all parts are interrelated, these possibilities should not be seen as mutually exclusive but as threads that may be woven in different ways into the total design fabric.
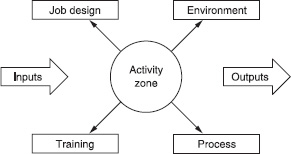
FIGURE 5.13 Diagnostic model: find the structural constraints
1. Environmental setting
The environment, or service-scape, in which the customer ‘faces’ the service provider is critical to the perceived quality of service. The ‘situational’ variables are often overlooked. The physical aspect is obviously a major component of environmental design but there are emotional and psychological features as well.23
In other words, the environment affects customers’ behaviour by influencing the meaning they draw from a particular setting. This includes issues of orientation, learning where we are, where we are going, how things work and what behaviour is expected from us as a customer or as a service provider.
Each and every service encounter may be said to prescribe and to be prescribed in a ‘service interaction zone’. In any service organisation there will be a number of different service interaction zones and service access ‘channels’ through which customers will see service differently. Defining the key service interaction zones can give suppliers a contextual framework for analysing customer perceived service quality, and that, in turn, can lead to radical redesign of these zones. The ideal service environment setting will prepare the customer by giving visual, procedural and psychological cues that both define and support their expectations of service quality.
2. Job design
A service company earns its reputation for good service by consistently delivering what customers expect of it. Over time, jobs often develop haphazardly with little regard for customer concerns. In extreme cases jobs can become arbitrary groupings of activities that machines can not do, and this leads to role conflict or ambiguity. People tend to take job designs for granted, and assume that poor performance in the job must be the worker's fault.
But badly-designed jobs often conceal defects in the environment and the design of processes. Indeed, a badly-designed job performed well can disrupt the work performance of the next internal customer ‘downstream’ who has to put up with inadequate inputs. Managers often forget that they need to keep in mind cross-functional linkages between internal customers and internal suppliers when they are designing jobs. Staff are motivated to perform well if they have good working conditions and a sense of their own worth in an organisation. Companies can create this environment by designing jobs where tasks are clear, where there is some autonomy and variety and where cross-functional linkages are transparent.
3. Processes
Service design or redesign includes changing the way a firm sequences its external (interactive) processes and manages its internal (service support) processes. We discussed this at length earlier in this chapter. Poor process design prevents workers from giving their best, increases waste and increases the time it takes to complete a service process cycle. One way to proceed is as follows:
![]() Select a critical customer service issue that needs attention.
Select a critical customer service issue that needs attention.
![]() Identify the external (interactive) and internal (service support) processes that might connect to the particular customer service issue. An Ishikawa diagram (fishbone technique) may help here. One problem is that the language of the customer (complaints about waiting time in queues, for example) does not indicate which particular processes are involved. You may also need to address cross-functional issues.
Identify the external (interactive) and internal (service support) processes that might connect to the particular customer service issue. An Ishikawa diagram (fishbone technique) may help here. One problem is that the language of the customer (complaints about waiting time in queues, for example) does not indicate which particular processes are involved. You may also need to address cross-functional issues.
![]() Record the steps in the external (interactive) process next, that is, the time cycle of service as experienced by a typical customer.
Record the steps in the external (interactive) process next, that is, the time cycle of service as experienced by a typical customer.
![]() Identify which steps in the cycle contribute to customer value and which do not. This is best handled by a team-based diagnostic review, using whatever service quality data is available.
Identify which steps in the cycle contribute to customer value and which do not. This is best handled by a team-based diagnostic review, using whatever service quality data is available.
![]() Identify which internal service support processes critically connect with the external (interactive) sequence already identified above. Record all the steps, end to end, for any internal (service support) process that seems to impact critically on the particular external (interactive) process under review. Use flow-charting techniques for this.
Identify which internal service support processes critically connect with the external (interactive) sequence already identified above. Record all the steps, end to end, for any internal (service support) process that seems to impact critically on the particular external (interactive) process under review. Use flow-charting techniques for this.
![]() Identify which steps in the process contribute value and eliminate or modify the rest. You can also use the fishbone technique here as a brainstorming aid in generating some possible solutions to process problems. Changes might be made to job design and environmental setting, as well as the process under review. In other words, a process problem can end up having a job design solution. Alternatively, the service interaction zones might need to be modified. The test is always: which possible changes contribute most to customer value at least cost? People still do not fully appreciate that substantial improvements in service quality can result in substantial cost savings.
Identify which steps in the process contribute value and eliminate or modify the rest. You can also use the fishbone technique here as a brainstorming aid in generating some possible solutions to process problems. Changes might be made to job design and environmental setting, as well as the process under review. In other words, a process problem can end up having a job design solution. Alternatively, the service interaction zones might need to be modified. The test is always: which possible changes contribute most to customer value at least cost? People still do not fully appreciate that substantial improvements in service quality can result in substantial cost savings.
4. Training
We pointed out in Chapter 2 the key role employees play in delivering customer value. Clearly, appropriate training is critical. Staff find the job they do and the training they receive motivating when they have a goal that clearly relates to producing customer value. They respond to opportunities to test their personal limits and, in so doing, contribute to the customer relationship and the organisation's success.
The sequence of events is different in services marketing from product marketing. A service is typically ‘sold’ before it is produced or consumed. Unlike manufacturing systems, the operations processes cannot be isolated from customers and staff as both these groups may contribute to the service performance. The interactions of customers and staff transform the service production and delivery system from static to dynamic. This presents both problems and opportunities for marketers. For example, employees may have to be given considerable latitude if service performance is to improve.
Some organisations are tempted to focus too closely on training in their plan for improving service quality. Training is vital but our own work in this area suggests that there is a ‘recursive’ (that is, backwards and forwards) relationship between the environmental setting for service, the design of jobs, the people (who are involved in the operational processes) and the processes (which involve people). Each structural element is embedded in the other and each is part of the key to effectively designing or redesigning the service.
Having said all this, you will never entirely eliminate variability in service performance. The firm's goal should be to reduce unwarranted variations in quality so long as the value being added exceeds the total cost of achieving the objective. Indeed, one eminent Japanese statistician, Genichi Taguchi, has said that there is an incremental economic ‘loss’ for each deviation from customer ‘target requirements’, and that this has a flow-on effect to society as a whole, in the form of environmental degradation and waste of human potential.
Empowerment and collaboration
It is all too easy to attribute the quality of service, or lack of it, to the strengths or weaknesses of front-line service staff. But service ‘performance’ is the sum of the internal processes and activities for which staff are the agents and in which customers are the co-participants. In addition, giving front-line staff a degree of performance latitude, rather than controlling them by rules, may improve the value delivered. The fact that all customers are different adds weight to the case for empowerment. It seems obvious enough to give staff discretion, within guidelines, to match customer needs with what is on offer. But the idea of empowerment is often illusory, or else forced on staff in such unreasonable ways that it demotivates them.24 Losing employee commitment means losing value-creating potential.
Certainly front-line service staff must perform well and need to be educated in customer service skills. This is a separate and important marketing function. But trying to improve ‘front-line’ service performance by improving staff customer-service training will add cost, not value, unless the design of work activities, the environment in which service is delivered, and the processes involved are all targeted for improvements as part of a continuous diagnostic review.
Internal suppliers and internal customers need to collaborate to build relationships in external markets. Any marketing activity within internal markets that involves the collaboration of internal customers and suppliers can be considered as internal marketing – an issue we raised in Chapter 3.
For us, internal marketing involves creating an organisational climate where employees can contribute significantly to improvements in cross-functional quality and service. As such internal customers and suppliers feel motivated to challenge continuously the activities that need to be changed. But this level of internal marketing requires a strategy for developing relationships between staff across internal organisational boundaries, in order to exploit fully the combined knowledge of people in different departments.25 We will return to this issue in Chapter 6 in more depth.
SUMMARY
Surviving in volatile markets depends on managers understanding that getting and keeping customers requires continuous improvement and innovation. Firms have to choose whether to drive workers harder at their assigned tasks or invite them to participate in generating new ways of improving performance. The first way treats people as ‘prisoners’ of the process and the second invites people to be agents of the process – an entirely different challenge and one to which their experience within the process makes them ideally suited.
Poorly-designed processes lead to poor outcomes. Invariably, we find that the process is the villain not the worker. So companies need to review the policies, premises, procedures, machines and job structures which support – or hinder – the quality of employees’ work. Processes can not be entirely standardised, of course, but at least firms can discover the ‘fail points’ by flow-charting the relationship between various work activities and use this knowledge to reduce the variability of key processes.
Managerial knowledge – the sum of their accumulated experience – is seldom broad or deep enough to sustain an ongoing diagnostic review of work processes in changing markets. Generating and sharing knowledge within organisations and participating in improvement up, down and across organisations is what is required to start the wheel of quality improvement turning.
In the next and final chapter we extend and embed these ideas in a broad framework for developing and implementing a relationship strategy for the business. Companies need to find ways of linking strategies across multiple markets to create value for all their stakeholders. This is the vital last step in the value-creation and delivery sequence.
References
1 Gummesson, E. (1991), ‘Marketing Revisited: The Crucial Role of the Part Time Marketer’, European Journal of Marketing, 25,2.
2 Deming, W.E. (1982), Out of the Crisis, Cambridge, MA: Massachusetts Institute of Technology.
3 Imai, M. (1986), Kaizen: The Key to Japan's Competitive Success, New York: Random House.
4 Juran, J.M. (1989), Juran on Leadership for Quality, New York: Free Press.
5 Oakland, J.S. (2000), Total Quality Management, 2nd edn, Oxford: Butterworth-Heinemann.
6 Gummesson E. (1988), ‘Service Quality and Product Quality Combined’, Review of Business, 9,3.
7 Grönroos, C. (2000), Service Management and Marketing: A Customer Relationship Management Approach, 2nd edn, Chichester: Wiley.
8 Porter, M.E. (1985), Competitive Advantage: Creating and Sustaining Performance, New York: Free Press, p. 130.
9 Ballantyne, D, Christopher, M. and Payne, A. (1995), ‘Improving the Quality of Services Marketing: Service (Re) design is the Critical Link’, Journal of Marketing Management, 11, 1–3, 9–10.
10 Vandermerwe, S. (1993), From Tin Solders to Russian Dolls, Oxford: Butterworth-Heinemann.
11 De Bono, E. (1994), Parallel Thinking, London: Viking/Penguin Books.
12 Shostack, G.L. (1985), Planning the Service Encounter, in The Service Encounter, Czepiel, J.A. (ed.) Lexington, MA: Lexington Books.
13 Derived from Wyckoff, D. (1984), ‘New Tools for Achieving Service Quality’, The Cornell Hotel and Restaurant Administration Quarterly, November, 78–91.
14 The theatre metaphor of service can also be understood as dramaturgy. See Grove, S. J., Fisk, R.P. and Bitner, M.J. (1992), ‘Dramatizing the Service Experience: A Managerial Approach’, Advances in Service Marketing and Management, 1.
15 There is a sematic confusion in terms in use for service interaction. In a Nordic School perspective from Liljjander, V. and Strandvik, T. (1995), ‘The Nature of Customer Relationships in Services’, in Bowen, D., Brown, S.W. and Swartz, T.A. (eds), Advances in Services Marketing and Management, Greenwich CT: JAI Press, the interaction process is characterised as a sequence of episodes, which contain acts. These can also be understood as moments of truth or critical incidents.
16 Other mapping processes for the ‘cycle of service’ are described by Albrecht, K. (1990), Service Within, Homewood IL: Dow Jones-Irwin, and also as ‘customer activity cycles’ in Vandermerwe, S. (1993), op. cit.
17 For a good critique of customer satisfaction and service quality measurement logics, see Oliver, R.L. (1997), Satisfaction: A Behavioral Perspective on the Consumer, New York: McGraw-Hill.
18 Grönroos, C. (1984), Strategic Management and Marketing in the Service Sector, Bromley: Chartwell-Bratt, 38–40.
19 Zeithaml, V.A., Berry, L. L. and Parasuraman, A. (1993), ‘The Nature and Determinants of Customer Expectations of Service’, Journal of the Academy of Marketing Science, 21, 1, 1–12.
20 Parasuraman, A., Zeithaml, V.A. and Berry L.L. (1985), ‘A Conceptual Model of Service Quality and its Implications for Future Research’, Journal of Marketing, 49, Fall, 41–50.
21 See for example, Oliver, R.L. (1997), op. cit.
22 Camp R. E. (1989), Benchmarking: The Search for Industry Best Practices that lead to Superior Performance, New York: ASQC Quality Press.
23 Bitner, M.J. (1990), ‘Evaluating Service Encounters: The Effects of Physical Surroundings and Employee Responses’, Journal of Marketing, 54, 69–82.
24 Argyris, C. (1998), ‘Empowerment: The Emperors’ New Clothes’, Harvard Business Review, May-June, 98–105.
25 Ballantyne, D. (2000), ‘Internal Relationship Marketing: A Strategy for Knowledge Renewal’, International Journal of Bank Marketing, 18,6, 274–86.