Creating value for the organisation |
INTRODUCTION
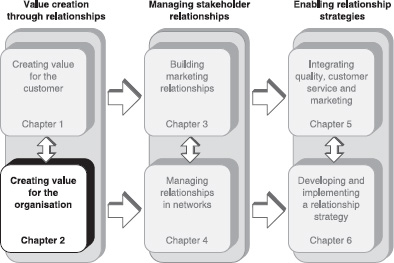
The value-creation process consists of the three key elements shown in Figure 2.1 – determining what value the company can provide to its customers (the ‘value customer receives’); determining the value the organisation receives from its customers (the ‘value organisation receives’); and, by successfully managing this value exchange, maximising the lifetime value of desirable customer segments. Chapter 1 considered customer value from the perspective of how to create and deliver value to customers. This chapter examines the value-creation process in terms of creating value for the organisation. It then outlines an approach to identifying the customer needs and service strategies that both match service requirements and take into account the economic value of customer segments to the organisation.
The customer's value to the organisation is the outcome of providing and delivering superior value to the customer; deploying improved acquisition and retention strategies; and utilising effective channel management. Understanding the economics of customer acquisition and retention and their relationship with customer lifetime value is fundamental to the concept of customer value in this context, as is identifying opportunities for cross-selling, up-selling and building customer advocacy. It is particularly important to address value from a customer segment point of view rather than taking an aggregated approach.
This chapter explores the value the organisation receives from the customer. First, we review the importance of understanding customer value and profitability from a market segment and individual customer perspective. Second, we examine the relationship marketing ladder of customer loyalty. Third, we discuss the economics of customer acquisition. Fourth, we examine the economics of customer retention and customer lifetime value analysis. Finally, we outline a framework for developing a segmented service strategy that considers both the value the customer receives and the value the organisation receives.
Customer value, profitability and market segments
Segmentation is perhaps the most important aspect of value creation.
Segmentation is perhaps the most important aspect of value creation from a relationship marketing perspective, as it provides the opportunity to tailor the offer to the needs of specific segments. Carefully segmenting the market and developing an approach that maximises the value of your most desirable customer segments and the corresponding lifetime value that these customer groups produce for your company, lies at the heart of the value-creation process.
Market segmentation is important from both the perspectives of value shown in Figure 2.1. First, as we explained in Chapter 1, market segmentation is essential in order for companies to target relevant offers and value propositions to specific groups. Second, it is critical to understand the existing profitability of customer segments (and, in certain businesses, the profitability of individual customers) and initiate action to realise the potential profitability of those segments and consequently improve customer lifetime value.
It is perhaps surprising that most companies focus on identifying the profitability of products rather than customers,1 when it is customers who generate profits, not products. Products create costs but customers create profits. This distinction is more than mere semantics. We find that the difference between profit and loss is typically determined after the product is manufactured. The costs of storing, moving and supporting products are significant. Customers differ widely in their requirements for delivery service, in their ordering patterns and, indeed, in the products they purchase. Each product has its own unique profile of margin, value/density, volume and handling requirements. Similarly, customers will order different product mixes, will have their own unique requirements as to the number of delivery points and, of course, the number of times they order, and the complexity of their orders will differ. Putting all these factors together can produce widely differing cost implications for the supplier.
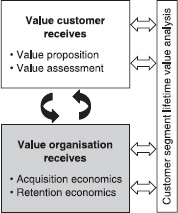
The so-called ‘Pareto Law’, or 80/20 rule, tells us not only that 80 per cent of the total sales volume of a business is generated by just 20 per cent of its customers, but also that 80 per cent of the total costs of servicing all the customers will probably be incurred by only 20 per cent of the customers (but probably not the same 20 per cent).
Figure 2.2 illustrates the shape of the profit distribution resulting from the uneven spread of revenues across the customer base. From this example you can see the ‘tail’ of customers who are actually unprofitable and who therefore reduce total profit contribution. It is essential to understand into which segment these customers fit.
One of the key tenets of relationship marketing is that ideally the firm should only seek intense relationships with customers in segments that are, or have the potential to become, very profitable. So being able to create customer segment profit and loss accounts is fundamental to a successful relationship marketing strategy. And suppliers need to create individual profit and loss accounts for their large corporate customers.
FIGURE 2.2 Customer profitability analysis
Source: Based on Christopher1
The problem is that traditional accounting systems make it difficult, if not impossible, to identify the true costs of serving individual customers. Companies often assume that there is an ‘average’ cost of serving a customer, thus forgoing the opportunity to target those customers or segments that have real potential for transforming their own bottom line.
Why should customers differ in their real profitability?
The first reason why customers’ profitability differs is that different customers will often buy a different mix of products. Because individual products have different gross margins, the mix of products customers buy will affect those customers’ particular profitability.
But there are also substantial differences in the costs of servicing individual customers. As we have already noted, profitability is largely determined by what happens after the point of production.
The costs of service begin with the order itself: how much time does the sales person spend with the customer? is there a key account manager who spends their time wholly or in part working with that customer? what commissions do we pay on these sales? and so forth.
Then there are the order processing costs which themselves differ according to the number of lines on the order, the number of orders and their complexity. Beyond this there are transport costs, materials handling costs and often – particularly if goods are held on a dedicated basis for a customer, such as own-label products – inventory and warehousing costs.
With large corporate customers, suppliers often allocate specific funds for customer promotions, advertising support, additional discounts and the like. Promotions – a special pack for a particular retailer, for instance – will often carry additional hidden costs to the supplier. For example, the disruption to production schedules and the additional inventory holding cost is rarely accounted for or assigned to customers.
The basic principle of customer profitability analysis is that the supplier should seek to assign all costs that are specific to individual accounts. A useful test to apply when looking at these costs is to ask: What costs would I avoid if I didn't do business with this customer? The benefit of using the principle of ‘avoidability’ is that many costs of servicing customers are actually shared among several or many customers. The warehouse is a good example: unless the supplier could release warehousing space for other purposes then it would be incorrect to allocate a proportion of the total warehousing costs to a particular customer.
A checklist of costs a manufacturing company might include when drawing up the ‘profit and loss account’ for specific customers is given in Figure 2.3.
Although it may be impractical to undertake such analysis for individual accounts, organisations should be able to select a sample of representative customers in order to gain a view of the relative costs associated with different types of accounts, distribution channels and market segments.
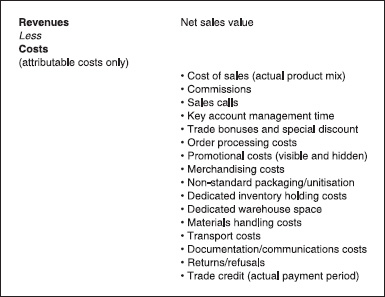
FIGURE 2.3 The customer profit and loss account
Source: Based on Christopher1
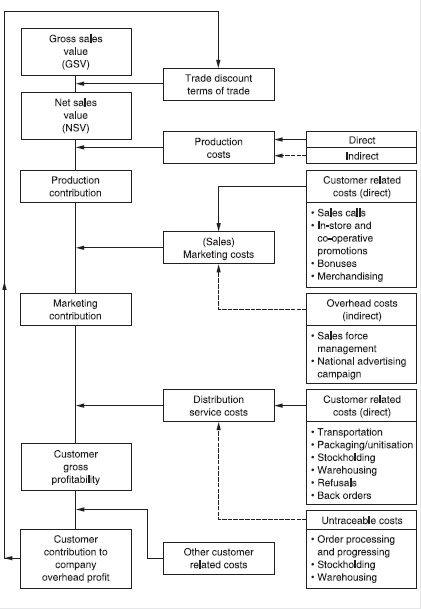
The recommended procedure for implementing customer profitability analysis is highlighted in the flow chart shown as Figure 2.4.
What often emerges from customer profitability studies is that the largest customers in terms of volume, or even revenue, may not be the most profitable because they cost so much to service. Although these larger customers may gain bigger volume-based discounts, they require more frequent deliveries to more dispersed locations and they may insist on non-standard pallets, for example.
What ultimately should be the purpose of this analysis? Ideally we require all our customers to be profitable in the medium to long term and where customers currently are profitable we should seek to build and extend that profitability further.
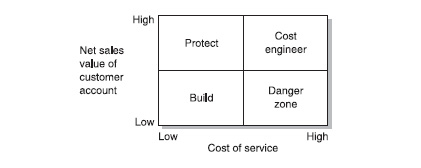
The customer profitability matrix illustrated in Figure 2.5 provides some generalised guidance for strategic direction.
Briefly, the appropriate strategies for each quadrant of the matrix are:
![]() Build: These customers are relatively cheap to service but their net sales value is low. Can you increase volume without proportionately increasing the costs of service? Can you direct the sales team to seek to influence these customers’ purchases towards a more profitable sales mix?
Build: These customers are relatively cheap to service but their net sales value is low. Can you increase volume without proportionately increasing the costs of service? Can you direct the sales team to seek to influence these customers’ purchases towards a more profitable sales mix?
![]() Danger zone: You should look at these customers very carefully. Is there any medium- to long-term prospect of a strategic reason for keeping them? Do you need them for their volume even if their profit contribution is low?
Danger zone: You should look at these customers very carefully. Is there any medium- to long-term prospect of a strategic reason for keeping them? Do you need them for their volume even if their profit contribution is low?
![]() Cost engineer: These customers could be more profitable if the costs of servicing them could be reduced. Is there any scope for increasing drop sizes? Can deliveries be consolidated? Would developing new accounts in the same geographic area make delivery more economic? Is there a cheaper way of gathering orders from these customers, such as via telesales?
Cost engineer: These customers could be more profitable if the costs of servicing them could be reduced. Is there any scope for increasing drop sizes? Can deliveries be consolidated? Would developing new accounts in the same geographic area make delivery more economic? Is there a cheaper way of gathering orders from these customers, such as via telesales?
![]() Protect: High net-sales-value customers who are relatively cheap to service are worth their weight in gold. You should seek relationships with these customers which will make them less likely to turn to alternative suppliers. At the same time you should constantly seek opportunities to develop the volume of business that you do with these customers, while keeping strict control of costs.
Protect: High net-sales-value customers who are relatively cheap to service are worth their weight in gold. You should seek relationships with these customers which will make them less likely to turn to alternative suppliers. At the same time you should constantly seek opportunities to develop the volume of business that you do with these customers, while keeping strict control of costs.
Ideally the organisation should seek to develop an accounting system that routinely collects and analyses customer profitability data. Unfortunately most accounting systems are product rather than customer focused. Likewise, costs are traditionally reported on a functional rather than a transactional basis. So, for example, we know the costs of the transport function as a whole or of making a particular product. But we do not know the costs of delivering a specific mix of product to a particular customer.
Businesses have to define more clearly the value they want to provide for their chosen customer segments and then focus on ways to deliver that value most cost-effectively.
Why relationship development adds value
Existing customers are easier to sell to and are frequently more profitable.
In mature markets, and as competition intensifies, it becomes imperative for organisations to recognise that existing customers are easier to sell to and are frequently more profitable. But though managers may agree intellectually with this view, the practices within their organisations often tell a different story. They take existing customers for granted, while focusing their attention and resources on attracting new customers. Only when there is a breakdown in service quality and the customer leaves or is on the point of leaving does the company turn its attention to existing customers.
There are a number of examples of organisations that have invested too heavily in unselective customer acquisition only to find they have attracted a customer base that may be unprofitable and is not appropriate for further development. For example, some suppliers in the competitive mobile telephony market have gained many low-usage customers through undiscriminating advertising and poor customer targeting. As a consequence, customers have left in droves (up to 50 per cent a year in some segments) and profitability has plummeted.
Companies need to apply different strategies to new and existing customers and allocate differing portions of the marketing budget to them. The way funds are divided between new and existing customers will depend on a number of industry and company-specific factors. A start-up company, or one in a growing market or fledgling industry, will need to spend considerable resources on developing new customers, for example, while a well-established company in a mature market will need to focus primarily on retaining existing customers and intermediaries. But though the markets in most developed economies are mature, many companies still spend too much of their time and money on acquiring customers and too little on keeping them.
The relationship marketing ladder of loyalty
Experience suggests that most companies direct the greater part of their marketing activity at winning new customers. But while businesses need new customers, they must also ensure that they are directing enough of their marketing effort at existing customers. Those companies that focus too much on marketing to new customers often experience the ‘leaking bucket’ effect, where they lose customers because they are directing insufficient marketing activity generally, and customer service specifically, at them. Davidow has highlighted this problem: ‘It has always been incredible to me how insensitive companies can be to their customers. Most of them don't seem to understand that their future business depends on having the same customer come back again and again’.2 Too many companies, having secured a customer's order, then turn their attention to seeking new customers without understanding the importance of maintaining and enhancing the relationships with their existing customers.
The relationship marketing ladder of loyalty, illustrated in Figure 2.6, identifies the different stages of relationship development. Sales management and charity marketing have used such ladders for many years.3 The ladder is relevant for all groups within a company's distribution chain – buyers, intermediaries and consumers. We go on to discuss these groups in more detail in Chapter 3, where we refer to them collectively as ‘the customer market domain’.
The first task is to move a ‘prospect’ up to the first rung to a ‘purchaser’. The next objective is to turn the new purchaser into a ‘client’ who purchases regularly, and then a ‘supporter’ of the company and its products. The next step is to create ‘advocates’ who provide powerful word-of-mouth endorsement for a company. In a business-to-business context an advocate may ultimately develop into a ‘partner’ who is closely linked in a trusting and sharing relationship with the supplier.
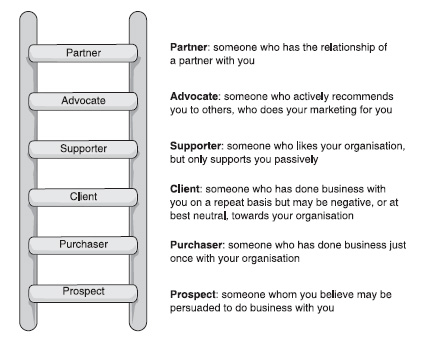
FIGURE 2.6 The relationship marketing ladder of loyalty
But it is not necessarily desirable to progress a relationship with every customer. Some customers or customer segments may not justify the investment needed to develop a ‘supporter’ or ‘advocate’ relationship, as it may prove too costly to do so. Frequently an organisation may need to change its marketing activities and increase marketing expenditure on the relationship building elements of the marketing mix. Managers therefore need to consider the existing and potential lifetime value of customers and determine whether it is appropriate to make this commitment.
The role of advocacy
The ‘advocate’ level on the relationship marketing ladder of customer loyalty is worthy of special emphasis. Referrals from customers are among the most relevant, effective and believable sources of information for other customers. A number of researchers have argued that word-of-mouth is the most effective source of information for consumers. While commercial sources normally inform the buyer, personal sources legitimise or evaluate products for them. Ligitimisation makes the step of converting prospects into customers on the ladder of loyalty that much easier.
Research by Jones and Sasser has found that, except in rare cases, total or complete customer satisfaction is key to securing customer loyalty, and that there is a tremendous difference between the loyalty of merely satisfied and completely satisfied customers. They cite Xerox research that found totally satisfied customers were six times more likely than satisfied customers to repurchase Xerox products and services over the following eighteen months. In discussing the measurement of loyalty, they point out that:4
![]() Customer referrals, endorsements, and spreading the word are extremely important forms of consumer behaviour for a company. In many product and service categories, word of mouth is one of the most important factors in acquiring new customers. Frequently, it is easier for a customer to respond honestly to a question about whether he or she would recommend the product or service to others than to a question about whether he or she intended to repurchase the product or service. Such indications of loyalty, obtained through customer surveys, are frequently ignored because they are soft measures of behaviour that are difficult to link to eventual purchasing behaviour.
Customer referrals, endorsements, and spreading the word are extremely important forms of consumer behaviour for a company. In many product and service categories, word of mouth is one of the most important factors in acquiring new customers. Frequently, it is easier for a customer to respond honestly to a question about whether he or she would recommend the product or service to others than to a question about whether he or she intended to repurchase the product or service. Such indications of loyalty, obtained through customer surveys, are frequently ignored because they are soft measures of behaviour that are difficult to link to eventual purchasing behaviour.
Which companies have a high proportion of customers who make such referrals and endorsement and exhibit advocacy? Discussions with many consumers and marketing executives suggest the following as examples:
Airlines: Virgin Atlantic, Southwest (a US airline)
![]() Banking: First Direct
Banking: First Direct
![]() Computers: Dell Computer
Computers: Dell Computer
![]() Healthcare: Shouldice (a Canadian hospital)
Healthcare: Shouldice (a Canadian hospital)
![]() Industrial services: Service Master (a US cleaning services company)
Industrial services: Service Master (a US cleaning services company)
![]() Motor cars: Lexus, Mercedes
Motor cars: Lexus, Mercedes
![]() Retailing: Nordstroms (a US retailer)
Retailing: Nordstroms (a US retailer)
![]() Trucks: Scania, Volvo
Trucks: Scania, Volvo
![]() Watches: Rolex
Watches: Rolex
But neither company practice nor academic research pay sufficient attention to the important area of advocacy and referral marketing. Few organisations have any formal processes that utilise referrals from existing customers. Though many organisations recognise that customers can be the most legitimate source of referrals to their prospective customers, most tend simply to let referrals happen rather than proactively developing marketing activities to leverage the power of advocacy.
Virgin Atlantic is an interesting example of this. In a recent executive seminar in the UK, 120 managers were asked to indicate whether they were advocates of various commercial organisations. Around 20 per cent claimed to be advocates of Virgin Atlantic, including five people who had never flown with the airline. Subsequently, one of the authors asked Sir Richard Branson to what extent he sought to leverage this advocacy. ‘It just happens and we enjoy the benefits of it,’ Sir Richard replied. We believe companies should adopt a more proactive approach to leveraging the power of advocates and try to reap benefits beyond ad hoc recommendations. We shall return to the role of advocacy as an important element of referral marketing in Chapter 3.
Customer acquisition and its economics
As noted above, the economics of customer acquisition and retention play a major role in creating value for the organisation and ultimately in the lifetime value of major customer segments. In this and the following sections we examine the economics of both acquisition and retention.
The importance of customer acquisition varies considerably according to a company's specific situation. For example, a new market entrant to the fast-paced world of e-business will focus primarily on acquiring customers, while an established manufacturing company operating in a mature market may be more concerned with retaining them.
Improving the customer acquisition process is typically concerned with:
![]() acquiring customers at a lower cost;
acquiring customers at a lower cost;
![]() acquiring more customers for the same (or less cost);
acquiring more customers for the same (or less cost);
![]() acquiring more attractive customers;
acquiring more attractive customers;
![]() acquiring customers utilising new channels.
acquiring customers utilising new channels.
The first step towards understanding customer value from the perspective of the supplier organisation is to determine how much the organisation currently spends acquiring customers within its existing channels, and how these costs vary across different segments or micro-segments.
Customer acquisition at Electro plc
To illustrate the economics of both customer acquisition and retention we will use an example from Electro plc, a fictional company based on a large UK electricity supplier.5 From the late 1990s the residential sector of the market changed substantially as a result of electricity companies being able for the first time to sell electricity outside their traditional geographic boundaries. Electro faced competition within its own territory from other electricity providers, but now could also market its services outside its traditional geography.
Electro segmented its customer base and identified four key market segments. Each of these displayed different characteristics in terms of socio-economic grouping, expected switching behaviour and customer profiles.
Electro collected the data it needed to analyse its customer acquisition and retention economics at the segment level. The data included: the number of existing customers within each segment; annual customer acquisition targets with reference to the total UK customer base; the cost of acquisition (per customer); and estimates of profit per customer per annum for each segment. It also considered the likely annual retention rates in the new competitive environment. It estimated different levels of retention for each segment, and one scenario of the broad characteristics of these segments is shown in Figure 2.7. Some of the figures stated have been adjusted to protect proprietary information.
As shown in Figure 2.7, Electro estimated the acquisition costs per customer at the segment level to be:
Segment 1 – ‘struggling empty nest super-loyals’ – £110;
Segment 2 – ‘older settled marrieds’ – £70;
Segment 3 – ‘switchable middles’ – £55;
Segment 4 – ‘promiscuous averages’ – £30.
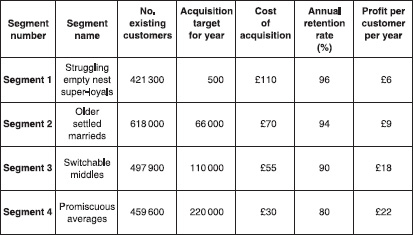
FIGURE 2.7 Customer segment data template for electro plc
But to make the comparison of acquisition costs meaningful, you also have to consider the expected profitability of the average customer in each segment along with the overall profit potential of each segment.
The profit per customer per annum in Segment 1 (the ‘struggling empty nest super-loyals’) was £6, making a break-even of 18.3 years. As this segment comprises elderly people, many of the customers will die before they break even. In the case of Segment 4 (the ‘promiscuous averages’) the profit per customer per annum was £22, making a break-even of 1.36 years. This segment is highly attractive in terms of acquisition economics, especially if a company puts in place relationship marketing strategies to retain customers successfully.
Unfortunately, many organisations operating in consumer markets still do not differentiate their customer profitability analysis activities at the segment level. As Electro used to, they contact each prospect the same number of times, rather than applying a level of effort consistent with each prospect's cost of acquisition and profit potential. This is not only a wasted investment, it can also annoy customers who are getting either too much or too little attention.
Acquisition across different channels
Electronic communication channels enable companies to acquire customers at a fraction of the cost of using more traditional channels.
Once they have determined the acquisition costs for different segments, companies then need to consider how acquisition costs may vary across different channels. The advent of websites and electronic communication channels has enabled companies to acquire customers at a fraction of the cost of using more traditional channels such as direct mail.
In the business-to-business sector, RS Components – a leading international supplier of electrical components and other products – understands extremely well the cost and customer service benefits of using the Internet alongside its more conventional channels. The company deals with its customers through physical branches, a call centre and, more recently, a highly sophisticated and personalised website. It has acquired a significant number of new customers and improved its profitability as a result of its Internet-based sales channel.
In the business-to-consumer sector, frozen food retailer Iceland also supplemented its traditional sales channels with a website. The initiative has proved highly successful, helping Iceland acquire customers from the more affluent segment that was not well represented in its existing customer base. What is more, the average order size of these online customers was higher and more profitable than that of the company's more traditional customers who shopped in its retail branches.
Improving customer acquisition
Equipped with a sound understanding of how acquisition costs vary at both the segment and channel levels, companies can then seek to acquire more, and more attractive, customers more cheaply. Companies can often improve their customer acquisition by acting on insights drawn from developing a customer value proposition. More refined promotional campaigns and encouraging customer referrals can also attract customers who meet its target criteria. First Direct, the leading UK bank, boasts the highest levels of advocacy in the retail banking sector. Approximately one-third of all its customers join as a direct result of customer referral – which carries the added bonus of reducing First Direct's average customer acquisition cost.
Customer retention and its economics
Writers and researchers have suggested that it costs around five times more to win a new customer than it does to keep an existing one. Yet, as we have pointed out, many companies have traditionally focused their marketing activity on acquiring new customers, rather than retaining existing customers. This may be due to the historical convention in many companies that rewards customer acquisition to a much greater extent than customer retention, or it may be caused by a lack of understanding of why customer retention can be such a boon to commercial profitability.
The profit impact of customer retention improvement
While most companies recognise that customer retention is important, relatively few understand the economics of customer retention within their own firm. Until fairly recently, there was little research that critically evaluated the relative financial benefits of customer acquisition versus customer retention. In 1990 Fred Reichheld and Earl Sasser, respectively a partner at consulting firm Bain & Co and a professor at Harvard Business School, published some revealing research demonstrating the financial impact of customer retention.6They found even a small increase in customer retention produced a dramatic and positive effect on profitability: a five percentage points increase in customer retention yielded a disproportionate improvement in profitability in net present value (NPV) terms. Increasing the customer retention rate from, say, 85 per cent to 90 per cent resulted in NPV profits rising from 35 per cent to 95 per cent among the businesses they examined. Later research showed this figure could be as high as 125 per cent, as shown in Figure 2.8.
These findings have been very influential in drawing attention to the critical role customer retention plays in developing a relationship marketing strategy.
The impact of retention on profitability
Why should retention have such a great effect on profitability? Reichheld and Sasser6 suggested a number of reasons to explain their findings:
![]() Acquiring new customers involves costs that can be significant and it may take some years to turn a new customer into a profitable customer.
Acquiring new customers involves costs that can be significant and it may take some years to turn a new customer into a profitable customer.
![]() As customers become more satisfied and confident in their relationship with a supplier, they are more likely to give the supplier a larger proportion of their business, or ‘share of wallet’.
As customers become more satisfied and confident in their relationship with a supplier, they are more likely to give the supplier a larger proportion of their business, or ‘share of wallet’.
![]() As the relationship with a customer develops, there is greater mutual understanding and collaboration, which produces efficiencies that lower operating costs. Sometimes customers are willing to integrate their IT systems, including planning, ordering and scheduling, with those of their suppliers, and this further reduces costs.
As the relationship with a customer develops, there is greater mutual understanding and collaboration, which produces efficiencies that lower operating costs. Sometimes customers are willing to integrate their IT systems, including planning, ordering and scheduling, with those of their suppliers, and this further reduces costs.
![]() Satisfied customers are more likely to refer others, which promotes profit generation as the cost of acquisition of these new customers is dramatically reduced. In some industries customer advocacy can play a very important role in acquiring new customers, particularly when there is a high risk involved in choosing a supplier.
Satisfied customers are more likely to refer others, which promotes profit generation as the cost of acquisition of these new customers is dramatically reduced. In some industries customer advocacy can play a very important role in acquiring new customers, particularly when there is a high risk involved in choosing a supplier.
![]() Loyal customers can be less price-sensitive and may be less likely to defect due to price increases. This is especially true in business-to-business markets where the relationship with the supplier becomes more valued and switching costs increase.
Loyal customers can be less price-sensitive and may be less likely to defect due to price increases. This is especially true in business-to-business markets where the relationship with the supplier becomes more valued and switching costs increase.
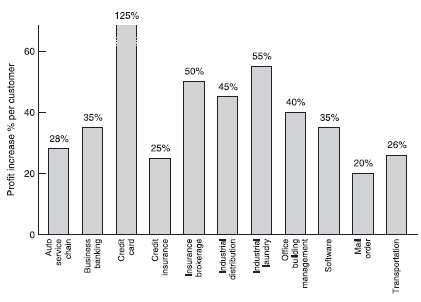
FIGURE 2.8 Profit impact of a 5 percentage points increase in customer retention for selected businesses
Source: based on Bain & Co
But companies need to treat measurement systems that provide aggregated measures with caution, as these may overlook individual differences. Companies need measurement systems that allow them to analyse their customer base, identify the profit potential within each segment and then to develop plans, including customer service strategies, to retain the most profitable segments. An important part of this process is establishing the potential profitability. Companies can do this by comparing segment profit increases during the period of time that interests them – five or ten years, say – or by comparing the net present value of the segments.
Relationship marketing – what managers measure
Management needs to understand the economics of customer acquisition and retention.
We have suggested that management needs to understand the economics of customer acquisition and retention in order to determine both present and future profitability prospects. In particular, they need to be aware of the dramatic impact that customer retention can have on profitability. We now examine the extent to which managers are actually using such measures and focusing on improving customer retention in their businesses.
Research by one of the authors among 200 large UK organisations indicates that many organisations are not allocating their marketing budget appropriately between acquisition and retention activities. The review identified three categories of organisation: ‘acquirers’, ‘retainers’ and ‘profit maximisers’, as shown in Figure 2.9.
‘Acquirers’ spent too much on customer acquisition activities at the expense of customer retention activities. The majority of firms – 80 per cent – fell into this category. ‘Retainers’, by contrast, spent too much on customer retention activities at the expense of customer acquisition. This group represented 10 per cent of firms. The ‘profit maximisers’ represented only 10 per cent of firms in the survey. Only the companies in this last category considered that they had identified and allocated expenditure appropriately between acquisition and retention activities.
Related research examined the extent to which UK managers measure the impact of their relationship marketing strategies. A study of marketing directors and senior marketing managers in large UK organisations suggests that managers have been slow to switch their marketing activities towards customer retention.7 It surveyed the marketing practices of 225 large UK organisations and revealed that while 41 per cent of marketing budget was spent acquiring customers, just 23 per cent went on retaining them. Some 35 per cent of respondents spent more than 40 per cent of their total marketing budget on acquiring customers, while only 7 per cent spent more than 40 per cent on retaining them.
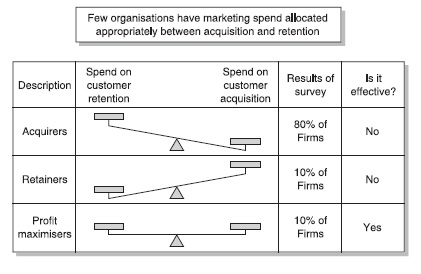
FIGURE 2.9 Companies’ relative expenditure on acquisition and retention
The study also investigated which measures managers considered important and which they used to evaluate their marketing activities. Measures included customer acquisition, customer retention, customer satisfaction, profit per customer and employee satisfaction. Customer acquisition (68.4 per cent) and customer satisfaction (64.4 per cent) were the most frequently measured. Customer retention was measured by 54.2 per cent. Profit per customer was measured by 52 per cent of organisations and 41.3 per cent measured employee satisfaction. It is interesting how few of the organisations surveyed measure all the important variables, given the importance of customer retention, the fact that customer and segment profitability vary greatly, and the findings, discussed later in this chapter, of the service profit chain research on the impact of employee satisfaction.8
Overall, the study showed that although many organisations understand the importance of customer retention, very few measure the economic value of their customer retention strategies. The study also showed that many organisations are neglecting to develop and use marketing metrics to help direct their relationship marketing strategy. Given that the sample probably represents some of the more sophisticated organisations, the overall picture in industry is probably worse than these findings suggest.
Improving customer retention
Because of the dramatic impact that improved customer retention can have on business profitability and the fact that many organisations continue to place too much emphasis on acquiring customers at the expense of keeping them, organisations clearly need to adopt a structured approach to enhancing their customer retention and profitability levels. There are three major steps in such an approach: measuring customer retention, identifying root causes of defection and key service issues, and developing corrective action to improve retention.
Step 1: Measuring customer retention
Organisations clearly need to adopt a structured approach to enhancing their customer retention and profitability levels.
Measuring retention rates for existing customers is the first step towards improving customer loyalty and profitability. It involves two major tasks: measuring customer retention rates and analysing profitability by segment.
To measure customer retention, organisations need to analyse a number of dimensions in detail. These include measuring customer retention rates over time, by market segment, and in terms of the product or service offered. If customers buy from a number of suppliers, share of wallet should also be identified.
As a result of this first step, companies should be able to define customer retention clearly, measure present customer retention rates and understand the existing and future profit potential for each market segment.
Step 2: Identifying causes of defection and key service issues
This step involves identifying the underlying reasons why consumers leave the company. Traditional marketing research into customer satisfaction does not always provide accurate answers as to why customers abandon one supplier for another. All too often customer satisfaction questionnaires are poorly designed, superficial and fail to address the key issues, forcing respondents to tick pre-determined response choices.
Companies need to identify clearly and understand the root causes of customer defection before they can begin to implement a successful customer retention programme. Highly experienced market researchers are often required to undertake this task.
Step 3: Corrective action to improve retention
The final step in the process of enhancing customer retention involves taking remedial action. At this point, plans to improve retention become highly specific to the organisation concerned and any actions taken will be particular to the given context. Some key elements include: marshalling top management commitment; ensuring employees are satisfied and dedicated to building long-term customer relationships; utilising best practice techniques to improve performance; and developing a plan to implement a customer retention strategy.
Increasingly, organisations recognise that enhanced customer satisfaction leads to better customer retention and profitability. Many organisations are now reviewing their customer service strategies to find ways to boost retention rates as a means of improving their business performance. This often entails a fundamental shift in business emphasis from customer acquisition to customer retention. Achieving the benefits of long-term customer relationships requires a firm commitment from everyone in the organisation to understanding and serving the needs of customers.
Customer retention at Electro plc
Returning to the Electro plc example above we now review the economics of customer retention. Electro reviewed how it could potentially and realistically improve customer retention through a relationship marketing strategy based on improved service and the relative attractiveness of the four segments it had identified. It used the views of several executives who were experienced in this area to identify the following achievable improvement targets:
Segment 1 (‘struggling empty nest super-loyals’) – 1 per cent,
Segment 2 (‘older settled marrieds’) – 2 per cent,
Segment 3 (‘switchable middles’) – 5 per cent, and
Segment 4 (‘promiscuous averages’) – 9 per cent.
The company used these planned increases in retention rates to model the increase that an improved service strategy would have on ‘gross’ profit in five and ten years. It then compared this with the base case, as shown in Figure 2.10.
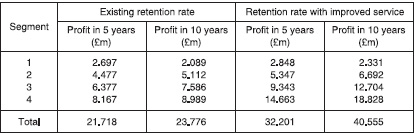
FIGURE 2.10 Profit projections with and without improved service
This modelling showed an increase in overall gross profit, before costs of improved service, of 48 per cent at year 5 (from £21.7 million to £32.2 million) and 71 per cent at year 10 (from £23.8 million to £40.6 million). The results within each of the four different segments varied significantly because of differences in planned retention rates and other inputs to the modelling.
Although few organisations evaluate segment profitability in anything other than basic terms, the broad approach is straightforward. It involves understanding the profit potential (gross profit less costs) of a segmented service approach in each segment, and selectively managing the segments to maximise profits.
Improving customer retention does not need to be expensive. The most attractive relationship marketing initiatives are those that the customer values a lot, but cost the supplier little to implement. The first thing organisations should do is consider reallocating existing expenditure to put greater emphasis on those segments with the greatest potential for increasing net present value profitability. This involves no significant increase in costs. The organisation can then identify market segments for additional incremental expenditure, with the objective being to ensure that the overall cost-benefit is significantly enhanced lifetime profitability.
Customer segment lifetime value analysis
The balance between the marketing efforts directed towards new and existing customers will vary greatly depending on whether the business is a start-up such as a ‘dot.com’, or a mature ‘bricks and mortar’ company. But in general, as we have seen, marketing expenditure is unbalanced with too much attention being directed at acquiring customers and too little at retaining them.
A company must look at the projected profit over the life of the account.
Companies need to understand acquisition and retention economics at the segment level in order to make decisions on how much marketing emphasis to place on them. To calculate a customer's real value a company must look at the projected profit over the life of the account. This represents the expected profit flow over a customer's lifetime. The key metric used here is customer lifetime value (CLV), which is defined as the net present value of the future profit flow over a customer's lifetime.
Companies will not want to retain all their customers. Some customers may cost too much to service, or so much to acquire, that they will never prove to be worthwhile and profitable. Clearly, it would be inadvisable to invest further in such customer segments. It is likely that within a given portfolio of customers, there may be some segments that are profitable, some that are at break-even point and some that are unprofitable. So increasing customer retention does not always lead to increases in customer profitability; indeed, in some instances, increasing the retention of unprofitable customers will reduce the company's profits. However, unprofitable customers may be valuable in their contribution towards fixed costs, and businesses need to exercise considerable caution when allocating fixed and variable costs to ensure that customers who make a contribution are not simply discarded.
The minimum data needed for retention modelling are shown in the headings in Figure 2.7. To recap, for each segment or micro-segment, you need to estimate: the number of existing customers; annual customer acquisition targets; the cost of acquisition per customer; and the profit per customer per annum. Changes in these variables over the time period chosen also need to be considered.
We suggest modelling profit on both an annual basis and on a CLV basis, as some managers still find year-on-year profit projections more concrete than discounted cash flows and net present values. Such modelling is important in helping organisations determine customer value in terms of potential profits and CLV. However, few organisations have reached the stage of understanding their existing acquisition economics and retention economics, let alone gone beyond it. Those that have can move on to modelling potential future profit improvement for each market segment.
Achieving increased profitability
When organisations model their potential future profit they need to take into account the fact that individual consumers may be persuaded to buy other products – cross-selling – or more of an existing product over time – ‘up-selling’. Also, corporate customers tend to buy from a range of suppliers. By improving its service a supplier may be able to increase ‘share of wallet’ as well as market share, especially through exploiting alternative channel structures such as the Internet.
So far, we have emphasised how companies can manage customer acquisition and retention to improve their profitability. But to become even more profitable they need to develop integrated programmes that address not only acquisition and retention, but also other related activities – such as cross-selling and up-selling – that can improve customer lifetime value.
One approach for reviewing such profit opportunities is the ACURA model shown in Figure 2.11.
ACURA is an acronym for ‘acquisition, cross-sell, up-sell, retention and advocacy’.9 Rarely do companies systematically build strategies that focus on all elements in the ACURA model. While companies seek to improve customer acquisition and retention, they also need to exploit cross-selling and up-selling and advocacy opportunities. Companies such as American Express are excellent at cross-selling, McDonald's excels at up-selling; and Virgin Atlantic and First Direct excel at creating advocacy within their customer bases.
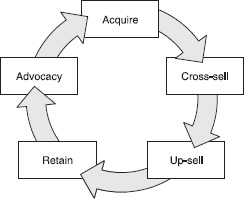
FIGURE 2.11 The ACURA model
For each element of ACURA, companies can usefully review potential strategies to improve profitability by market segment and then identify their potential profit impact. An overview of an exercise for strategies to cross-sell in a supermarket is shown in Figure 2.12.
This approach first identifies generic strategies to improve each element in the ACURA model. It then considers the profit potential of applying these strategies for each different element to different customer segments. Finally, it assesses each relevant strategy in more detail and implements it where appropriate.
Putting it all together: a framework for segmented service strategy
Companies need to take an integrated approach to identifying different customer needs and developing service strategies that both match the service requirements and take into account the economic value of customer segments.
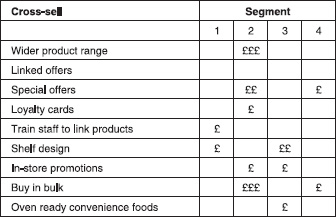
FIGURE 2.12 ACURA model cross-selling template for a supermarket
We now outline a framework for developing a segmented service strategy, as shown in Figure 2.13. This framework utilises the customer segment and profit potential approaches discussed above as well as some frameworks from the customer service literature. It integrates these elements into a structured approach to relationship marketing that aims to deliver both increased value to the customer and increased value to the organisation.
Step 1: Define the market structure
In order to segment the market properly you need to define the market structure clearly. ‘Market mapping’ is a technique that can help clarify the market structure and relationships between suppliers, intermediaries and customers. A market map defines the distribution and value-added chain between the suppliers and final users.10 An example of a market map for an insurance company is shown in Figure 2.14.
Market maps can be used to show the percentage of turnover and the percentage of profit made through each distribution channel and to illustrate the current and future importance of that channel. In the example in Figure 2.14 the insurance brokers and high street branches provide relatively low profit returns because of large commissions and expensive overheads, so the company might decide to try to migrate these customers to direct call centre sales. And those customers who use computers for other forms of shopping might find the e-commerce channel using the Internet appropriate for their needs.
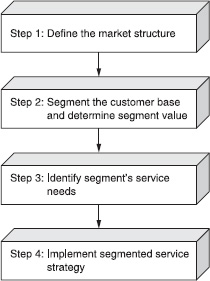
FIGURE 2.13 Framework for segmented service strategy
Customers may also interact with more than one channel. For example, Dell Computers has successfully used the Internet to enable customers to identify what model and configuration of computer they want. Although many customers still need to contact the call centre for further information and to purchase the computer, the overall customer acquisition costs for Dell have fallen significantly.
Once the company understands the market structure it can then take the appropriate steps for each channel and make strategic decisions about channel mix, re-channelling and the potential role of disintermediation. It needs to develop detailed metrics of market share, sales volume and profitability throughout the market map.
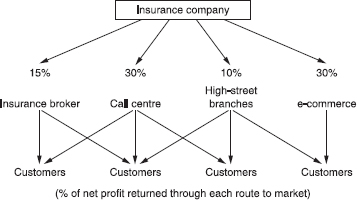
FIGURE 2.14 Market map for insurance company
Step 2: Segment the customer base and determine segment value
Companies also need to consider channel implications for each segment.
Step 2 involves segmenting the customer base using appropriate segmentation criteria and estimating the value of the customer segments. In the electricity company example above, we described four segments. These segments were identified using criteria such as behavioural, usage and lifestyle characteristics. Where the segments identified contain large numbers of customers, it may be appropriate to segment them further into micro-segments. Companies also need to consider channel implications for each segment, derived from the market map. For example, a pharmaceuticals distributor we have worked with segmented its customer base by product usage, strength of relationship, and complexity of decision-making unit. Its analysis of the potential value of segments led to it placing new emphasis on its emerging web sales channel and de-emphasising its traditional catalogue sales channel.
Using a modelling approach, such as the one described above, companies should then consider customer segments on the basis of their projected lifetime profitability. Each segment (or micro-segment) is analysed using profitability modelling over an appropriate time period. This process involves:
![]() Determining the profit projections in each segment.
Determining the profit projections in each segment.
![]() Determining the realistic opportunity for increasing customer retention in each segment and how this may vary across the time period under consideration. (An example of this is shown in the electricity company example above.)
Determining the realistic opportunity for increasing customer retention in each segment and how this may vary across the time period under consideration. (An example of this is shown in the electricity company example above.)
![]() Identifying the potential increase in projected ‘gross’ profits for each period and in lifetime profitability, as a result of improved customer retention.
Identifying the potential increase in projected ‘gross’ profits for each period and in lifetime profitability, as a result of improved customer retention.
This allows the segments to be prioritised initially according to their existing and potential expected lifetime value. Finally, the company needs to determine how much it will cost to make the changes in service needed to achieve the improved retention levels, in order to identify net profits for each segment. It may need to re-evaluate the segment priorities at this point.
Step 3: Identify segments’ service needs
Step 3 is concerned with investigating the service needs, expectations and performance levels within each customer segment. Companies need to identify performance levels for both themselves and their competitors. Service needs and performance can be determined by a range of market research techniques such as focus groups and in-depth interviews with customers. Tools such as conjoint or trade-off analysis can be used to analyse the results. Using this research, companies can then identify segments with similar service priorities.
The pharmaceuticals company mentioned above used this approach. It found that in its potentially most profitable segments price was relatively unimportant to its customers, compared with speed of delivery and complete orders. Using this information, the company instigated next day delivery and a system of automatic product substitution. Its order fulfilment performance increased dramatically and it significantly cut its inventory replacement time.
Often, research will identify gaps between the customer's requirements and the actual offers available. Companies can use tools such as gap analysis, which we go on to discuss in Chapter 5, to help them understand unfulfilled needs.
Service performance charts11 can be used to depict comparisons visually. These comparison charts appear to be much more widely used in logistics and customer service than in general marketing, but have considerable potential for helping companies develop a segmented service strategy. An example of such a chart is shown in the segment competitor profile in Figure 2.15. This uses data from the insurance company discussed above.
The segment competitor profile can be used to show customers’ perceptions of the performance of the company and its competitors. It also shows the relative importance of each attribute to the customer. The segment performance chart, derived from this segment data and shown in Figure 2.16, provides a simple but visually powerful means of illustrating the customer's perception of the importance of each service attribute or need and how well the company performs against them. This analysis needs to be undertaken for the company overall and for each market segment.
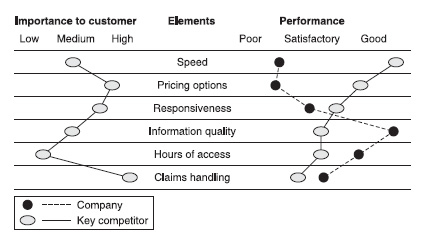
FIGURE 2.15 The segment competitor profile
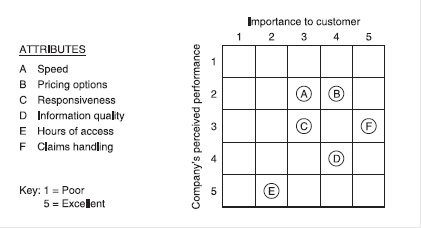
FIGURE 2.16 The segment performance chart
The attributes depicted in Figures 2.15 and 2.16 are those that are important for the insurance company discussed above. They enable the organisation to identify, overall and by segment, how it measures up against both customers’ key performance criteria and customers’ perception of their relative importance. Clearly, the organisation must seek to perform well in the areas that are most important to customers.
At this point the organisation should know, overall and for each segment, which are the most important customer criteria and how it is performing relative to its competitors. It can now start to consider to which customer segments its service capabilities and strengths are most suited.
Step 4: Implement segmented service strategy
The final step involves implementing a segmented service strategy based on the existing and potential value of the different customer segments and the organisation's service capabilities and strengths, relative to its competitors. This step involves three stages:
1. Reviewing existing segment performance to identify areas of over-performance and under-performance
If the company does not know which dimensions the customer values, it runs the risk of wasting resources through ‘service over-performance’ – that is, placing too much emphasis on a service dimension that the customer regards as relatively unimportant. Equally, the company needs to know where there is ‘service under-performance’ dimensions where it places little emphasis, but which are important to the customer. These positions and the ‘service target corridor’ are shown in the service management matrix in Figure 2.17. The company needs to obtain competitive performance data and relative performance data12 in order to identify areas of weakness (key areas for improvement) and areas of strength (where the company has competitive advantage).
Clearly the company needs to pay most attention to those areas that are most important to the customer and where the company's own performance is weak compared to the competition.
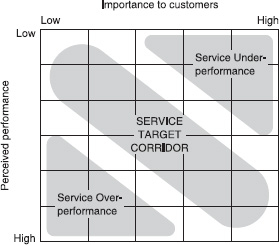
FIGURE 2.17 The service management matrix
2. Identifying costs of selectively improving service levels and fit with the company's capabilities
Based on the segment data the company has identified, it will need to consider five broad strategies:
1. For the most attractive existing segments, where there is a strong fit with the company's capabilities and overall good performance, the decision on where to invest should be clear.
2. Investment should be directed at segments which are not very profitable at present but where there is potential to increase their value.
3. Some segments are of secondary importance, so while strategies may be developed for maintaining the relationship there may be little reason to invest in customer service.
4. In segments where there is low or negative profitability and a poor match with the organisation's capabilities the company may elect to divest or deter customers.
5. For potentially high profit segments, which do not match existing capabilities of the firm, the strategy may not be clear. Should the company invest to improve performance or should it allow these groups to defect if they are dissatisfied with the service on offer?
A company should base decisions regarding these five groups on a review of the following:
![]() relating current segment performance to the company's capabilities;
relating current segment performance to the company's capabilities;
![]() identifying all segments where costs can be saved through service reduction in over-performance areas;
identifying all segments where costs can be saved through service reduction in over-performance areas;
![]() reallocating these funds to service improvement in under-performance areas based on customer importance and segment priorities;
reallocating these funds to service improvement in under-performance areas based on customer importance and segment priorities;
![]() estimating additional costs required to reach the customer retention improvement targets, identified in Step 2;
estimating additional costs required to reach the customer retention improvement targets, identified in Step 2;
![]() identifying the potential lifetime profits of segments in ‘net’ terms (that is, by reducing the potential increase in ‘gross’ profit calculated in Step 2 by the costs involved in improving retention);
identifying the potential lifetime profits of segments in ‘net’ terms (that is, by reducing the potential increase in ‘gross’ profit calculated in Step 2 by the costs involved in improving retention);
![]() finalising segment priorities based on the above analysis.
finalising segment priorities based on the above analysis.
For the potentially high profit segments, which do not match existing capabilities of the firm, each firm will need to make a decision based on its own circumstances. However, several businesses we have worked with have chosen not to pursue such segments. For example, a large telecom network provider has a policy of introducing competitors if its products represent a better solution for the customer.
3. Finalise segmented service strategy plan
The outcome of the process should be a detailed segmented service strategy plan.
The outcome of the process outlined in this framework should be a detailed segmented service strategy plan that identifies:
![]() the choice of strategic position in terms of the organisation's ‘offer’ and the rationale for it;
the choice of strategic position in terms of the organisation's ‘offer’ and the rationale for it;
![]() which segments are to be emphasised within each channel;
which segments are to be emphasised within each channel;
![]() the overall lifetime profit improvement opportunity based on selective improvement of service and resulting customer retention;
the overall lifetime profit improvement opportunity based on selective improvement of service and resulting customer retention;
![]() clear and detailed metrics so that future performance of the relationship marketing strategy is continually monitored and reviewed.
clear and detailed metrics so that future performance of the relationship marketing strategy is continually monitored and reviewed.
A key element is calculation of the net lifetime value profit potential from implementing a segmented service strategy for each segment.
SUMMARY
Understanding the value-creation process is crucial in turning the outputs of a company's strategy into programmes that both extract and deliver value. If companies place insufficient emphasis on the value they provide to key customers, as opposed to the income they derive from them, they can seriously diminish the impact of the offer in terms of its perceived value to customers. Achieving the ideal equilibrium between giving value to customers and getting value from them is a critical component of relationship marketing and requires the company to manage the perception and projection of value within the reality of acquisition and retention economics.
Relationship marketing, with its focus on building long-term relationships, makes new demands on the measurement systems in organisations. Many organisations are not using appropriate metrics to guide their relationship marketing strategy. In particular, the retention of customers is now recognised as being critical to the profitability of organisations, yet our results show that organisations typically spend less than one quarter of their marketing budget on retaining customers.
Marketing activity directed at retaining customers can be expensive and needs to be closely evaluated against measured results.
However, marketing activity directed at retaining customers can be expensive and needs to be closely evaluated against measured results. The most successful retention programmes segment customers according to their existing and potential lifetime profitability and identify the type and frequency of marketing activity that should be directed at each segment. More refined segmentation strategies, based on service requirements and relative performance, represent a great opportunity to build greater long-term customer value.
We have emphasised the importance of customers in the process of value creation. But for relationship marketing to be successful, organisations need systematically to consider additional stakeholders including employees, shareholders, suppliers, alliance partners, the media and others. In Chapter 3 we examine how the organisation can analyse and build stronger relationships with all its key stakeholders.
References
1 This section draws on Christopher, M. (1997), Marketing Logistics, Oxford: Butterworth-Heinemann.
2 Davidow, H. (1986), Marketing High Technology, Free Press, p. 172.
3 Raphel, M. and Raphel, N. (1995), Up the Loyalty Ladder – How to Make Your Customer Your Best Promoter, Dublin: The O'Brien Press.
4 Jones, T. and Sasser W.E. (1995), ‘Why Customers Defect’, Harvard Business Review, November-December, 88–99.
5 This example draws on: Payne, A.F.T. and Frow, P. (1999), ‘Developing a Segmented Service Strategy: Improving Measurement in Relationship Marketing’, Journal of Marketing Management, 15, 8, 797–818. and Payne, A. and Frow, P. (1997), ‘Relationship Marketing: Key Issues for the Utilities Market’, Journal of Marketing Management, 13, 463–47.
6 Reichheld, F. F. and Sasser, W.E. Jr. (1990), ‘Zero Defections: Quality Comes to Services’, Harvard Business Review, September-October, 105–11.
7 Payne, A.F.T. and Frow, P. (1999), op. cit.
8 Heskett, J.L., Jones, T.O., Loveman G.W., Sasser, E.W., Jr and Schlesinger, L.A. (1994), ‘Putting the Service-Profit Chain to Work’, Harvard Business Review, March-April, 164–174.
9 Payne, A.F.T. (2001), The Value Creation Process in Customer Relationship Management, draft working paper, Cranfield School of Management.
10 McDonald, M. and Dunbar, I. (1998), Market Segmentation: How to Do It, How to Profit From It, 2nd edn, Macmillan Business.
11 Christopher, M. (1992), The Customer Service Planner, Oxford: Butterworth-Heinemann.
12 Smith, D. and Prescott, J. (1987), ‘Couple Competitive Analysis to Sales Force Decisions’, Industrial Marketing Management, 16, 55–61.