Appendix A
Evaluating
the SPIN Model
More than a century ago Lord Kelvin wrote, “If you cannot measure it—if you cannot express it in quantitative terms—then your knowledge is of a meagre and insignificant kind.” How right he was! But alas, today we live in an age that has lost the exuberance of the great nineteenth-century scientific investigators. Measurement, proof, and careful testing don’t generate the same excitement that they did in the golden age of science. As a result, our work on testing the validity of the SPIN Model gets relegated to an appendix like this instead of being bang in the middle of the book where Lord Kelvin would have put it.
If you’re the one person in a hundred who bothers to read the appendix in a book like this, then you deserve my admiration and gratitude. Personally, I find the material here to be the most exciting part of our work. I hope you’ll find it rewarding too.
My topic is an intriguing one—proof. How do we know that the methods I’ve described in this book really contribute to sales success? This has been the most difficult challenge in our research—collecting solid evidence that the ideas we’ve developed really bring a measurable improvement in bottom-line sales results. As far as I can tell, we’re the first research team to bring rigorous scientific methods to establishing whether particular selling skills result in measurable productivity improvement.
Many people, of course, have made claims that their models and methods bring dramatic improvements in sales results. As I look through my junk mail today, there are several enticing promises of success. “Double your sales,” claims a 1-day program. “At last,” says another, “a proven method that will increase your sales by up to 300 percent.” A third offering tells me, “After this program, the sales of our Branch went through the roof. Yours will too!” Yes, there’s no shortage of claims made by training programs that their methods bring measurable improvement. But how many of these dramatic cases stand up to close scrutiny? None that I’ve looked at. Unfortunately, when you examine them closely, most of the heavily advertised “miracle cures” in sales training look remarkably similar to the claims made for snake oil a couple of hundred years ago.
I’m not being unduly malicious when I draw parallels between sales training and snake oil. Many of the purveyors of snake oil, miracle mixtures, and wonder medicines sincerely believed that they had found a great cure. Their sincerity was based on a simple misperception. Put yourself in the shoes of an eighteenth-century country doctor. You’re treating a very ill patient. You’ve tried everything, yet nothing seems to work. So, in desperation, you put together a mixture of herbs and potions. Your patient takes the mixture and recovers. Eureka! Your medicine works; you’ve found a miracle cure. What you don’t see, in your enthusiasm, is that the patient was getting better anyway. For the rest of your life you honestly believe it was your mixture that caused the recovery.
That’s exactly what happens with most sales training. The designer puts together a mixture of concepts and models—and administers it in the form of a training program. Afterward there’s an increase in sales. So, in all sincerity, the training designer concludes that the training has caused the increase. I spent 3 years doing postgraduate research into training evaluation. Over and over again I’d come across this miracle-cure phenomenon. I recall, for example, a trainer from a large chemical company telling me that he had a program that doubled sales. Sure enough, he had figures to prove his point—the sales of his division had risen by 118 percent since the training. On looking closely at the curriculum, however, I found it was little different from the training that his division had been running for years. I couldn’t find anything to justify a sudden 118 percent increase in sales. But looking at the market told a different story. A large competitor had gone out of business because of industrial disputes, new products had been introduced, and prices had changed. On top of that, there were several significant changes in sales-force management and policy—not to mention a major advertising campaign. It’s reasonable to suppose that each of these factors had a much larger impact on sales than a conventional sales-training program did. In my judgment, the patient would have recovered without the miracle cure—the training was snake oil.
During my evaluation research I investigated many claims for sales increases resulting from training. More than 90 percent of them could be accounted for more easily by other management or market factors. There are so many variables that affect sales performance—and training is just one factor. In almost every case we studied, there was a more plausible reason for the increase. I’m not doubting the sincerity of those who tell you how their wonderful sales method has doubled results. But as with any miracle cure, you’ve got to ask whether the patient would have done equally well without the medicine.
Correlations and Causes
Whether we’re talking about medicine or training, it’s extremely difficult to prove that one’s “cure” is effective. Yet that’s a difficulty I now face in this chapter, because the question I want to answer for you is “Does this stuff work?” What’s the evidence that the ideas we’ve put forward here will make a worthwhile contribution to your sales results? If you’re going to invest time and effort in practicing the sales skills I’ve described, you’ll need to know that I’m offering you more than snake oil. But how can I prove to you that the SPIN process increases sales?
Let me start with how not to do it (Figure A.1). In the early days of the SPIN Model we were working with a capital goods company based just outside New York. The training staff were anxious to test whether the model brought improved sales results. They measured the average monthly sales for the 28 people they trained. For the 6 months before training, the average sales were 3.1 orders per month. But in the 6 months after the training, the average sales rose to 4.9 orders per month—an increase of 58 percent.

Figure A.1. A misleading example of improvement: SPIN brings a 58 percent increase in orders ... or does it?
Can we conclude that the SPIN Model increases orders by 58 percent? This would be a very unwise conclusion. Let’s look more closely at the result. In the 6 months following the program, two important new products were introduced. Sales territories were redrawn, and 23 of the 28 trained people were given larger territories with greater sales potential. Company sales increased during this time by approximately 35 percent—and most of this increase came from untrained people. As we looked more closely, it became clear that we were in danger of kidding ourselves that SPIN was a miracle cure when, in reality, we had no way to tell what part of the increase was due to SPIN and what part resulted from other factors.
In the same vein, I have to advise you not to be taken in by this glowing little report of another SPIN evaluation. This one is from Honeywell’s Management Magazine:
Our European sales force was oriented primarily to product and shortcycle selling. We needed a truly effective program... that could be applied universally to our varied European markets. Late in 1978 the SPIN program was adapted into all European languages. There was a 20% increase in sales success... which may rise higher as the salesmen sharpen their SPIN techniques.
Yes, following the implementation of the SPIN approach there was a 20 percent increase in sales. But what this report doesn’t tell you is that Honeywell introduced a number of important new products to Europe that year, including the revolutionary TDC 2000 process control system. It’s quite possible that the products created the whole increase. In Honeywell’s case there’s no way we can tell whether the SPIN approach is any improvement on snake oil.
Control Groups
The most serious weakness of results like these is that the trainers didn’t set up a control group—a matched group of untrained people who could provide a baseline against which changes in the performance of the trained group could be judged. I imagine that the majority of readers will know about control groups and how important they are for any experimental work. But you may not know that much of the early use of control groups was in medicine, where they were used in an attempt to sort out whether a cure was genuine or just snake oil. If the trainers had set up a control group of 28 matched, untrained salespeople, we could have compared the performance of the two groups to obtain a truer picture.
But even with a control group, results can be misleading. Here’s a study that seems, on the surface, a very convincing test of whether the SPIN Model brings improved performance in major sales.
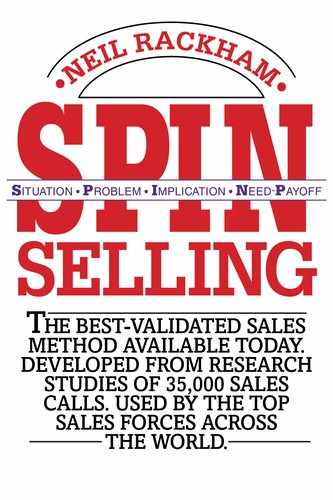
The Case of the Plausible Explanation. A large multinational company decided to test the SPIN Model by training a whole major-account branch of 31 salespeople. As a control, it chose other branches that were not given the training. If the trained branch improved more than the others, then this wouldn’t be due to the market or the products because these factors applied equally to both the control and the experimental branches. Even more important, there were no significant changes in people—the branch had unusually low turnover at the sales and management levels. Perhaps, this time, we had a valid test of whether the SPIN approach brings productivity.
The results, a 57 percent gain compared with the control group, certainly look convincing (Figure A.2). But we have to ask the standard evaluator’s question: “Is there any other equally plausible way to explain this increase?” Unfortunately for us, there is. The branch had been created very recently—just 4 months before the SPIN training. The average selling cycle for the product range was 3 months. So the productivity improvement could well have been caused by the time required for a new branch to get up to speed, coupled with the delayed effects of a 3-month sales cycle. Once again, our “proof” can be explained away.
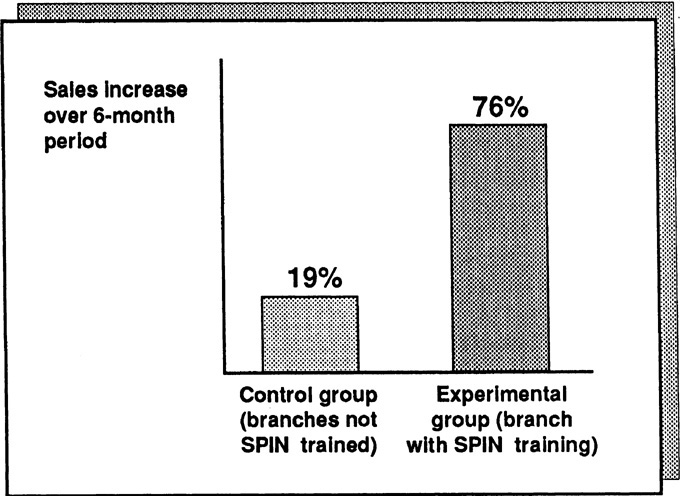
Figure A.2. A misleading control-group study.
In our research files, we’ve many similar examples of evaluation studies that look plausible at a first glance but don’t stand up to close scrutiny. Here’s one more case to make the point.
Foiled Again. A large business-machines company decided to evaluate the SPIN methods in a seasonal market where February was a peak month. In order to compensate for seasonal and market effects, it used as control groups every other branch that operated in the same market. The company tracked the order record of each branch before and after the experimental branch was trained in early January. As can be seen in Figure A.3, the SPIN-trained branch showed an impressive productivity gain compared with the others. This time, unlike our earlier studies, all five branches were well established—so there wasn’t a problem about the selling cycle or the learning curve. Could this be the proof we’d been looking for? Unfortunately, it wasn’t.
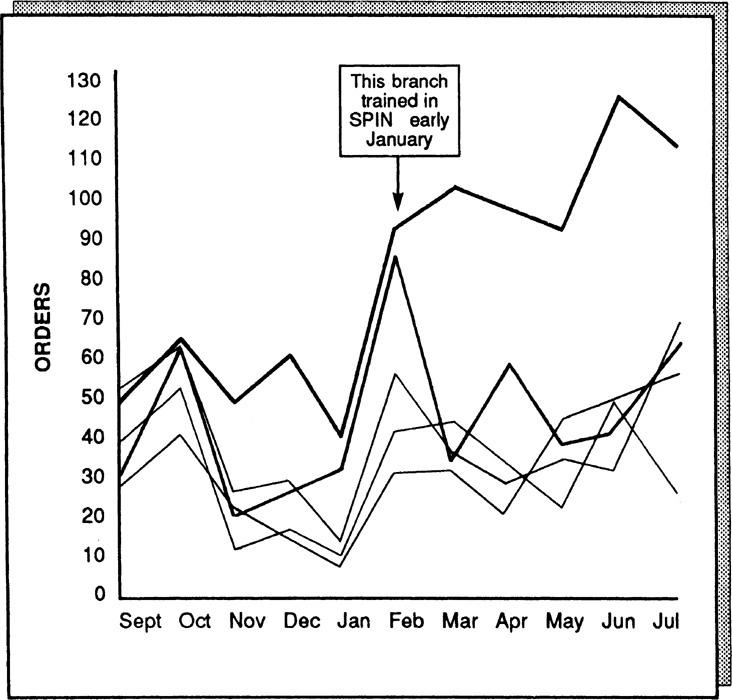
Figure A.3. Productivity gain of SPIN-trained branch compared with four control groups.
In November the branch manager had changed. How do we know whether the dramatic improvement in productivity was caused by the SPIN Model or by the new sales-activity management system introduced in December? The question is unanswerable. Nevertheless, the company attempted an answer of sorts by interviewing all participating salespeople. They asked each person to estimate how much of the change was due to the SPIN training and how much to other causes. Although everybody obligingly gave an estimate, the fact that their most common response was that 50 percent was due to SPIN makes me suspicious. Whenever people reply, “50 percent,” to any question about causes, I interpret this as meaning that they haven’t a clue.
Failure after Failure
You can never entirely eliminate the effects of other organizational and market factors—which means that it’s extremely difficult to obtain convincing proof of any selling model. Heaven knows, we’ve tried. We got one organization to agree not to change products, management, or salespeople for the whole of a 6-month test period. For a while we were convinced that we had an evaluation study that would stand up to the toughest scrutiny Then, just as we were moving smoothly into the third month of the test, the wretched competition cut its prices by 15 percent. Our client, forced to respond quickly, changed prices, people, and product introductions. Another test ruined!
We thought we finally had all the important factors under control in a high-tech company. The test branch was doing well—73 percent ahead of the control branches—and this time we were convinced we had a winner. Halfway through the test, however, we fell victim to one of the branch managers from the control group. Before the test, he’d been top branch and proud of it. But now, seeing that the test-branch figures were looking much better than his own, he decided to take action. In the dead of night he raided the training department’s files and made a copy of all the program materials we’d used with the test branch. Returning home with his loot, he swore all his salespeople to secrecy and ran his own training classes using the stolen material.
It ruined our test. Although I was furious at the time, looking back I can’t help thinking it’s the most convincing evaluation study of all when your methods are good enough for a sales manager to drive 600 miles in the middle of the night to steal them.
Is Proof Possible?
In 1970 I wrote a book on training evaluation with Peter Warr and Mike Bird. One of our conclusions was that the difficulties involved in controlling real-life variables made it almost impossible to prove that training increased productivity. While we were writing the book, we discussed an “ideal” evaluation study. Mike Bird and I shared an office and we spent hours thinking about how we would set about designing the perfect piece of evaluation.
“If you look at it simply,” Mike said, “the way most people set about evaluation is like this.” He drew a picture on the blackboard (Figure A.4). “But,” he added, “look at all the complicating variables. How can you possibly prove whether any change is due to training?” He quickly sketched in some of the other factors (Figure A.5).
Figure A.4. The usual way of evaluating sales training.
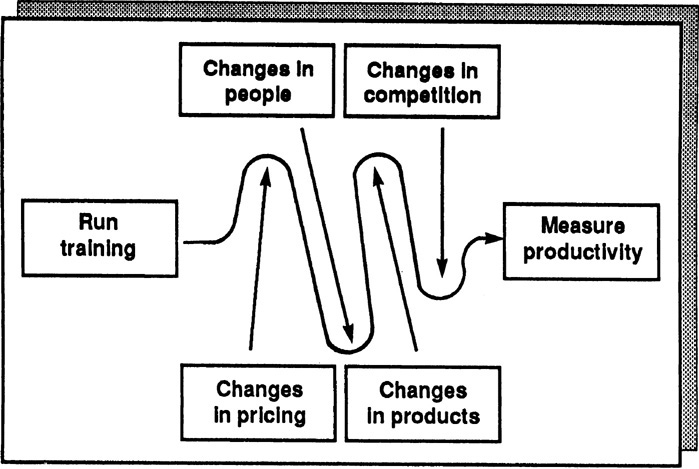
Figure A.5. Variables complicating accurate measurement.
This was turning into a depressing conversation, because I’d just been reading Karl Popper, the philosopher who’s best known for suggesting that you can’t prove anything. What Popper had suggested is that the only way science can “prove” something is by continually trying to disprove it and failing. “Could we adopt that kind of approach?” I asked. “Just suppose that instead of trying to prove that training brings productivity, we attacked the problem from the other end and tried to disprove any productivity effect. Would that be better?”
We didn’t take the conversation further—but years later, as I wrestled with the problems of testing whether our SPIN approach worked, I remembered that discussion with Mike. Should we forget about proof and instead set about disproving the idea that the skills described in this book cause more sales?
Proof or Disproof—Does It Matter?
As a practical person, you may find my researcher’s obsession with proof or disproof to be an academic form of overkill. In my defense I’d say that many billions of dollars are being wasted each year, teaching selling methods without one scrap of proof to show whether or not they work. No other area of business is so casual about testing its products or methods. Civilized society would collapse if manufacturing design showed the same lack of concern with product effectiveness that I see in most training-design organizations. Just because it’s difficult to measure the effectiveness of a sales approach doesn’t mean we shouldn’t try. On the contrary, the difficulties make it all the more important. Without honest attempts at better measurement of sales-training effectiveness, we’ll continue to waste billions of dollars that could be spent more productively elsewhere. I don’t really care whether the emphasis is on proof or disproof. But I do passionately support anything that will give better measurement and testing, because without these tests, my profession is in the snake-oil business.
If you’ll forgive me a moment of preaching, I hope you’ll see this concern with thorough evaluation as being in your interest. Our reason for all these measurements and tests is that we’re trying to make sure that what we give you will work. There used to be an old army saying: “If it moves, shoot it, and if it doesn’t move, paint it.” Huthwaite’s equivalent is: “If it moves, measure it, and if you can’t measure it, shoot it.” Measurement and testing is almost an obsession with us.
Stages of Disproof
In pursuit of our enthusiasm for a rigorous measurement of the SPIN approach, my Huthwaite colleagues and I spent unreasonable amounts of time struggling with the problems of proof and disproof (Figure A.6). We decided that before we looked at productivity gains (Test 3), we first needed to pass two other tests—or opportunities for disproof, as Popper would have called them.
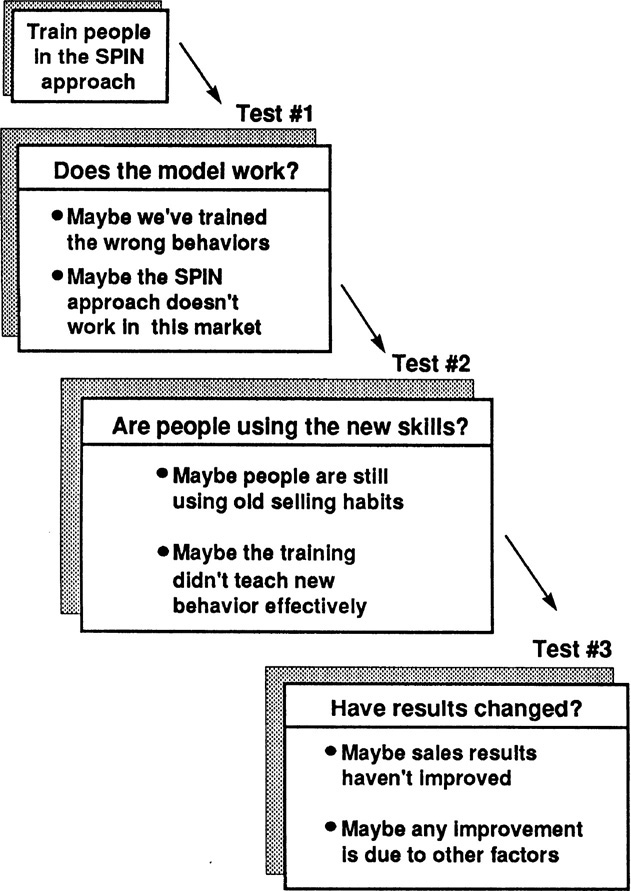
Figure A.6. Stages of proof and disproof.
Test 1: Do These Skills Make Calls More Successful? How did we know we were teaching the right things? Before we could begin to answer elaborate questions about productivity change, we needed first to test whether the models worked. For example, suppose we were teaching a major-account team a traditional low-value sales model that involved asking open and closed questions, giving Advantages, and then using closing techniques to gain commitment. From the evidence we’ve presented so far, it’s not likely that adopting this model would make major-account sales calls more successful. Even if there were substantial productivity gains after the training, they would probably have been caused by other factors. So before we started to measure productivity gains, our first test had to establish whether we were teaching the right things.
Generically, we knew that the SPIN Model passed this test because it was derived from studies of successful calls. So there was a high probability that if we taught the SPIN skills, we would be teaching something that would make calls more successful. But if we wanted to design the ultimate evaluation study, we’d have to go beyond this. We’d have to answer a very specific question about the individual salespeople whose productivity we intended to measure. We couldn’t rely on studies we’d done in other companies, in other markets, or with other groups. What if this group was different? How did we know that just because SPIN worked somewhere else, it would work here? In the ultimate evaluation test we would start by doing some research to establish what a successful call looks like for the group of people we’re going to train. We wouldn’t take the chance that unique factors in terms of their geography, market, products, or sales organization might invalidate our results. If, from this first test, we could collect solid evidence that the things we were teaching worked for this set of individuals, then we would have eliminated one more source of disproof.
Test 2: How Do We Know That People Are Using the New Skills? The next test in our quest for disproof would be to discover whether people were actually using the new skills in real calls after the training. I was once caught out on this test. We were measuring productivity improvement in a group of salespeople from a division of General Electric. In the 6 months after the SPIN-based training, sales had risen by an average of 18 percent. Could we claim the credit? Alas, no. By watching these people sell before and after the training, we established that they weren’t using significantly more of the SPIN behaviors afterward than they were before we trained them. Once again we had disproved that the productivity gain should be credited to us.
This test, which measures whether the training has made people behave any differently in their calls, is rarely if ever carried out by training designers. It’s a pity. We’ve learned a lot about effective training design by analyzing the amount of behavior change our programs have caused. I’m sure that other designers would also find this kind of measurement more useful than the usual smiles test—“the training must be good because people say they liked it”—which is the normal extent of training evaluation.
An Evaluation Plan
Bit by bit we were developing a specification for a very sophisticated and thorough method that we could use to evaluate the effectiveness of our SPIN Model. The evaluation steps would be:
1. Watch a group of major-account salespeople in action to find out whether there are more SPIN behaviors used in their successful calls than in the calls that fail. If so, we’ve passed Test 1; we now know that the model works for this group of people.
2. Train the group to use the SPIN methods that we’re trying to evaluate.
3. Go out with each person in the group after the training to discover whether they’re now using more of the trained behaviors during their calls. If so, we’ve passed Test 2; we know that people are actually using the new skills.
4. Assuming that we pass on Test 1 and Test 2, measure the productivity gain compared with control groups as Test 3.
It seems an elaborate method, but we didn’t see any alternative. We searched for a simpler answer, but none of the usual superficial evaluation tests stood up to close examination. The author and corporate planning expert Michael Kami once told me, “For every complex question, there is a simple answer—and it is wrong.” We were forced to agree with him. If we wanted a solid evaluation of a complex problem, we’d have to accept a difficult method for getting there.
A Test with Kodak—Almost
We took our evaluation plan to a number of clients and tried to interest them in it. This is a polite way of saying that we tried to get them to pay for a very expensive test. Most of them, realizing how costly the test would be, encouraged us to take our evaluation elsewhere. For a time we had high hopes of a full test with Kodak—an organization with a long tradition of careful testing of new methods. Kodak was considering using SPIN-based training worldwide across all its divisions involved in major sales. An evaluation test seemed a sensible first step. We agreed to test the model by observing a group of salespeople from Kodak’s Health Sciences Division. Sure enough, the SPIN Model worked exactly as our research had predicted. Implication and Need-payoff Questions were more than twice as frequent in successful calls as in the ones that failed.
Next we trained the pilot group and, after the training, went out to observe whether its people were using the new skills. Once again, things looked good. Benefits had trebled, Implication Questions had trebled, and Need-payoff Questions had doubled. The people were now using more of the successful behaviors than they were before the training.
We were delighted. For the first time we were about to begin a productivity test where we could say, “We know the model works and we know these people are using it in their calls.” Then came one of those good news, bad news bombshells. The good news was that Kodak was so happy with the pilot test that it had decided to adopt the SPIN methods worldwide. The bad news was that Kodak was so convinced by its people’s reactions to the pilot that it saw no point in elaborate and costly productivity tests. The “smiles test” had stabbed us in the back!
Enter Motorola Canada
We were just remarking to ourselves that the evaluator’s lot was one of unrelieved woe when we had an offer we couldn’t refuse from Motorola. Like Kodak, Motorola wanted to test the SPIN Model with the intention, if it worked, of adopting it worldwide. Its chosen test group was the Communications Division of Motorola Canada. This time we were careful to set the evaluation study in concrete well before the project, so that none of our tests would escape. As an added bonus, Motorola hired an independent evaluator, Marti Bishop, who had worked with our models and methods in her previous job as Evaluation Manager in the Xerox Corporation. Her function was to test the effectiveness of the SPIN program rigorously, going through the full steps we had outlined for the ideal productivity evaluation.
I now quote from a condensed version of her report:
Motorola Canada Productivity Study
This report is a productivity analysis of the SPIN program that was conducted during the third quarter of 1981.
It sets out to answer these questions:
q Does the SPIN Model work in Motorola Canada?
q Are people using the model after the training?
q Has this led to measurable improvement in their productivity?
Does the Model Work?
Motorola’s first concern is to test whether the SPIN behaviors predict success in Motorola’s sales calls in the way that they have proved successful in other companies.
To test this, we traveled with each of the 42 sales reps who were to be trained and analyzed the frequency of the SPIN behaviors in their successful and unsuccessful calls. We found that all SPIN behaviors were at a higher frequency in the successful calls:

The SPIN training concentrated on developing an increased number of Problem Questions, Implication Questions, Need-payoff Questions, and Benefits. As each of these behaviors is at a significantly higher frequency in Motorola Canada’s successful calls, we can conclude that the training is teaching people behaviors that should help them sell more effectively.
Have People Changed?
There’s evidence that the model works in Motorola. The next step must be to show that the 42 people who were trained are actually using the new behaviors in their calls. To test this, we observed people selling before the training period, during the training period, and after it in order to determine whether they are now behaving differently with their customers.
We sampled each of the 42 people at five points (Figure A.7). The first time we went out with them was immediately before the training. The other four times were at intervals of approximately 3 weeks during the training period itself. At the start of the training, people were asking more Situation Questions (average 8.6 per call) than the combined total of Problem plus Implication plus Need-payoff Questions (average 5.8 per call). So the three questioning behaviors statistically associated with success were being used less than Situation Questions—the one questioning behavior not significantly associated with success.

Figure A.7. Motorola Canada: Changes in questioning behavior.
By the end of the training period, however, this had been reversed. The frequency of the successful questions had risen to 8.8 in the average call, while the level of Situation Questions had fallen. In terms of questioning behavior, we can safely conclude that the 42 salespeople are now behaving in a more successful way than before.
At the start of the training, the Benefits were at an average level of 1.2 per call (Figure A.8). By the end of the training, Benefits rose to 2.2 per call. Remember that Benefits, of all the behaviors, are the ones most predictive of success in Motorola Canada calls. Your salespeople are now giving customers almost twice as many Benefits per call as they were before the training. In view of this, it would not be surprising if this pilot results in measurable sales increases.
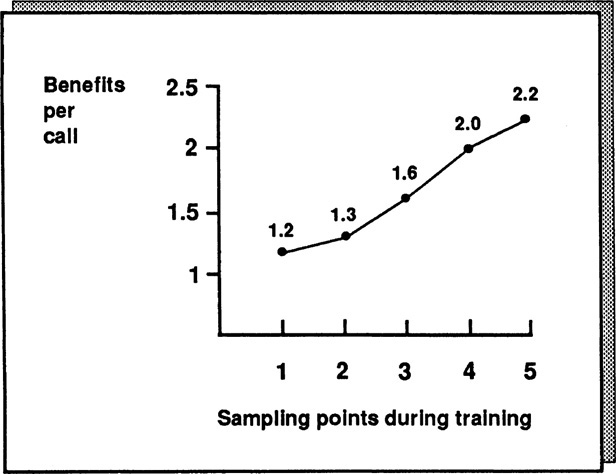
Figure A.8. Motorola Canada: Changes in Benefits per call.
Has Productivity Changed?
To measure productivity change, I have:
![]() Examined the sales results for the 42 people in the pilot and compared them with a control group of 42 untrained salespeople from Motorola Canada.
Examined the sales results for the 42 people in the pilot and compared them with a control group of 42 untrained salespeople from Motorola Canada.
![]() Compared the results for three time periods:
Compared the results for three time periods:
![]() Three months before the SPIN training
Three months before the SPIN training
![]() Three months during the SPIN implementation period
Three months during the SPIN implementation period
![]() Three months after the implementation
Three months after the implementation
![]() The results therefore span a 9-month period.
The results therefore span a 9-month period.
![]() Measured sales in terms of:
Measured sales in terms of:
![]() Total orders
Total orders
![]() Orders from new accounts
Orders from new accounts
![]() Orders from existing accounts
Orders from existing accounts
![]() Dollar value of sales
Dollar value of sales
In terms of total orders (Figure A.9), the 42 people in the control group have shown a 13 percent fall from their original pretraining level. This is due to the competitiveness of the communications marketplace, coupled with the extremely difficult Canadian economy. In contrast, the SPIN-trained group has shown a 17 percent gain, reversing the trends of a difficult market. This gross difference of 30 percent in order rate between the control and experimental groups is statistically significant.
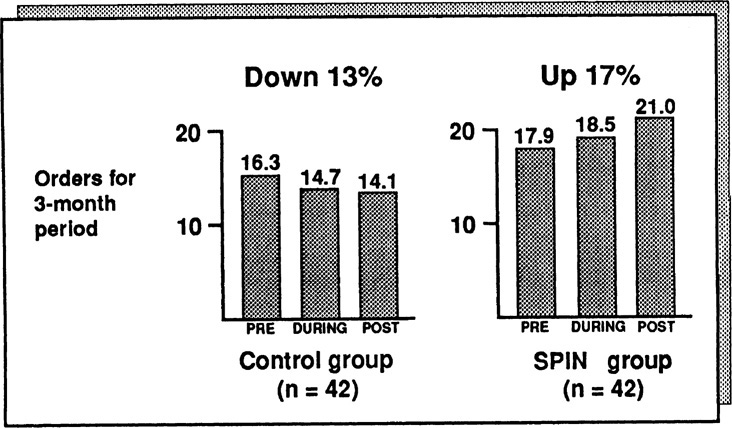
Figure A.9. Motorola Canada: Changes in total order levels.
The management of Motorola Canada is focusing its effort on increasing new business and wants to know whether the SPIN training made a significant contribution to new-business sales. As Figure A.10 shows, new-business sales from the control group increased only during the training period, when the sales organization was putting great effort into new-business sales; in the period after the training, sales fell back to below their original level, reflecting the difficulties in the market. In contrast, the SPIN-trained group showed an order gain of 63 percent, reversing the generally poor market performance. It’s particularly interesting to note the increase in the SPIN-trained group’s orders in the period after the training had ended; this suggests that the new skills are now self-maintaining and can be expected to make a continued impact on sales productivity. Before the study, some of your sales managers had expressed reservations about the “soft” nature of the SPIN Model, with its emphasis on probing and not on the “hard” closing techniques that some managers felt to be essential to the new business sale in a very difficult and competitive market, but the results indicate that they have no reason to be worried. The SPIN training has succeeded in generating significant business against hard-sell competition.

Figure A.10. Motorola Canada: Changes in new-business order.
In terms of business generated from existing accounts (Figure A.11), the record of the control group is better. Both groups show a fall in business from existing accounts during the training. This is due to the sales organization’s focus on new business during that period. However, while the control group shows a 13 percent overall decline, the SPIN-trained group shows a 1 percent increase.
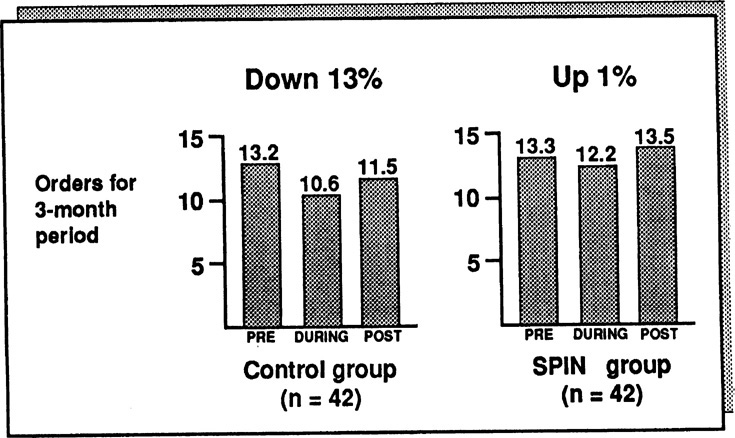
Figure A.11. Motorola Canada: Changes in orders from existing customers.
An increase in orders can be misleading. It’s possible that the productivity gain of the SPIN group was because it took more small orders, while the control group took fewer orders but each one had a greater dollar value. Because of this possibility, we needed to take a direct measurement of the dollar value of sales. Since dollar sales figures are confidential and this is a report for general release, we have therefore displayed the change in dollar value for the two groups in percentage terms to preserve confidentiality (Figure A.12). The control group showed a decline of 22.1 percent in terms of dollars sold; again, this reflects the extraordinarily difficult market conditions. The SPIN-trained group reversed this trend, showing an overall gain of 5.3 percent in dollar value. Note that these results suggest that some of the dramatic 63 percent order increase made by the SPIN group in the new-business area does come from a larger number of smaller orders.
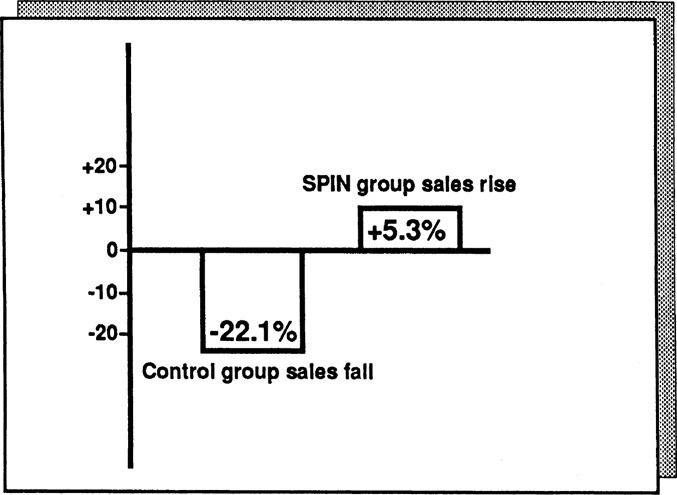
Figure A.12. Motorola Canada: Pre/post change in dollar value of sales.
In terms of dollar sales, the SPIN group is running at 27.4 percent above the control group. This difference is substantial and statistically significant. It would seem that the cost and effort of implementing the SPIN approach has been repaid many times over in terms of sales results.
Conclusions
These results suggest that the SPIN approach has succeeded in:
![]() Changing the skill levels of the people trained
Changing the skill levels of the people trained
![]() Increasing order levels, particularly in the new-business area
Increasing order levels, particularly in the new-business area
![]() Increasing the dollar volume of sales by an average of 27 percent above the control group
Increasing the dollar volume of sales by an average of 27 percent above the control group
Two Serious Flaws
Marti Bishop’s evaluation study represented the most detailed, rigorous, and comprehensive examination of a sales-training program ever carried out. I’ve quoted here from the summary version, but it’s just the tip of the iceberg. She used additional control groups, used methodologies involving sales managers in the data collection process, and used some sophisticated computer techniques to build success models and analyze results. But as powerful as this study is, it still doesn’t contain that elusive “proof” we were looking for.
If I wanted to discredit the Motorola study, I’d point out two flaws, each of which could be potentially serious enough to give a strict methodologist palpitations:
1. The control group starts from a lower point than the SPIN group. If you look at order levels before training (Figure A.9), the control group averaged 16.3 orders and the SPIN group 17.9. Now this difference isn’t statistically significant, so perhaps it’s nothing to worry about. Nevertheless, a cynic might argue that the SPIN group did better in a difficult economy because it was a little better to begin with.
2. There might be a Hawthorne effect. This is a technical term for the artificial increase in results that you get when you pay attention to people. The name comes from the Hawthorne plant of Western Electric, where some of the early productivity studies were carried out in the late 1920s. In one of the Hawthorne experiments, researchers found that when they increased the intensity of the plant’s lighting, productivity rose. But to their astonishment, productivity also rose when they decreased the lighting levels. Their conclusion was that you can get a short-term increase in productivity just by giving people attention. In the Motorola study, you could argue, the productivity increase came from all the training attention that the SPIN group was receiving. It wouldn’t matter whether we trained the group in the SPIN methods or in aerobic dancing. Productivity would have risen anyway because of the Hawthorne effect.
I had a couple of standard answers prepared to counter any suggestion that the change was due to a Hawthorne effect. My first defense was that Hawthorne effects are much less common than most people suppose and that when they do occur, they are short-term, usually lasting for a matter of days at the most. The Motorola study, which spanned a 9-month evaluation period, would almost certainly be free of any serious Hawthorne effect. My second defense was: “Who cares? The fact is that we’ve increased productivity. If it’s a Hawthorne effect, then let’s Hawthorne the whole sales force and get a 30 percent increase in sales from everybody.” But my heart wasn’t in either of these answers. The researcher in me badly wanted to know whether a Hawthorne effect existed and, if so, how much it had contributed to the productivity gain.
A New Evaluation Test
Motorola was convinced enough by the study to adopt the SPIN methods worldwide. Being satisfied that the methods worked, it saw no value in further attempts to disprove the link between SPIN and productivity. In fact, Motorola dismissed my concern as an example of that rather quaint eccentricity which the English show in times of stress.
We needed a new client with enough doubt to justify another large-scale investigation. Salvation came in the form of a giant multinational business-machines company who, like Motorola, wished to test SPIN for worldwide application. With only moderate difficulty, I persuaded the company to let me carry out the remaining two tests that would plug the gaps in the Motorola study: (1) using a matched control group and (2) measuring the Hawthorne effect.
Before carrying out these tests, we went through the same methodology that we had used in Motorola. I’ll spare you the detailed findings, which were very similar to those in Motorola except for these differences:
![]() Situation Questions were 4 percent lower in successful calls. This is in line with our main research findings, which show that Situation Questions have a slightly negative effect on customers.
Situation Questions were 4 percent lower in successful calls. This is in line with our main research findings, which show that Situation Questions have a slightly negative effect on customers.
![]() As in Motorola, the Problem, Implication, and Need-payoff Questions were all significantly higher in successful calls. So were the Benefits. (But unlike Motorola, where Need-payoff Questions were the ones most strongly associated with success, the most powerful behavior in this study turned out to be Implication Questions.)
As in Motorola, the Problem, Implication, and Need-payoff Questions were all significantly higher in successful calls. So were the Benefits. (But unlike Motorola, where Need-payoff Questions were the ones most strongly associated with success, the most powerful behavior in this study turned out to be Implication Questions.)
The behavioral changes brought about by the training were greater in this implementation than in Motorola. As Figure A.13 shows, the Problem, Implication, and Need-payoff Questions almost doubled, while the level of Situation Questions remained fairly constant.
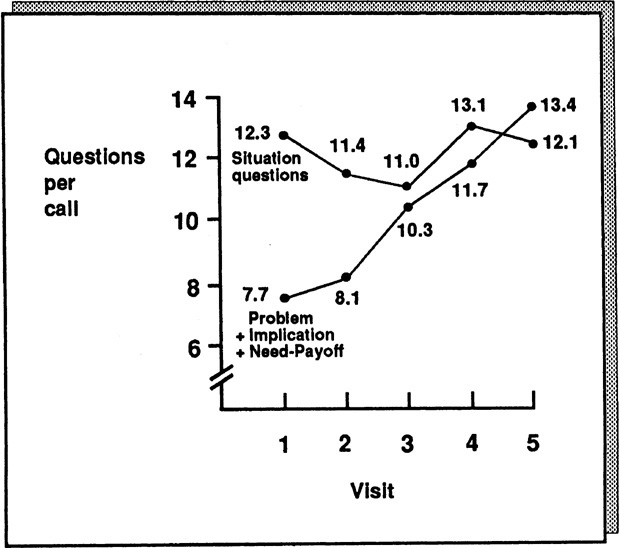
Figure A.13. Changes in questioning behavior.
The Benefits showed a particularly pleasing rise—from 1.1 per call to 3.4 (Figure A.14). This may not sound like much, but here’s how I looked at it. The 55 people trained in the study were making an average of 16 sales call per week, which means that in an average week before the SPIN training there were 968 Benefits offered to customers. At the end of the study, in an average week the same people were giving 2992 Benefits. It would be surprising not to get a significant increase in sales from these 2024 extra Benefits.

Figure A.14. Changes in benefits.
A Matched Control Group
Our opportunity in this study to match the control group with the experimental group so that both groups started with the same order level allowed us to test one possible weakness in our Motorola results—that the reason for the increase could be because the SPIN group started from a higher point. Again, as in Motorola, we compared the performance of each group for a 3-month pre period and a 3-month post period. The control group showed a 21 percent fall in orders, while the SPIN group showed a 16 percent gain under the same, unfavorable economic and competitive conditions (Figure A.15). This study was also carried out under unfavorable economic and competitive conditions, which accounts for the fall in the control group’s orders.

Figure A.15. Changes in productivity after training.
By having matched the initial order levels of the control and experimental groups, we could now confidently reject the idea that the reason for Motorola’s 30 percent gain in orders was that the SPIN group had better salespeople to begin with. That explanation couldn’t be true here, where the initial order levels of both groups were the same.
Measuring the Hawthorne Effect
The Hawthorne effect was harder to test. As far as we knew, nobody before us had ever tried to measure whether a Hawthorne element existed in sales training. As we thought about the problem, it became easy to see why we were the first. It’s not hard to measure the impact of plant lighting on output, but how do you measure whether a sales productivity gain is due to the SPIN Model or due simply to the fact that you’ve given attention to people by offering them training?
The method we adopted was a little complex, but this was inevitable, given the difficulty of the issue we were trying to measure. Basically, the approach we used was this:
1. We reanalyzed the productivity results from our group of 55 people trained to use the SPIN approach. Each of these people had exactly the same number of hours of training, so all 55 had received a similar level of attention. All had, so to speak, an identical dose of the Hawthorne effect.
2. We divided our 55 people into two subgroups. In any group that’s learning any skill—whether it’s golf, a foreign language, or selling—some people naturally learn more than others. From having measured their behavior in calls, we identified the 27 people who were displaying the most use of the SPIN behaviors and put them in one subgroup, and in the other subgroup we put the other 28, whose use of the SPIN behaviors was lower.
3. We compared the sales results of the two subgroups. If their productivity gains had been due entirely to a Hawthorne effect, then both subgroups should have shown identical gains, because both had received the same amount of training and management attention. But, if their productivity gains had resulted from using the SPIN Model, then the subgroup showing the greatest learning of SPIN should have had a significantly higher productivity gain than the subgroup showing a poorer level of learning.
4. Finally, we compared the performance of both subgroups with a similar-size control group of 52 untrained salespeople to make sure that the changes weren’t caused by a market, product, or organizational effect.
Once we’d decided on this methodology, we set about reexamining our data in an attempt to isolate the elusive Hawthorne effect. Our results are shown in Figure A.16, which reveals that there was a Hawthorne effect at work but that, as with most Hawthorne effects, its impact was short-lived.
First, let’s look at the performance of the subgroup of people higher on SPIN skills. In Figure A.16 their results show an increase during the training period, when they were receiving the most attention. But, more important, their results continue to improve after the training is over, when they are receiving no attention that might create a Hawthorne effect.

Figure A.16. Isolating the Hawthorne effect.
In contrast, the results from the subgroup of people lower on SPIN skills show a dramatic improvement during the 4-month training period. However, as soon as the training attention is withdrawn, their results slip back to the original level. Here we have the Hawthorne effect—isolated for the first time in the field of sales performance.
Finally, let’s look at the control group. Selling the same products in the same difficult capital goods market, their performance shows a decrease both during and after the other group’s training. So we can conclude that the improvement of the higher SPIN subgroup did not result from market, product, or organizational factors. Compared with the control group, even the performance of the lower SPIN subgroup looks good. Instead of showing a gradual decline, its people are at least holding their own.
Final Thoughts on Evaluation
There are even more tests I’d like to carry out before I’ll be totally satisfied that the ideas I’ve described in this book will significantly improve the results of major sales. It’s a never-ending quest. When I was growing up in Borneo there were no roads and all trips were by river. At any point of any journey, if you asked the boatman how much farther, you’d get the same reply—“Satu tanjong lagi”—which means “One more bend.” Evaluation studies are like that. Just when you think you’ve all the proof you need, there’s one more bend.
We’ll probably never get round that final bend. But I hope you’ll agree that in our search for proof, Huthwaite has explored the river carefully. We’ve tried to take an objective and critical look at our own models and whether they work—and by doing so we’ve become better researchers, designers, and trainers. Above all, we’ve been able to increase the practical effectiveness of our approach. Ironically, by going through these very academic-sounding testing routines, we’ve improved our understanding of what makes practical good sense, measured by its contribution to sales results. I wish more people in the training business could be persuaded to take a similar approach. It would be very satisfying to us if this book stimulated more research into effective selling. I’d like to think that eventually, through patient investigation and experiment, researchers will be able to take more of the mystery out of the major sale and make it as clearly understandable as any other business function.