
Get in, get out. That's the attitude that most developers have in testing and debugging their applications. Few developers look forward to these tasks during the development cycle; they want to efficiently get into the code, figure out what's working and what's not, fix any problems, and then move on.
Given the heterogeneous nature of Web applications, debugging has always been challenging, particularly when trying to work with client-side JavaScript. To address this need, fairly sophisticated debugging tools have emerged over the past few years among the developer community, most notably Firebug and other add-ons to Firefox. However, the problem is that most of these testing tools that Web developers have come to rely on for desktop browsers are not ideal for testing iPhone Web apps.
Many iPhone Web app developers, unsure of where else to turn, are tempted to resort to alert() debugging — you know, adding alert() throughout the body of the script code to determine programmatic flow and variable values. However, not only is this type of debugging painful, it can throw off the timing of your script, making it difficult or impossible to simulate real-world results. Although the number of debugging and testing tools is indeed limited right now for Safari on iPhone, you still have options that either work directly inside Safari or emulate it on your desktop. You will probably want to incorporate aspects of both as part of your regular debugging and testing process.
Because you are coding your iPhone Web app on a desktop computer, you'll find it helpful to also be able to perform initial testing on the desktop. To do so, you'll want to create a test browser environment that is as close as possible to the iPhone. iPhone emulation enables you to more easily design and tweak the UI as well as test to see how your Web application or site responds when it identifies the browser as Safari on iPhone.
If you are running Mac OS X, you're in luck because you have three strong options. However, if you are developing on Windows, your options are more limited.
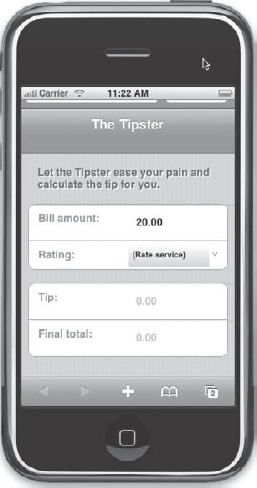
Your best option for simulating an iPhone on your desktop is to use the iPhone Simulator that is included with the Apple iPhone SDK. (The iPhone SDK is Mac OS X only.) Not only does this simulate the iPhone for testing native apps, but it has a built-in WebKit browser (see Figure 15-1) that simulates Safari on iPhone.

To use, simply click the Safari icon with your mouse. You can load your app from a bookmark or type a URL into the Address box (see Figure 15-2).
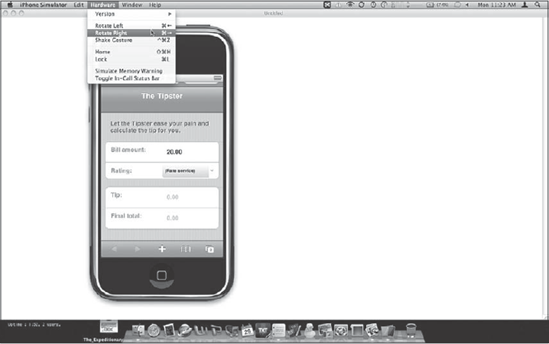
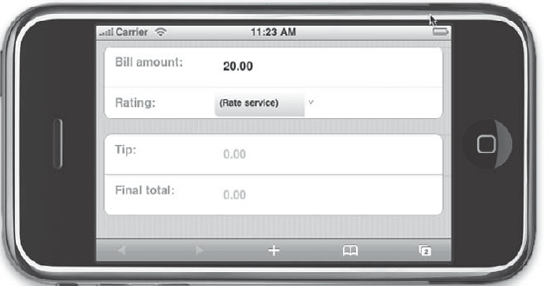
The iPhone Simulator is actually quite powerful. Not only do the controls inside the Safari browser work as expected, but you can simulate rotation from the Rotate Left and Rotate Right items on the Hardware menu (see Figure 15-3). You can then test your app in horizontal mode (see Figure 15-4).
If you don't want to download the full Apple iPhone Developer SDK to use its iPhone Simulator, you can use iPhoney, a free open source tool created by Marketcircle (www.marketcircle.com/iphoney).
iPhoney (see Figure 15-5) can be a valuable tool to use when you are initially designing an iPhone Web app UI as well as when you are performing early testing. One of the handy features of iPhoney is that you can easily change orientations between portrait and landscape (see Figure 15-6). iPhoney also allows you to spoof with the iPhone user agent, hide the URL bar, and turn off Flash and other add-ins.
Note that iPhoney requires Mac OS X.
Because Safari on iPhone is closely related to its Mac and Windows desktop counterparts, you can forgo these other custom tools and perform initial testing and debugging right on your desktop. However, before doing so, you will want to turn Safari into an iPhone simulator by performing two actions — changing the user agent string and resizing the browser window.
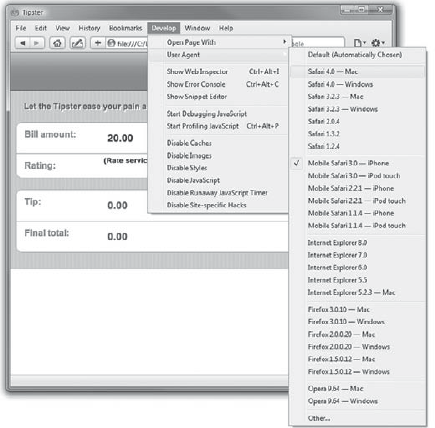
Safari on Mac and Windows allows you to set the user agent provided by the browser through the User Agent list, which is accessible from the Develop menu.
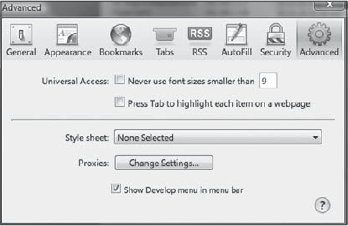
Note: If you don't have the Develop menu available from the top menu bar, go to the Preferences dialog box and click the Advanced button. You'll see a check box there to enable the Develop menu (see Figure 15-7).
With the Develop menu enabled, choose the desired iPhone user agent string you want to emulate in from the User Agent menu, as shown in Figure 15-8.
After you have selected an iPhone user agent, the desktop version of Safari appears to your Web app as Safari on iPhone.
To get the same viewport dimensions in Safari, you need to create a bookmarklet (see Chapter 14, "Packaging Apps as Bookmarks: Bookmarklets and Data URLs") and then add it to your Bookmarks bar. The code for the bookmarklet is as follows:
javascript:window.resizeTo(320,480)
Firefox has often been considered the browser of choice for Web application developers because of its support for third-party tools and add-ons, such as Firebug. However, when creating an application specifically for iPhone, it's usually best to work with Safari-specific tools. Fortunately, because Safari is so closely related to recent desktop versions of Safari, you can take advantage of the WebKit debugging tools that are provided with Safari for Windows and Mac. Because you are working with a close relative to Safari on iPhone, you still need to perform a second round of testing and debugging on an iPhone and iPod touch, but these tools can help you during initial Safari testing.
The Safari debug tools are accessible through the Develop menu (see Figure 15-9), which is hidden by default when you install Safari. (As I mentioned in the previous section, you can enable it from the Advanced section of the Preferences dialog box.)
Many of the menu items in the Develop menu are not relevant to iPhone Web app development, but a few are worth mentioning (see Table 15-1).
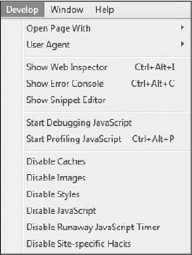
Table 15-1. Useful Safari Develop Commands for the iPhone Web App Developer
Name | Description |
|---|---|
| Spoof another browser, particularly Safari on iPhone. |
View and search the DOM and styles. | |
| View error and status info in the Web Inspector. |
Get instant rendering of an HTML snippet. | |
Turn on to log exceptions. | |
View JavaScript errors occurring on a page. | |
Toggle the timer that halts long-running scripts. |
The two Safari developer features worth special attention are the Web Inspector and JavaScript Console.
The best debugging feature available in Safari is certainly the Web Inspector. The Web Inspector, shown in Figure 15-10, enables you to browse and inspect the DOM of the current Web page. You can access this feature through the Develop menu. However, the handiest way to use it is to right-click an element in your document and choose the Inspect Element menu item. The Web Inspector is displayed, showing the element in the context that you selected in the browser window.
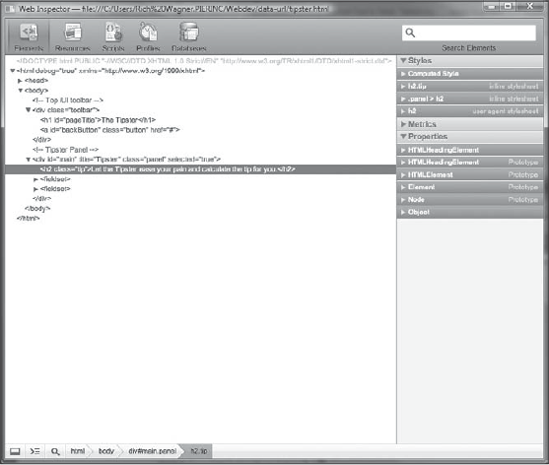
Here are the basic functions of the Web Inspector:
Selecting a node to view: When you click on a node in the Inspector pane, two things happen. First, the bottom pane displays node and attribute details, style hierarchy, style metrics, and property values. Second, if the selected node is a visible element in the browser window, the selected block is highlighted with a red border in Safari.
Changing the root: To avoid messing with a massive nested DOM hierarchy, you can change the context of the Web Inspector. Double-clicking a node makes it the hierarchical "root" in the Inspector pane. Later, if you want to move back up the document hierarchy, use the up arrow or the drop-down combo box.
Searching the DOM: You can use the Search box to look for any node of the DOM — element names, node attributes, even content. Results of the search are shown in the Inspector pane, displaying the line on which a match was found. If you want to get a better idea of the exact node you are working with, select it and then look for the red outlined box in the Safari window.
Viewing node details: The Node pane provides basic node information, including type, name, namespace, and attribute details.
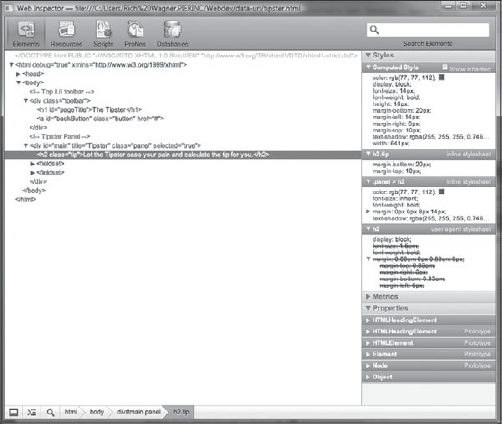
Viewing CSS properties: The Style pane displays CSS rules that are applied to the selected node (see Figure 15-11). It demonstrates the computed style of the selected element by showing you all the declarations that are used in determining the final style of rendering. The rules are lists in cascade order. Any properties that have been overridden are displayed with strikethrough text.
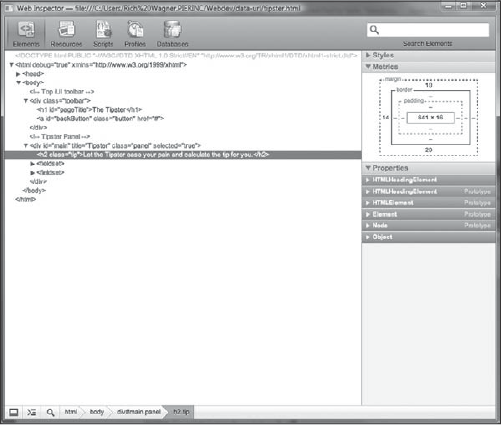
Viewing style metrics: The Metrics pane presents the current element as a rectangular block displaying the width × height dimensions, as well as the padding and margin settings (see Figure 15-12).
Viewing all properties: The Properties pane displays all the DOM properties (such as
idandinnerHTML) for the selected node. Because you cannot drill down on object types, this pane is less useful than the others.
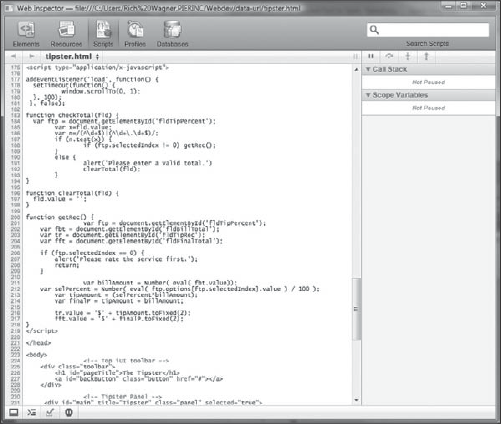
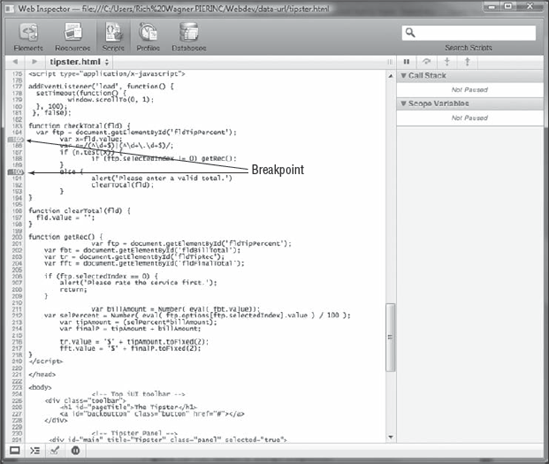
Safari's Web Inspector also sports a powerful Scripts Inspector, as shown in Figure 15-13. It's Safari's answer to alert() debugging: You can use it to inspect variables at point of execution, set breakpoints, step through your code, and view the call stack.
You can perform several tasks in the Script Inspector:
Setting breakpoints and stepping through code: You can set a breakpoint in your code by clicking the line number on the left margin of the code window. As Figure 15-14 shows, an arrow is displayed on the breakpoint line. When the line code is executed, the breakpoint is triggered. You can then step through the script as desired by clicking the Step Into, Step Out, and Step Over buttons. As you step through the code, Script Inspector updates its state for each line executed.
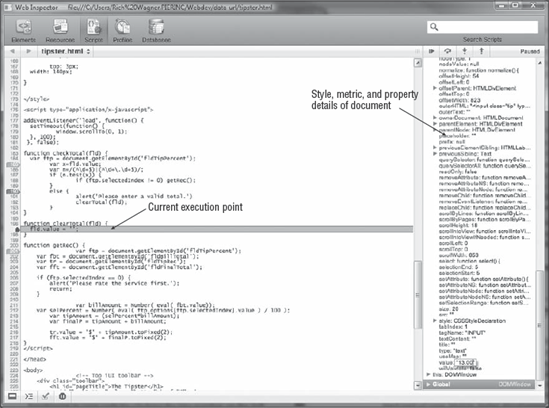
Inspecting variables: The Scope Variables box at the top of the Script Inspector window displays the variables in scope (local, closure, global). You can inspect these variables by right-clicking them and choosing Inspect Element. A new Web Inspector window is displayed on top of the existing window, as shown in Figure 15-15, showing the node in its hierarchy along with style, metric, and property details. Close the Web Inspector window to return to the current debugging session.
Although Script Inspector does not work directly with Safari on iPhone, it does serve as the most powerful debugging option that the iPhone and iPod touch application developers have in their toolkit.
So far, you've seen how to test and debug your iPhone Web applications on your desktop using desktop-based solutions. Although those tools are good for general testing or specific problem solving, you may need to spend time debugging directly on the iPhone or iPod touch devices themselves. Unfortunately, no robust debugging tools such as Web Inspector are available, but some basic debugging tools are available that should be a standard part of your Mobile Safari development toolkit.
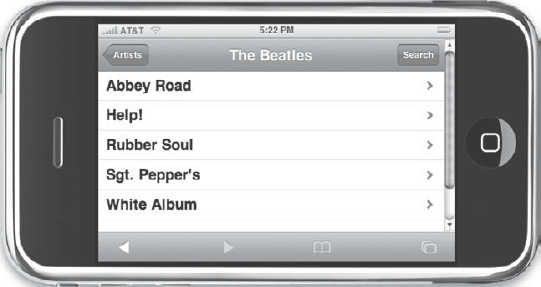
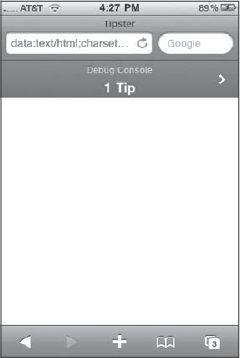
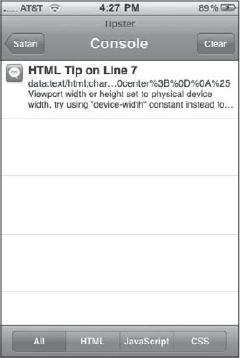
Safari on iPhone includes an integrated Debug Console. If active, the Debug Console displays below the URL bar when an error is encountered or when it has a recommended tip (see Figure 15-16). You can click the right arrow to display a list of console messages (see Figure 15-17). The errors can be filtered by JavaScript, HTML, or CSS.
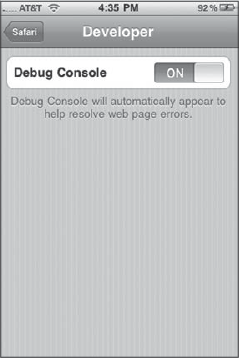
You can enable the Debug Console from the Settings app. Inside the Safari Settings, you can access a Developer. This panel enables you to turn on the Console with the slider control (see Figure 15-18).
The DOM Viewer, available from Brainjar.com, is a Web-based DOM viewer that you can work with directly inside of Safari on iPhone. The DOM Viewer provides an expandable tree structure that lists all the properties of a given node. When a property of a node is another node, you can view its properties by clicking its name. The tree expands to show these details. The DOM Viewer is housed in a separate HTML page that is launched in a separate window from the original page.
Although the DOM Viewer does not have the robust capabilities of the desktop Safari's Web Inspector, it does have the assurance that all the information you are looking at comes directly from iPhone's version of Safari, not its desktop cousins.
To use the DOM Viewer, follow these steps:
Download the source file at
brainjar.com/dhtml/domviewer.html. Save the file in the same folder as your application.Add a test link to your page to launch the viewer:
<a href="domviewer.html" target="_blank">View in DOM Viewer</a>
Alternatively, you can add a script to the end of your HTML page that you want to inspect:
<script type="application/x-javascript">
window.open('domviewer.html'),
</script>
The problem with this solution, however, is that iUI gets in the way of the default open action if you are using an iUI-based application.
Save the file.
Open the page inside Safari. If needed, click the View in DOM Viewer link.
The DOM Viewer is displayed in a new pane inside Safari (see Figure 15-19). Interact with it as desired.
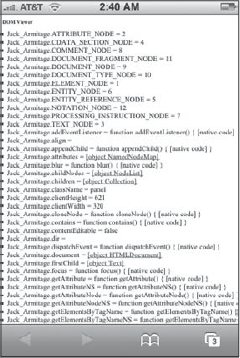
One of the things you will immediately notice when working with the DOM Viewer inside the small iPhone viewport is the sheer amount of information you have to scroll through to find what you are looking for. To address this issue, the DOM Viewer allows you to specify a particular node (identified by id) as the document root. Here's the code to add, specifying the desired element as the getElementById() parameter:
<script type="application/x-javascript">
  var DOMViewerObj = document.getElementById("Jack_Armitage")
  var DOMViewerName = null;
</script>
Because it references the desired element directly by getElementById(), you can add this code in your HTML page after the element you want to examine in the body but not before it.
Go to brainjar.com/dhtml/domviewer for full details on the DOM Viewer.
Debugging is one of those necessary evils of any developer's experience, whether you are developing iPhone Web apps, native apps, or desktop widgets. In this chapter, I explored the variety of debugging tools and features available to iPhone Web app developers. I began by showing you how to simulate the iPhone on your desktop computer. I continued on the desktop by diving into Safari's developer tools. The chapter closed out by looking at the debug features that you can utilize on the iPhone itself.